主要使用的框架 VUE + Element UI + Echarts
先上效果图:
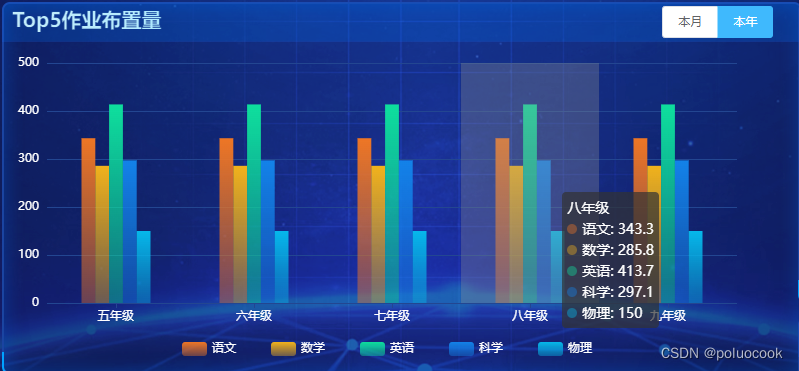
本项目使用了VUE Element Ui Echarts。
请在main.js里面引入,或是在页面里面单独引入。我是在全局里面引入的,所有没有在这个页面里面引入组件。
首先设计布局和图表。(背景为图片可以忽略)
HTML部分
布局使用了element的layout。
<template>
  <el-container>
    <div class="head">
      <el-row>
        <el-col :span="20">
          <div class="title">Top5作业布置量</div>
        </el-col>
        <el-col :span="4">
          <el-button-group size="small">
            <el-button size="small" @click="changeOutColor(1)" :type="outColor">本月</el-button>
            <el-button size="small" @click="changeinColor(2)" :type="inColor">本年</el-button>
          </el-button-group>
        </el-col>
      </el-row>
      <el-row>
        <div
          id="callOutChart"
          v-show="showChart == 1"
          :style="{
            height: '340px',
            width: '750px',
          }"
        ></div>
<!-- 图表一 -->
        <div
          id="callInChart"
          v-show="showChart == 2"
          :style="{
            height: '340px',
            width: '750px',
          }"
        ></div>
<!-- 图表二 -->
      </el-row>
    </div>
  </el-container>
</template>
样式代码:
<style scoped>
.head {
  height: 35px;
  width: 100%;
  line-height: 35px;
}
.title {
  font-weight: bold;
  font-size: 20px;
  background-image: -webkit-linear-gradient(
    right,
    #3fb5ff,
    #6fe2ff
  );
  -webkit-background-clip: text;
  -webkit-text-fill-color: transparent;
}   //标题文字

.el-button--danger {
  color: #fff;
  background-color: #1d86f0 !important;
  border-color: #1d86f0 !important;
} //按钮被选中
.el-button {
  color: #fff;
  background-color: #0a307e;
  border-color: #1d86f0;
} 按钮
</style>
实现代码:
<script>
import api from "@/api/charts";   //引入接口js
export default {
  mounted() {
    this.charts1();
    this.charts2();
  },
  data() {
    return {
      loading: false,
      outColor7: "danger",  //默认显示按钮
      inColor7: "",
      showChart: 1,
      xdata: [],
      ydata: [],
      adata: [],
      bdata: [],
      cdata: [],
      ddata: [],
      edata: [],

      ydata1: [],
      adata1: [],
      bdata1: [],
      cdata1: [],
      ddata1: [],
      edata1: [],
    };
  },
  methods: {
    async charts1() {
      await api.charts1().then((data) => {
        this.loading = false;
        data.map((item) => {
          this.ydata.push(item.grade);
          this.adata.push(item.language);
          this.bdata.push(item.math);
          this.cdata.push(item.english);
          this.ddata.push(item.science);
          this.edata.push(item.chemistry);
        });
      });

      // 基于准备好的dom,初始化echarts实例

      let callOutChart7 = this.$echarts.init(
        document.getElementById("callOutChart7")
      );
      // 绘制图表
      callOutChart7.setOption({
        legend: {
          bottom: "5%",
          itemGap: 35,
          textStyle: {
            color: "#fff",
            boderRadius: "20%",
          },
        },
        tooltip: {
          trigger: "axis",
          axisPointer: {
            type: "shadow",
          },
        },
        grid: {
          x: 35,
          y: 25,
          x2: 25,
          y2: 75,
        },
        xAxis: {
          type: "category",
          data: this.ydata,
          axisLine: {
            show: true,
            lineStyle: {
              color: "#234691",
              width: 0,
              type: "solid",
            },
          },
          axisLabel: {
            show: true,
            interval: 0,
            rotate: 0,
            textStyle: {
              color: "#fff",
            },
          },
          axisTick: {
            alignWithLabel: true,
          },
        },
        yAxis: {
          axisLine: { show: false },
          axisTick: { show: false },
          splitLine: {
            show: true,
            lineStyle: {
              color: ["#234691"],
              type: "solid",
            },
          },
          axisLabel: {
            show: true,
            textStyle: {
              color: "#fff",
            },
          },
        },
//柱状图柱子颜色渐变处理
        color: [
          {
            type: "linear",
            x: 0,
            y: 0,
            x2: 0,
            y2: 1,
            colorStops: [
              { offset: 1, color: "rgba(238,118,37,0.4)" },
              { offset: 0, color: "rgb(238,118,37)" },
            ],
          },
          {
            type: "linear",
            x: 0,
            y: 0,
            x2: 0,
            y2: 1,
            colorStops: [
              { offset: 1, color: "rgba(241,178,28,0.4)" },
              { offset: 0, color: "rgb(241,178,28)" },
            ],
          },
          {
            type: "linear",
            x: 0,
            y: 0,
            x2: 0,
            y2: 1,
            colorStops: [
              { offset: 1, color: "rgba(14,223,157,0.4)" },
              { offset: 0, color: "rgb(14,223,157)" },
            ],
          },
          {
            type: "linear",
            x: 0,
            y: 0,
            x2: 0,
            y2: 1,
            colorStops: [
              { offset: 1, color: "rgba(19,130,233,0.4)" },
              { offset: 0, color: "rgb(19,130,233)" },
            ],
          },
          {
            type: "linear",
            x: 0,
            y: 0,
            x2: 0,
            y2: 1,
            colorStops: [
              { offset: 1, color: "rgba(6,184,235,0.4)" },
              { offset: 0, color: "rgb(6,184,235)" },
            ],
          },
        ],
        series: [
          {
            type: "bar",
            barGap: "0%",
            barWidth: "10%",
            name: "语文",
            data: this.adata1,
          },
          {
            type: "bar",
            barGap: "0%",
            barWidth: "10%",
            name: "数学",
            data: this.bdata1,
          },
          {
            type: "bar",
            barGap: "0%",
            barWidth: "10%",
            name: "英语",
            data: this.cdata1,
          },
          {
            type: "bar",
            barGap: "0%",
            barWidth: "10%",
            name: "科学",
            data: this.ddata1,
          },
          {
            type: "bar",
            barGap: "0%",
            barWidth: "10%",
            name: "化学",
            data: this.edata1,
          },
        ],
      });
    },

    async charts2() {
      await api.charts2().then((data) => {
        this.loading = false;
        data.map((item) => {
          this.ydata1.push(item.grade);
          this.adata1.push(item.language);
          this.bdata1.push(item.math);
          this.cdata1.push(item.english);
          this.ddata1.push(item.science);
          this.edata1.push(item.chemistry);
        });
      });

      let callInChart7 = this.$echarts.init(
        document.getElementById("callInChart7")
      );
      callInChart7.setOption({
        legend: {
          bottom: "5%",
          itemGap: 35,
          textStyle: {
            color: "#fff",
            boderRadius: "20%",
          },
        },
        tooltip: {
          trigger: "axis",
          axisPointer: {
            type: "shadow",
          },
        },
        grid: {
          x: 35,
          y: 25,
          x2: 25,
          y2: 75,
        },

        xAxis: {
          type: "category",
          data: this.ydata1,
          axisLine: {
            show: true,
            lineStyle: {
              color: "#234691",
              width: 0,
              type: "solid",
            },
          },
          axisLabel: {
            show: true,
            interval: 0,
            rotate: 0,
            textStyle: {
              color: "#fff",
            },
          },
          axisTick: {
            alignWithLabel: true,
          },
        },

        yAxis: {
          axisLine: { show: false },
          axisTick: { show: false },
          splitLine: {
            show: true,
            lineStyle: {
              color: ["#234691"],
              type: "solid",
            },
          },
          axisLabel: {
            show: true,
            textStyle: {
              color: "#fff",
            },
          },
        },
//柱状图柱子颜色渐变处理
        color: [
          {
            type: "linear",
            x: 0,
            y: 0,
            x2: 0,
            y2: 1,
            colorStops: [
              { offset: 1, color: "rgba(238,118,37,0.4)" },
              { offset: 0, color: "rgb(238,118,37)" },
            ],
          },
          {
            type: "linear",
            x: 0,
            y: 0,
            x2: 0,
            y2: 1,
            colorStops: [
              { offset: 1, color: "rgba(241,178,28,0.4)" },
              { offset: 0, color: "rgb(241,178,28)" },
            ],
          },
          {
            type: "linear",
            x: 0,
            y: 0,
            x2: 0,
            y2: 1,
            colorStops: [
              { offset: 1, color: "rgba(14,223,157,0.4)" },
              { offset: 0, color: "rgb(14,223,157)" },
            ],
          },
          {
            type: "linear",
            x: 0,
            y: 0,
            x2: 0,
            y2: 1,
            colorStops: [
              { offset: 1, color: "rgba(19,130,233,0.4)" },
              { offset: 0, color: "rgb(19,130,233)" },
            ],
          },
          {
            type: "linear",
            x: 0,
            y: 0,
            x2: 0,
            y2: 1,
            colorStops: [
              { offset: 1, color: "rgba(6,184,235,0.4)" },
              { offset: 0, color: "rgb(6,184,235)" },
            ],
          },
        ],

        series: [
          {
            type: "bar",
            barGap: "0%",
            barWidth: "10%",
            name: "语文",
            data: this.adata1,
          },
          {
            type: "bar",
            barGap: "0%",
            barWidth: "10%",
            name: "数学",
            data: this.bdata1,
          },
          {
            type: "bar",
            barGap: "0%",
            barWidth: "10%",
            name: "英语",
            data: this.cdata1,
          },
          {
            type: "bar",
            barGap: "0%",
            barWidth: "10%",
            name: "科学",
            data: this.ddata1,
          },
          {
            type: "bar",
            barGap: "0%",
            barWidth: "10%",
            name: "化学",
            data: this.edata1,
          },
        ],
      });
    },
//图表切换功能
    changeOutColor7(val) {
      this.showChart = val;
      if (this.outColor7 == "") {
        this.outColor7 = "danger";
        this.inColor7 = "";
      }
    },

    changeinColor7(val) {
      this.showChart = val;
      if (this.inColor7 == "") {
        this.inColor7 = "danger";
        this.outColor7 = "";
      }
    },

  },
};
</script>
如果一个页面要引入多个图表,切记不要让图表ID重名,否则会不显示。
color里面单独设置了五个柱状图的颜色,如果不需要渐变处理则可以直接在series里面设置颜色,或者不设置使用echarts的默认颜色。
api封装代码:
import Vue from 'vue'
export default class {
  static charts (query) {
    return new Promise((resolve, reject) => {
      Vue.http.get('你的接口地址', query).then(res => {
        if (res && res.data.error) {
          reject(res.data)
        } else {
          resolve(res.data)
        }
      }).catch(res => {
        reject(res)
      })
    })
  }
}
注意本项目使用组件版本比较低。
echarts 4.5.0
element 2.13.0
vue 2.5.16