机器学习之MATLAB代码--CEEMDAN+EEMD+EMD+VMD+IMF重构络(十八)
压缩分量的EEMD代码
1、
%% EEMD(Ensemble Empirical Mode Decomposition)是最常见的一种EMD改进方法,
%% 它的优势主要是解决EMD方法中的模态混叠现象。
clc;
clear all;
close all;
%% 数据导入
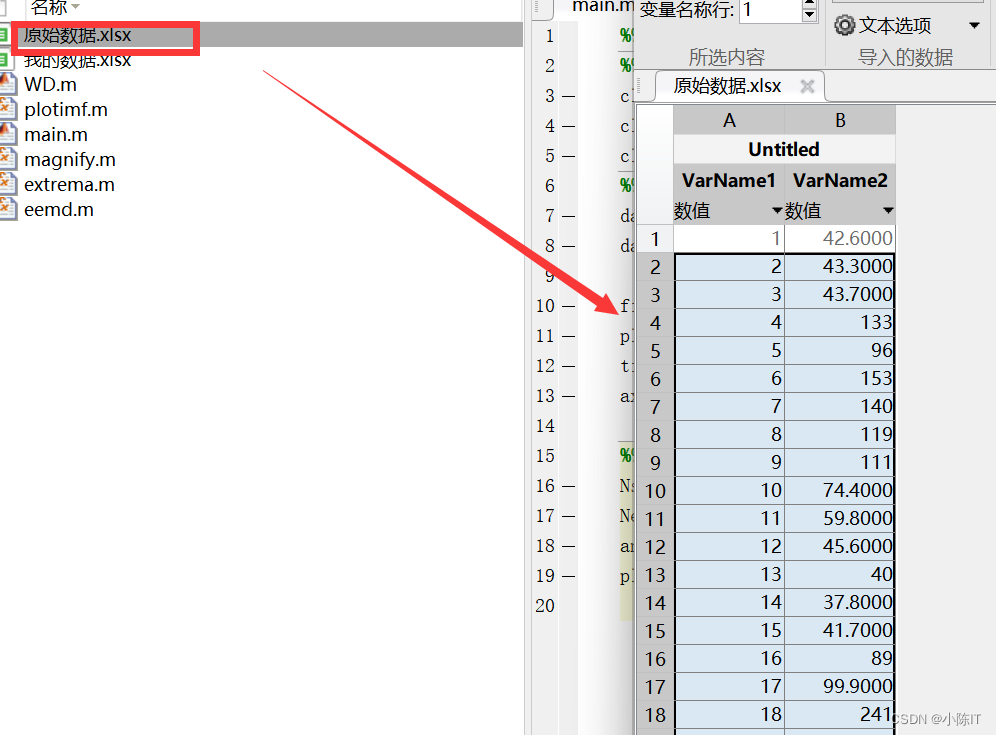
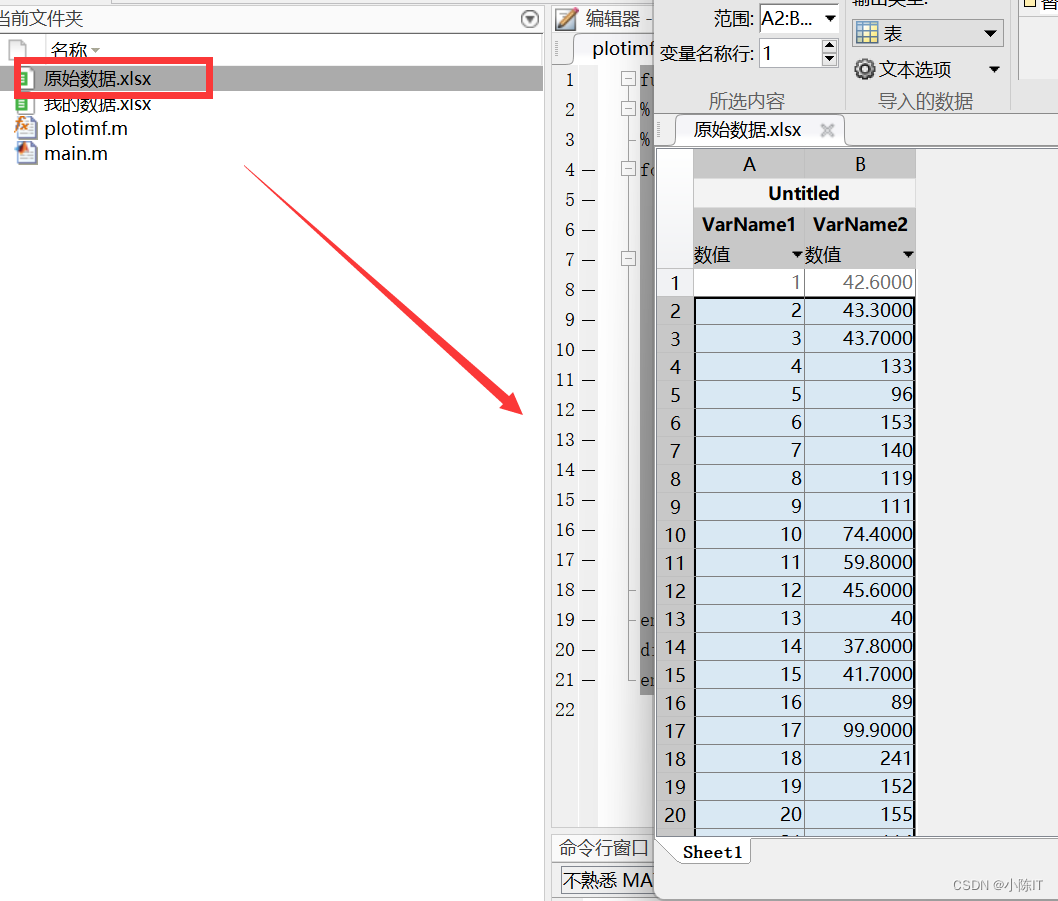
data__ = xlsread('原始数据.xlsx');
data = data__(:,2); %数据的第2列
figure;
plot(data,'b');
title('原始信号');
axis('tight');xlabel('采样点');ylabel('信号值');
%% 参数设置并分解
Nstd=0.1; %附加噪声标准差与Y标准差之比
Ne=100; %对信号的平均次数
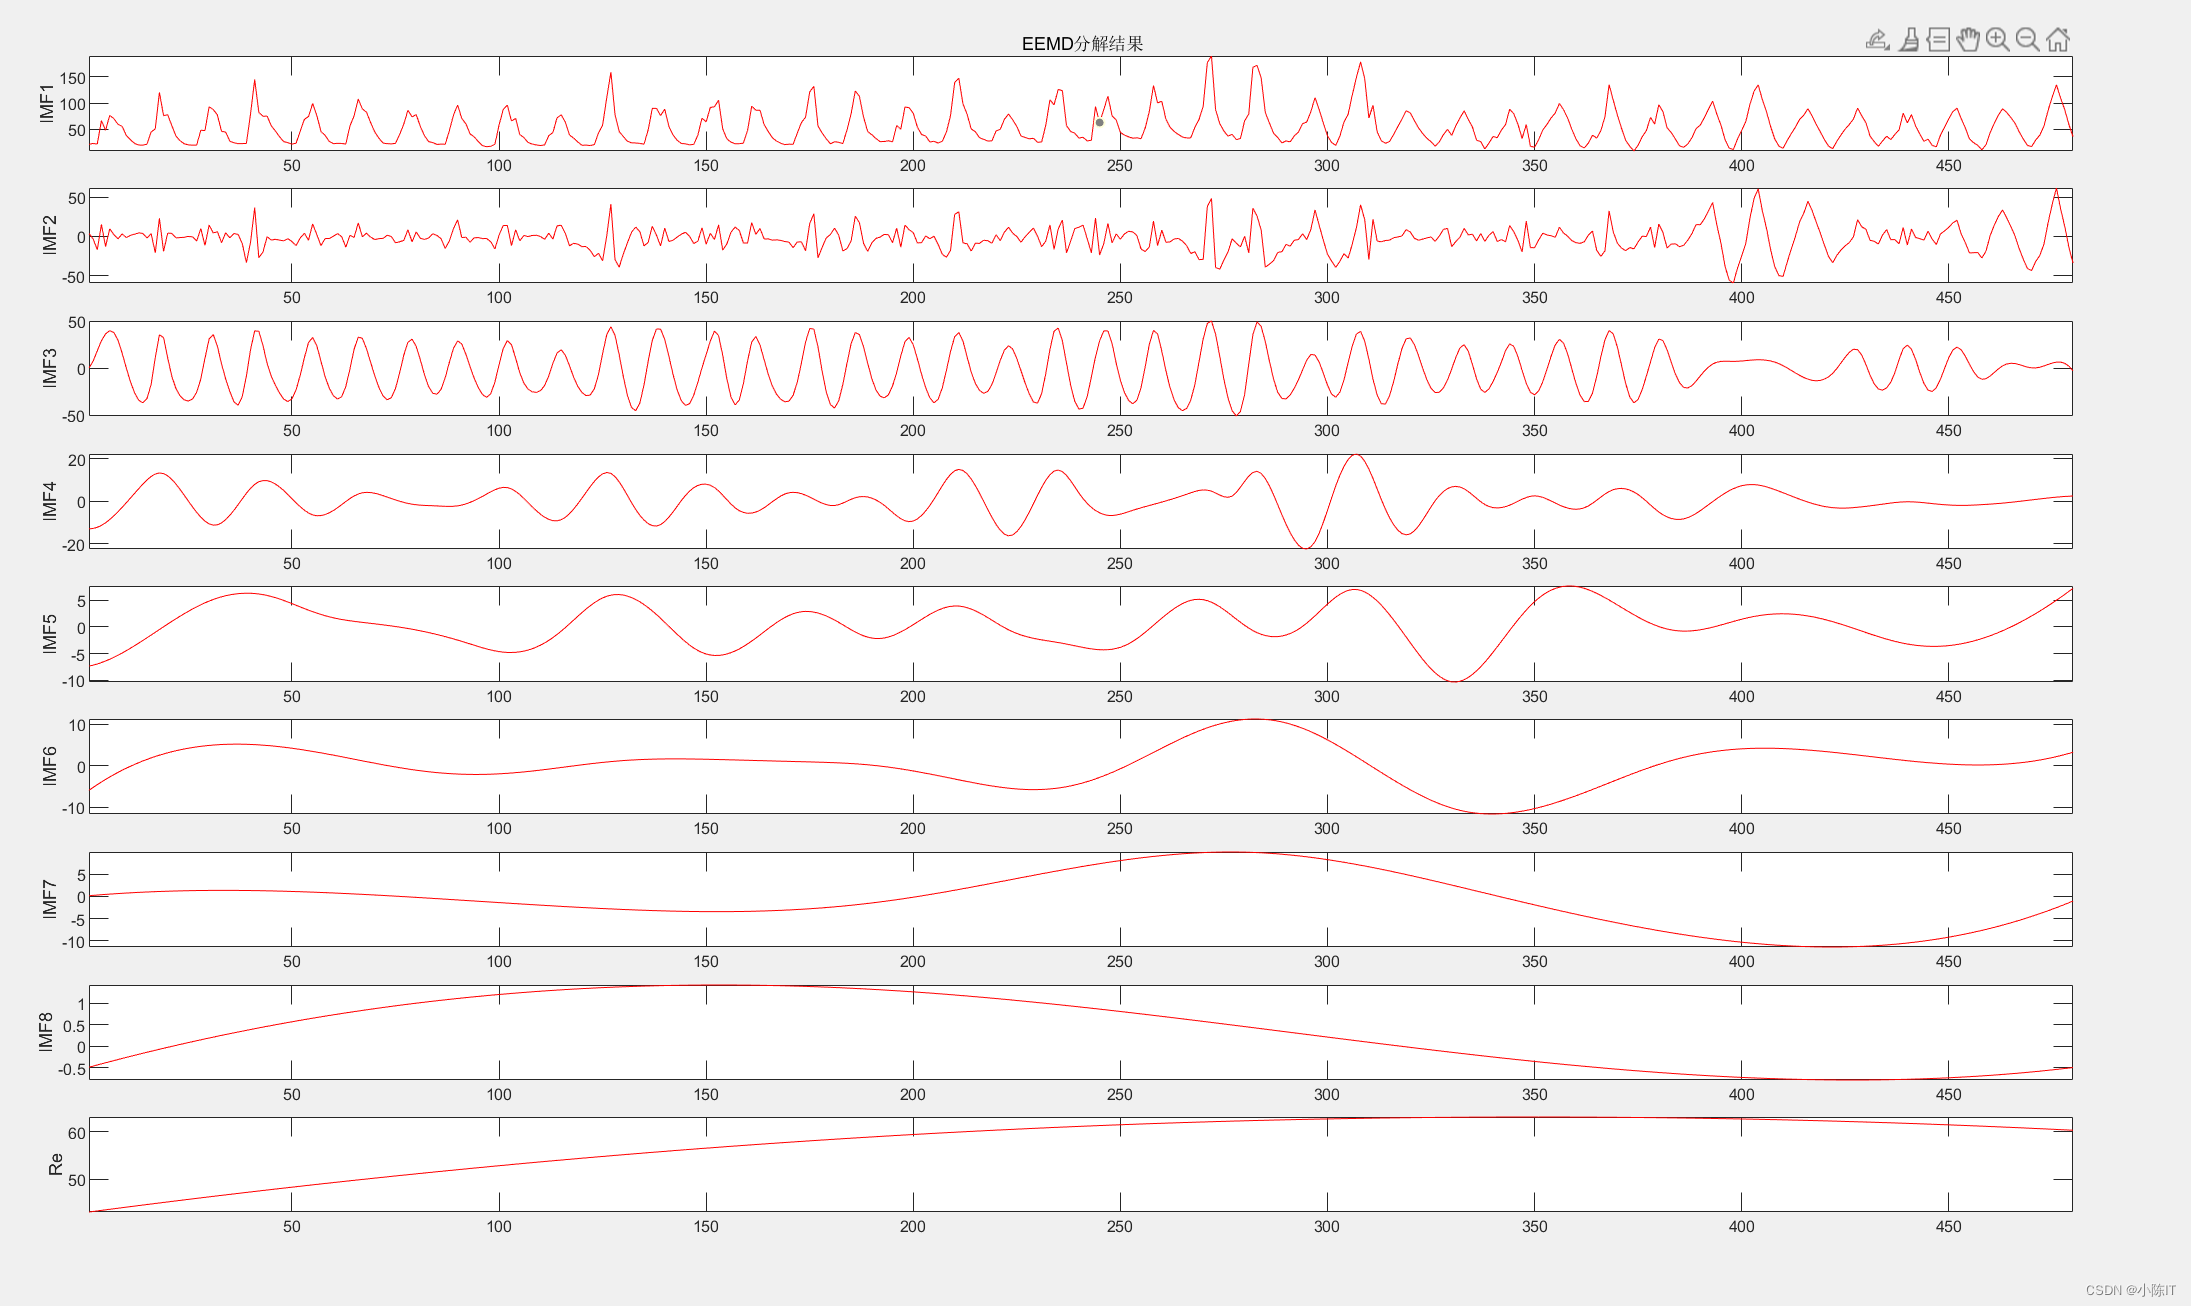
anmodes=eemd(data,0.1,100)'; %anmodes表示分解后的模态
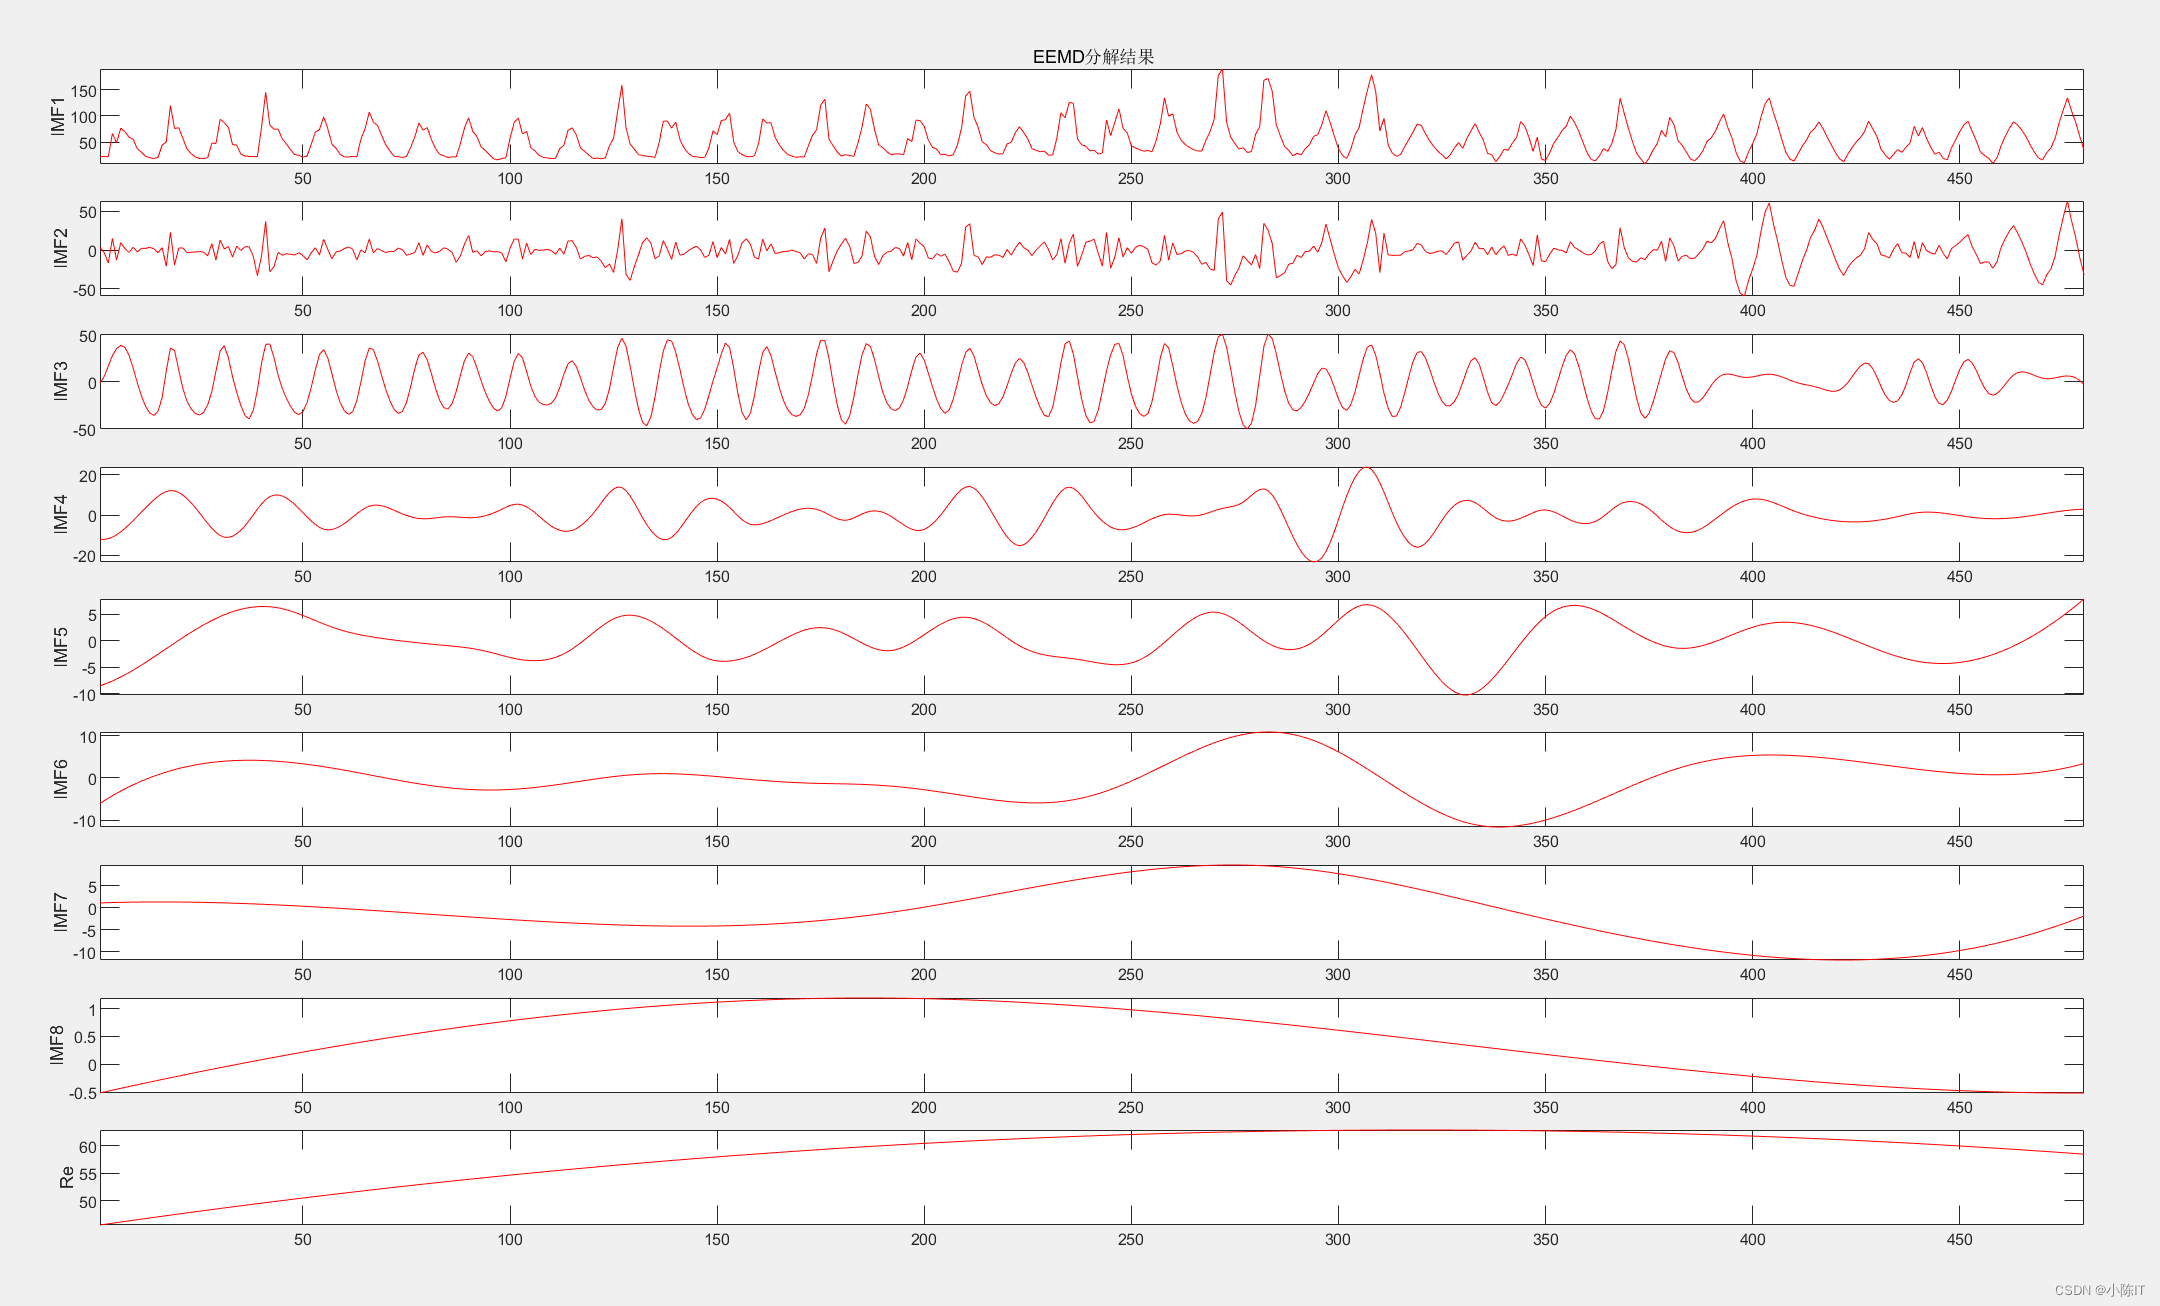
plotimf(anmodes,size(anmodes,1),'r',' EEMD分解结果'); %画图
2、
%% EEMD(Ensemble Empirical Mode Decomposition)是最常见的一种EMD改进方法,
%% 它的优势主要是解决EMD方法中的模态混叠现象。
clc;
clear all;
close all;
%% 数据导入
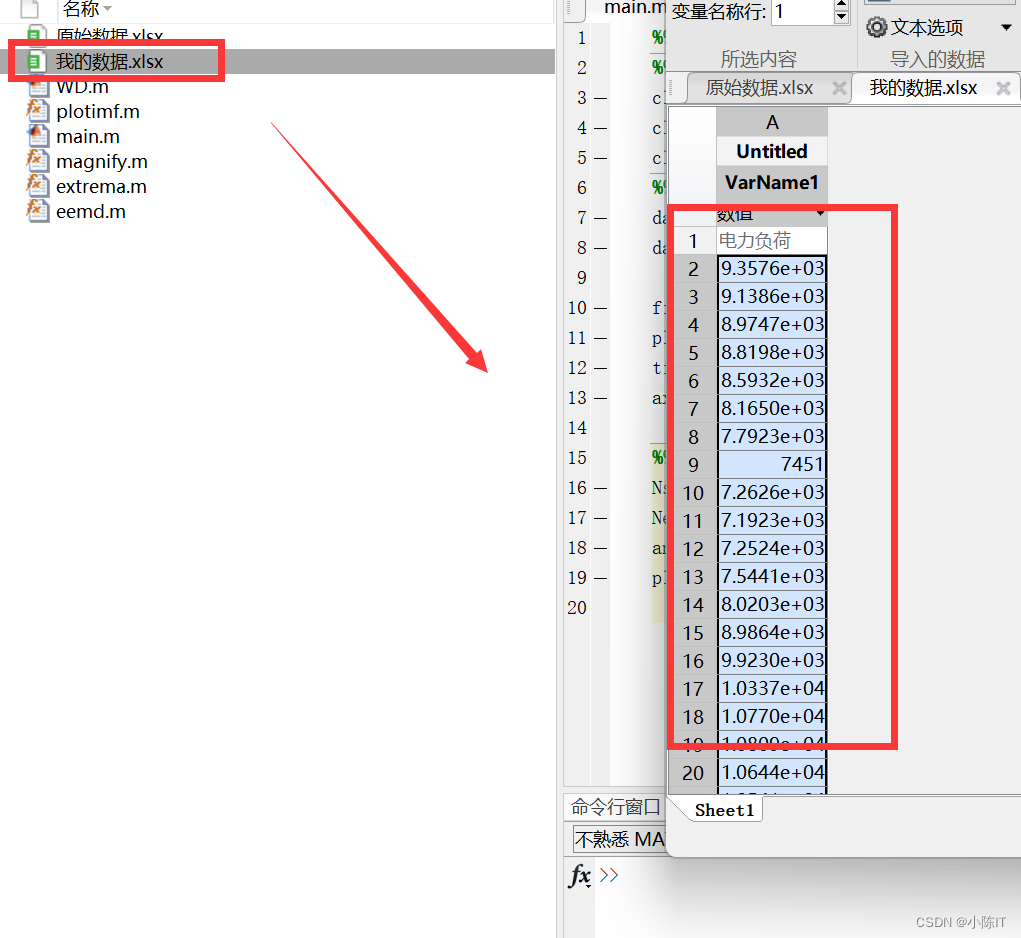
data = xlsread('我的数据.xlsx');
figure;
plot(data,'b');
title('原始信号');
axis('tight');xlabel('采样点');ylabel('信号值');
magnify
%% 参数设置并分解
Nstd=0.1; %附加噪声标准差与Y标准差之比
Ne=100; %对信号的平均次数
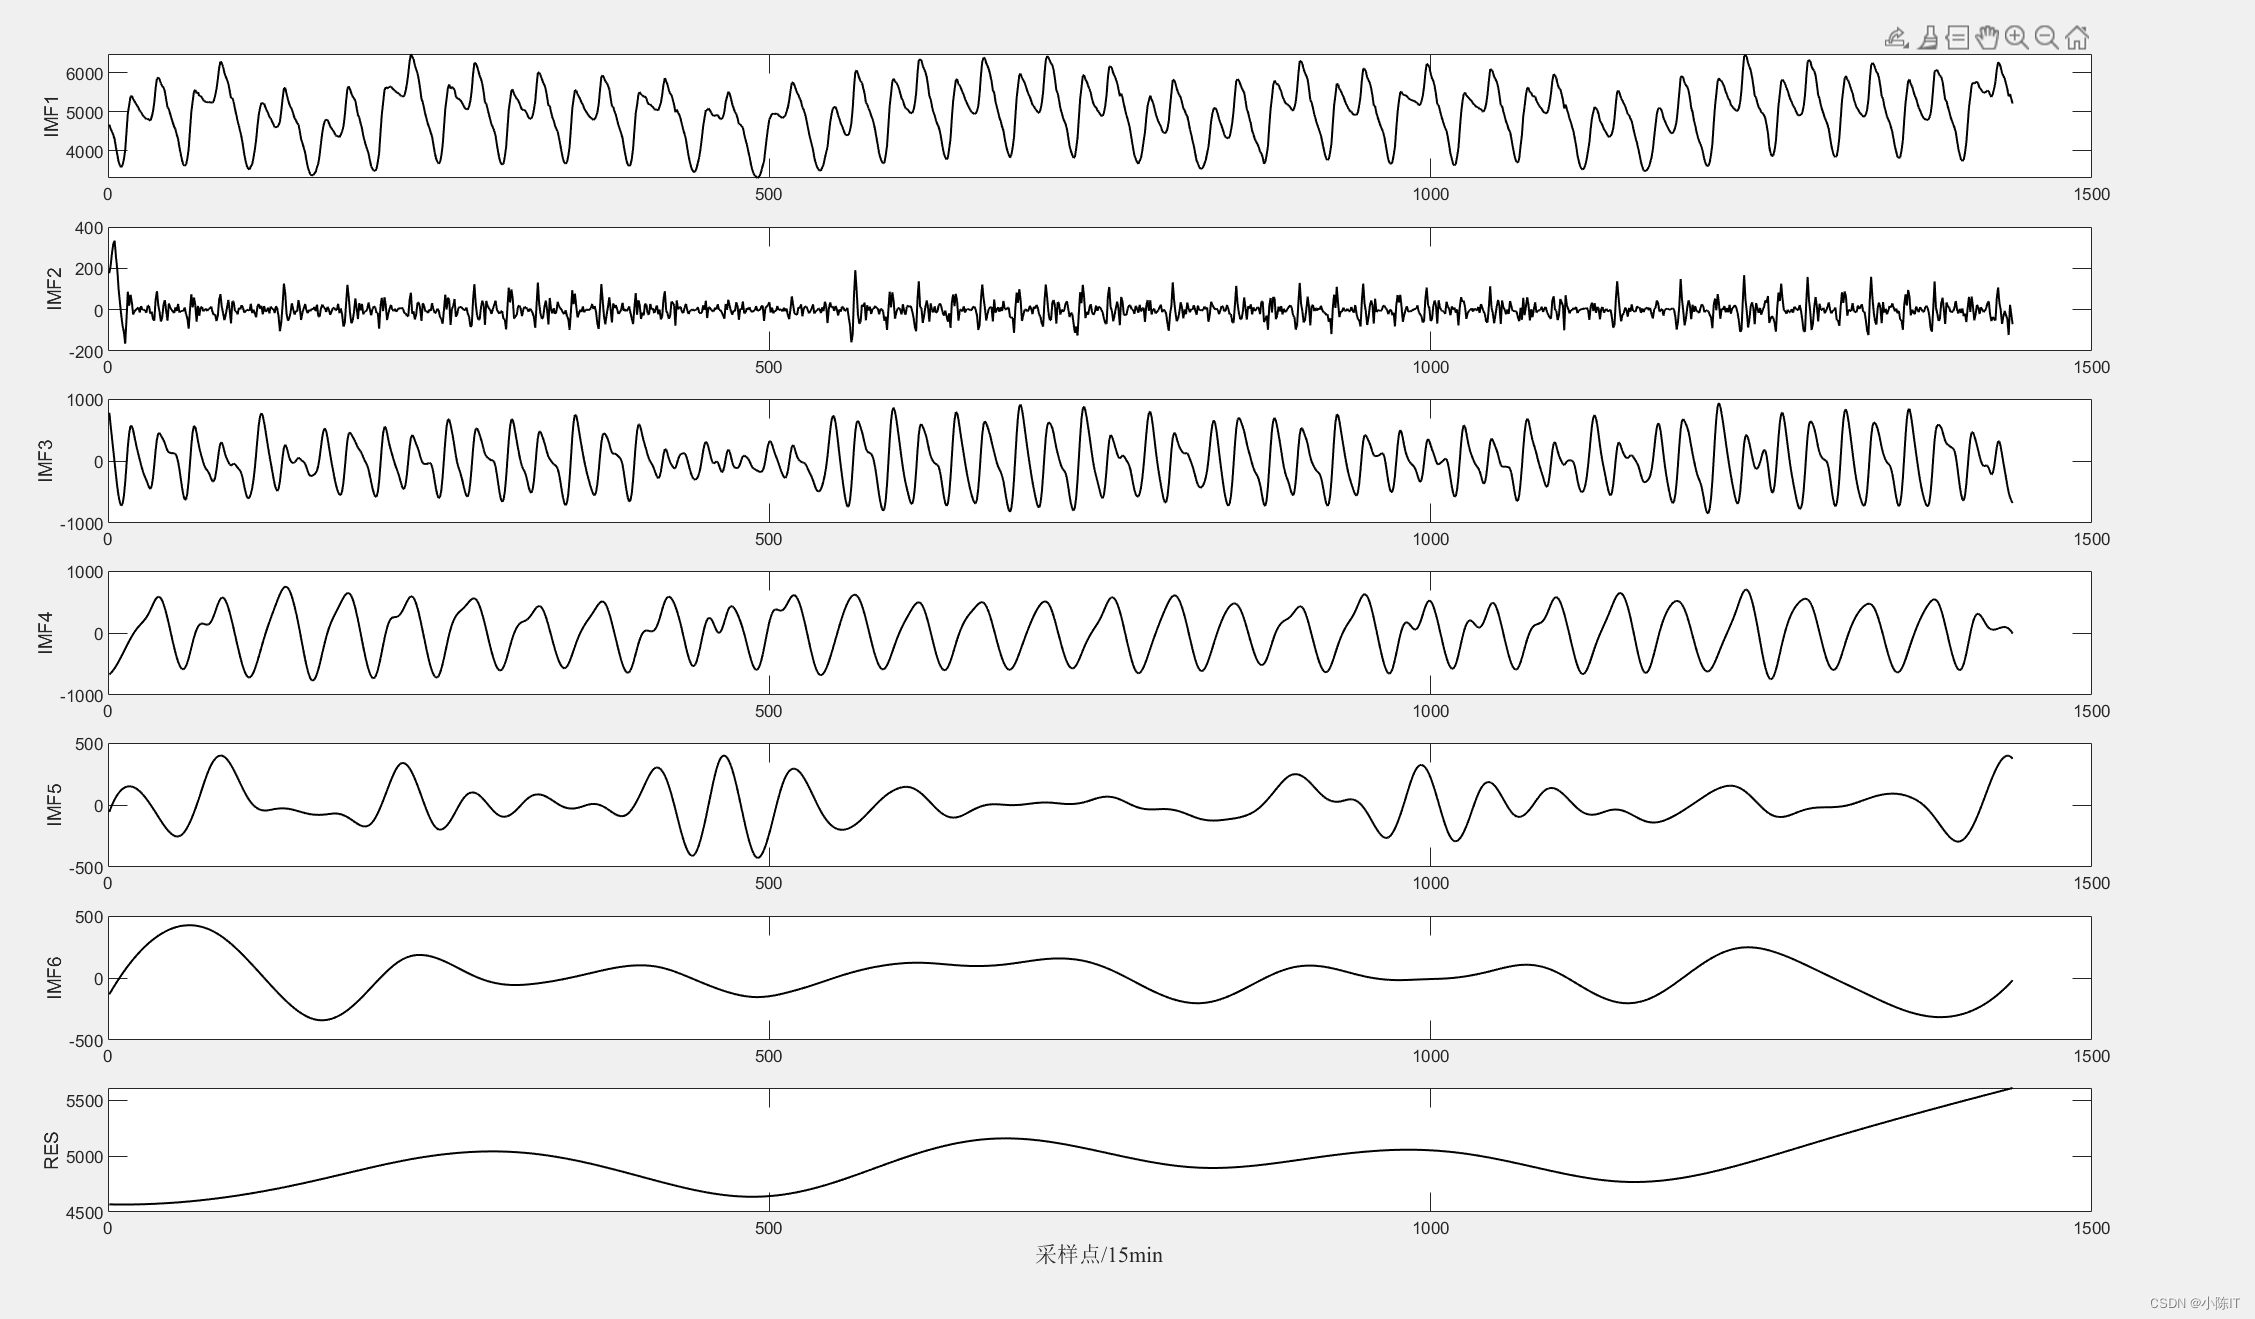
anmodes=eemd(data,0.1,100)'; %anmodes表示分解后的模态
% plotimf(anmodes,size(anmodes,1),'k',' EEMD分解结果'); %画图
for i=1:6 % 一共9个imf分量
subplot(6+1,1,i);
plot(anmodes(i,:),'LineWidth',1,'Color',[0 0 0]);
ylabel(['IMF' num2str(i)]);
end
subplot(6+1,1,6+1);
res=anmodes(7:end,:);
re=sum(res,1);
plot(re,'LineWidth',1,'Color',[0 0 0]);
xlabel(['\fontname{
宋体}采样点\fontname{
Times new roman}/15min'],'FontSize',11);
ylabel('RES');
3、
function [ ] = plotimf( IMF,num,color,name)
%   绘制imf
%   此处显示详细说明
for k_first=0:num:size(IMF,1)-1
    figure;
    clear k_second;
    for k_second=1:min(num,size(IMF,1)-k_first)
        subplot(num,1,k_second);
        plot(IMF(k_first+k_second,:),color);axis('tight');
        if(k_first==0 && k_second==1)
            title(name);
        end
       if k_first+k_second<size(IMF,1)
        ylabel(['IMF',num2str(k_first+k_second)]);
       else
        ylabel('Re');
        end
    end
end
disp(name)
end
4、
function magnify(f1)
%
%magnify(f1)
%
%  Figure creates a magnification box when under the mouse
%  position when a button is pressed.  Press '+'/'-' while
%  button pressed to increase/decrease magnification. Press
%  '>'/'<' while button pressed to increase/decrease box size.
%  Hold 'Ctrl' while clicking to leave magnification on figure.
%
%  Example:
%     plot(1:100,randn(1,100),(1:300)/3,rand(1,300)), grid on,
%     magnify;

% Rick Hindman - 7/29/04

if (nargin == 0), f1 = gcf; end;
set(f1, ...
   'WindowButtonDownFcn',  @ButtonDownCallback, ...
   'WindowButtonUpFcn', @ButtonUpCallback, ...
   'WindowButtonMotionFcn', @ButtonMotionCallback, ...
   'KeyPressFcn', @KeyPressCallback);
return;

function ButtonDownCallback(src,eventdata)
   f1 = src;
   a1 = get(f1,'CurrentAxes');
   a2 = copyobj(a1,f1);

   set(f1, ...
      'UserData',[f1,a1,a2], ...
      'Pointer','fullcrosshair', ...
      'CurrentAxes',a2);
   set(a2, ...
      'UserData',[2,0.2], ...  %magnification, frame size
      'Color',get(a1,'Color'), ...
      'Box','on');
   xlabel(''); ylabel(''); zlabel(''); title('');
   set(get(a2,'Children'), ...
      'LineWidth', 2);
   set(a1, ...
      'Color',get(a1,'Color')*0.95);
   set(f1, ...
      'CurrentAxes',a1);
   ButtonMotionCallback(src);
return;

function ButtonUpCallback(src,eventdata)
   H = get(src,'UserData');
   f1 = H(1); a1 = H(2); a2 = H(3);
   set(a1, ...
      'Color',get(a2,'Color'));
   set(f1, ...
      'UserData',[], ...
      'Pointer','arrow', ...
      'CurrentAxes',a1);
   if ~strcmp(get(f1,'SelectionType'),'alt'),
      delete(a2);
   end;
return;

function ButtonMotionCallback(src,eventdata)
   H = get(src,'UserData');
   if ~isempty(H)
      f1 = H(1); a1 = H(2); a2 = H(3);
      a2_param = get(a2,'UserData');
      f_pos = get(f1,'Position');
      a1_pos = get(a1,'Position');

      [f_cp, a1_cp] = pointer2d(f1,a1);

      set(a2,'Position',[(f_cp./f_pos(3:4)) 0 0]+a2_param(2)*a1_pos(3)*[-1 -1 2 2]);
      a2_pos = get(a2,'Position');

   	set(a2,'XLim',a1_cp(1)+(1/a2_param(1))*(a2_pos(3)/a1_pos(3))*diff(get(a1,'XLim'))*[-0.5 0.5]);
   	set(a2,'YLim',a1_cp(2)+(1/a2_param(1))*(a2_pos(4)/a1_pos(4))*diff(get(a1,'YLim'))*[-0.5 0.5]);
   end;
return;

function KeyPressCallback(src,eventdata)
   H = get(gcf,'UserData');
   if ~isempty(H)
      f1 = H(1); a1 = H(2); a2 = H(3);
      a2_param = get(a2,'UserData');
      if (strcmp(get(f1,'CurrentCharacter'),'+') | strcmp(get(f1,'CurrentCharacter'),'='))
         a2_param(1) = a2_param(1)*1.2;
      elseif (strcmp(get(f1,'CurrentCharacter'),'-') | strcmp(get(f1,'CurrentCharacter'),'_'))
         a2_param(1) = a2_param(1)/1.2;
      elseif (strcmp(get(f1,'CurrentCharacter'),'<') | strcmp(get(f1,'CurrentCharacter'),','))
         a2_param(2) = a2_param(2)/1.2;
      elseif (strcmp(get(f1,'CurrentCharacter'),'>') | strcmp(get(f1,'CurrentCharacter'),'.'))
         a2_param(2) = a2_param(2)*1.2;
      end;
      set(a2,'UserData',a2_param);
   	ButtonMotionCallback(src);
   end;
return;


% Included for completeness (usually in own file)
function [fig_pointer_pos, axes_pointer_val] = pointer2d(fig_hndl,axes_hndl)
%
%pointer2d(fig_hndl,axes_hndl)
%
%	Returns the coordinates of the pointer (in pixels)
%	in the desired figure (fig_hndl) and the coordinates
%       in the desired axis (axes coordinates)
%
% Example:
%  figure(1),
%  hold on,
%  for i = 1:1000,
%     [figp,axp]=pointer2d;
%     plot(axp(1),axp(2),'.','EraseMode','none');
%     drawnow;
%  end;
%  hold off

% Rick Hindman - 4/18/01

if (nargin == 0), fig_hndl = gcf; axes_hndl = gca; end;
if (nargin == 1), axes_hndl = get(fig_hndl,'CurrentAxes'); end;

set(fig_hndl,'Units','pixels');

pointer_pos = get(0,'PointerLocation');	%pixels {

    0,0} lower left
fig_pos = get(fig_hndl,'Position');	%pixels {

    l,b,w,h}

fig_pointer_pos = pointer_pos - fig_pos([1,2]);
set(fig_hndl,'CurrentPoint',fig_pointer_pos);

if (isempty(axes_hndl)),
	axes_pointer_val = [];
elseif (nargout == 2),
	axes_pointer_line = get(axes_hndl,'CurrentPoint');
	axes_pointer_val = sum(axes_pointer_line)/2;
end;
5、
% This is a utility program for significance test.
%
%   function [spmax, spmin, flag]= extrema(in_data)
%
% INPUT:
%       in_data: Inputted data, a time series to be sifted;
% OUTPUT:
%       spmax: The locations (col 1) of the maxima and its corresponding
%              values (col 2)
%       spmin: The locations (col 1) of the minima and its corresponding
%              values (col 2)
%
% References can be found in the "Reference" section.
%
% The code is prepared by Zhaohua Wu. For questions, please read the "Q&A" section or
% contact
%   zhwu@cola.iges.org
%
function [spmax, spmin, flag]= extrema(in_data)

flag=1;
dsize=length(in_data);

spmax(1,1) = 1;
spmax(1,2) = in_data(1);
jj=2;
kk=2;
while jj<dsize,
    if ( in_data(jj-1)<=in_data(jj) & in_data(jj)>=in_data(jj+1) )
        spmax(kk,1) = jj;
        spmax(kk,2) = in_data (jj);
        kk = kk+1;
    end
    jj=jj+1;
end
spmax(kk,1)=dsize;
spmax(kk,2)=in_data(dsize);

if kk>=4
    slope1=(spmax(2,2)-spmax(3,2))/(spmax(2,1)-spmax(3,1));
    tmp1=slope1*(spmax(1,1)-spmax(2,1))+spmax(2,2);
    if tmp1>spmax(1,2)
        spmax(1,2)=tmp1;
    end

    slope2=(spmax(kk-1,2)-spmax(kk-2,2))/(spmax(kk-1,1)-spmax(kk-2,1));
    tmp2=slope2*(spmax(kk,1)-spmax(kk-1,1))+spmax(kk-1,2);
    if tmp2>spmax(kk,2)
        spmax(kk,2)=tmp2;
    end
else
    flag=-1;
end


msize=size(in_data);
dsize=max(msize);
xsize=dsize/3;
xsize2=2*xsize;

spmin(1,1) = 1;
spmin(1,2) = in_data(1);
jj=2;
kk=2;
while jj<dsize,
    if ( in_data(jj-1)>=in_data(jj) & in_data(jj)<=in_data(jj+1))
        spmin(kk,1) = jj;
        spmin(kk,2) = in_data (jj);
        kk = kk+1;
    end
    jj=jj+1;
end
spmin(kk,1)=dsize;
spmin(kk,2)=in_data(dsize);

if kk>=4
    slope1=(spmin(2,2)-spmin(3,2))/(spmin(2,1)-spmin(3,1));
    tmp1=slope1*(spmin(1,1)-spmin(2,1))+spmin(2,2);
    if tmp1<spmin(1,2)
        spmin(1,2)=tmp1;
    end

    slope2=(spmin(kk-1,2)-spmin(kk-2,2))/(spmin(kk-1,1)-spmin(kk-2,1));
    tmp2=slope2*(spmin(kk,1)-spmin(kk-1,1))+spmin(kk-1,2);
    if tmp2<spmin(kk,2)
        spmin(kk,2)=tmp2;
    end
else
    flag=-1;
end

flag=1;
6、
% Y: Inputted data;
% Nstd: ratio of the standard deviation of the added noise and that of Y;
% NE: Ensemble member being used
% TNM: total number of modes (not including the trend)
%
function allmode=eemd_n(Y,Nstd,NE)
% find data length
xsize=length(Y);
dd=1:1:xsize;
% Nornaliz data
Ystd=std(Y);
Y=Y/Ystd;
% Initialize saved data
TNM=fix(log2(xsize))-1;
TNM2=TNM+2;
for kk=1:1:TNM2,
    for ii=1:1:xsize,
        allmode(ii,kk)=0.0;
    end
end

for iii=1:1:NE
% adding noise
    for i=1:xsize,
        temp=randn(1,1)*Nstd;
        X1(i)=Y(i)+temp;
    end

    % sifting X1
    xorigin = X1;
    xend = xorigin;
% save the initial data into the first column
    for jj=1:1:xsize
        mode(jj,1) = xorigin(jj);
    end
    nmode = 1;
    while nmode <= TNM,
         xstart = xend;
        iter = 1;
        while iter<=5,
             [spmax, spmin, flag]=extrema(xstart);
             upper= spline(spmax(:,1),spmax(:,2),dd);
             lower= spline(spmin(:,1),spmin(:,2),dd);
             mean_ul = (upper + lower)/2;
             xstart = xstart - mean_ul;
             iter = iter +1;
        end
        xend = xend - xstart;
        nmode=nmode+1;
        % save a mode
        for jj=1:1:xsize,
            mode(jj,nmode) = xstart(jj);
        end
    end
    % save the trend
    for jj=1:1:xsize,
        mode(jj,nmode+1)=xend(jj);
    end
    % add mode to the sum of modes from earlier ensemble members
    allmode=allmode+mode;

end
% ensemble average
allmode=allmode/NE/2;
% Rescale mode to origional unit.
allmode=allmode*Ystd;
压缩分量的EEMD数据
压缩分量的EEMD结果
CEEMDAN代码
代码顺序:
1、
clc;clear all;close all
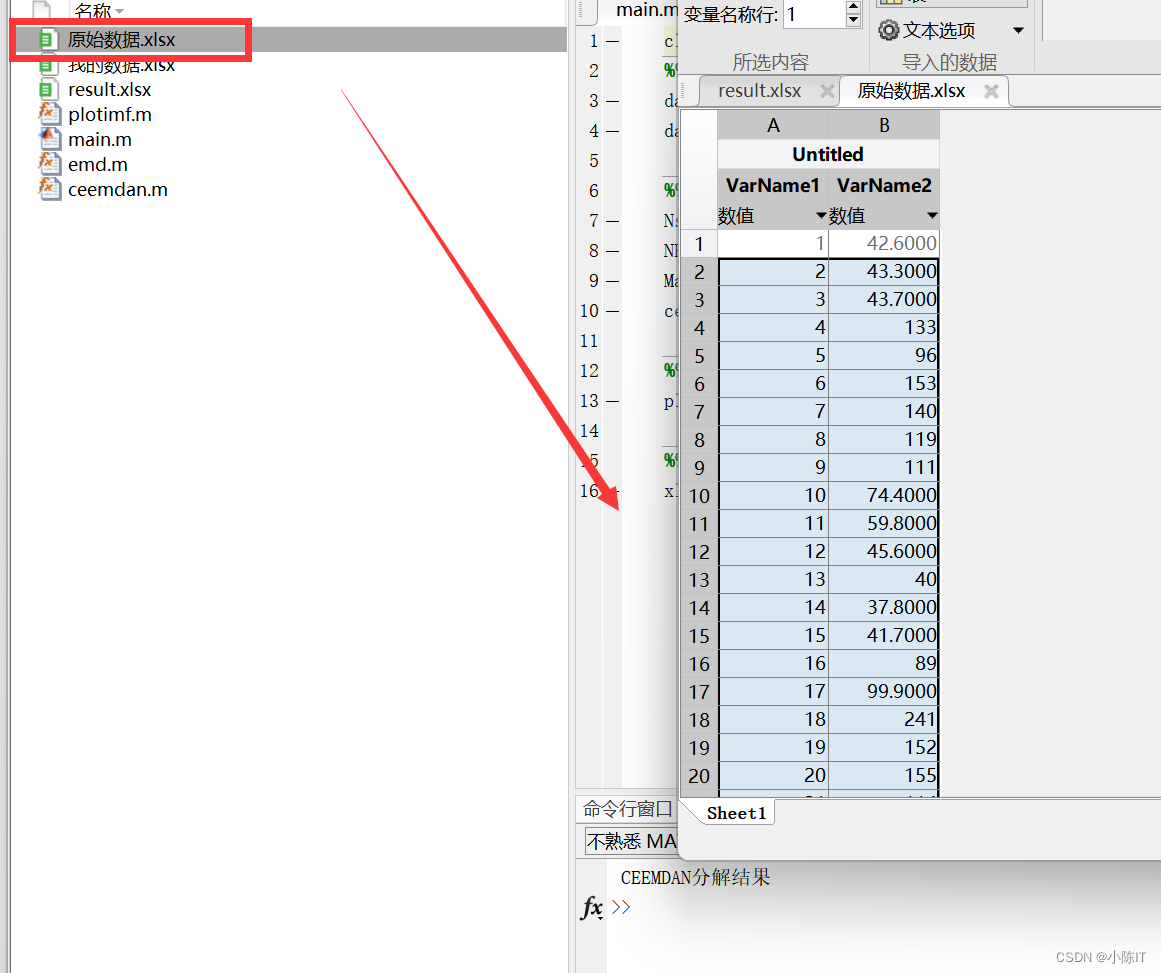
%% 数据导入
data__ = xlsread('原始数据.xlsx');
data = data__(:,2); %数据的第2列
%% 参数设置
Nstd=0.2; %信噪比,一般0-1
NR=100; %添加噪音次数,一般50-100
Maxlter=10; %内部最大包络次数设定,即分量个数
ceemdan_imf=ceemdan(data,0.2,100,10);
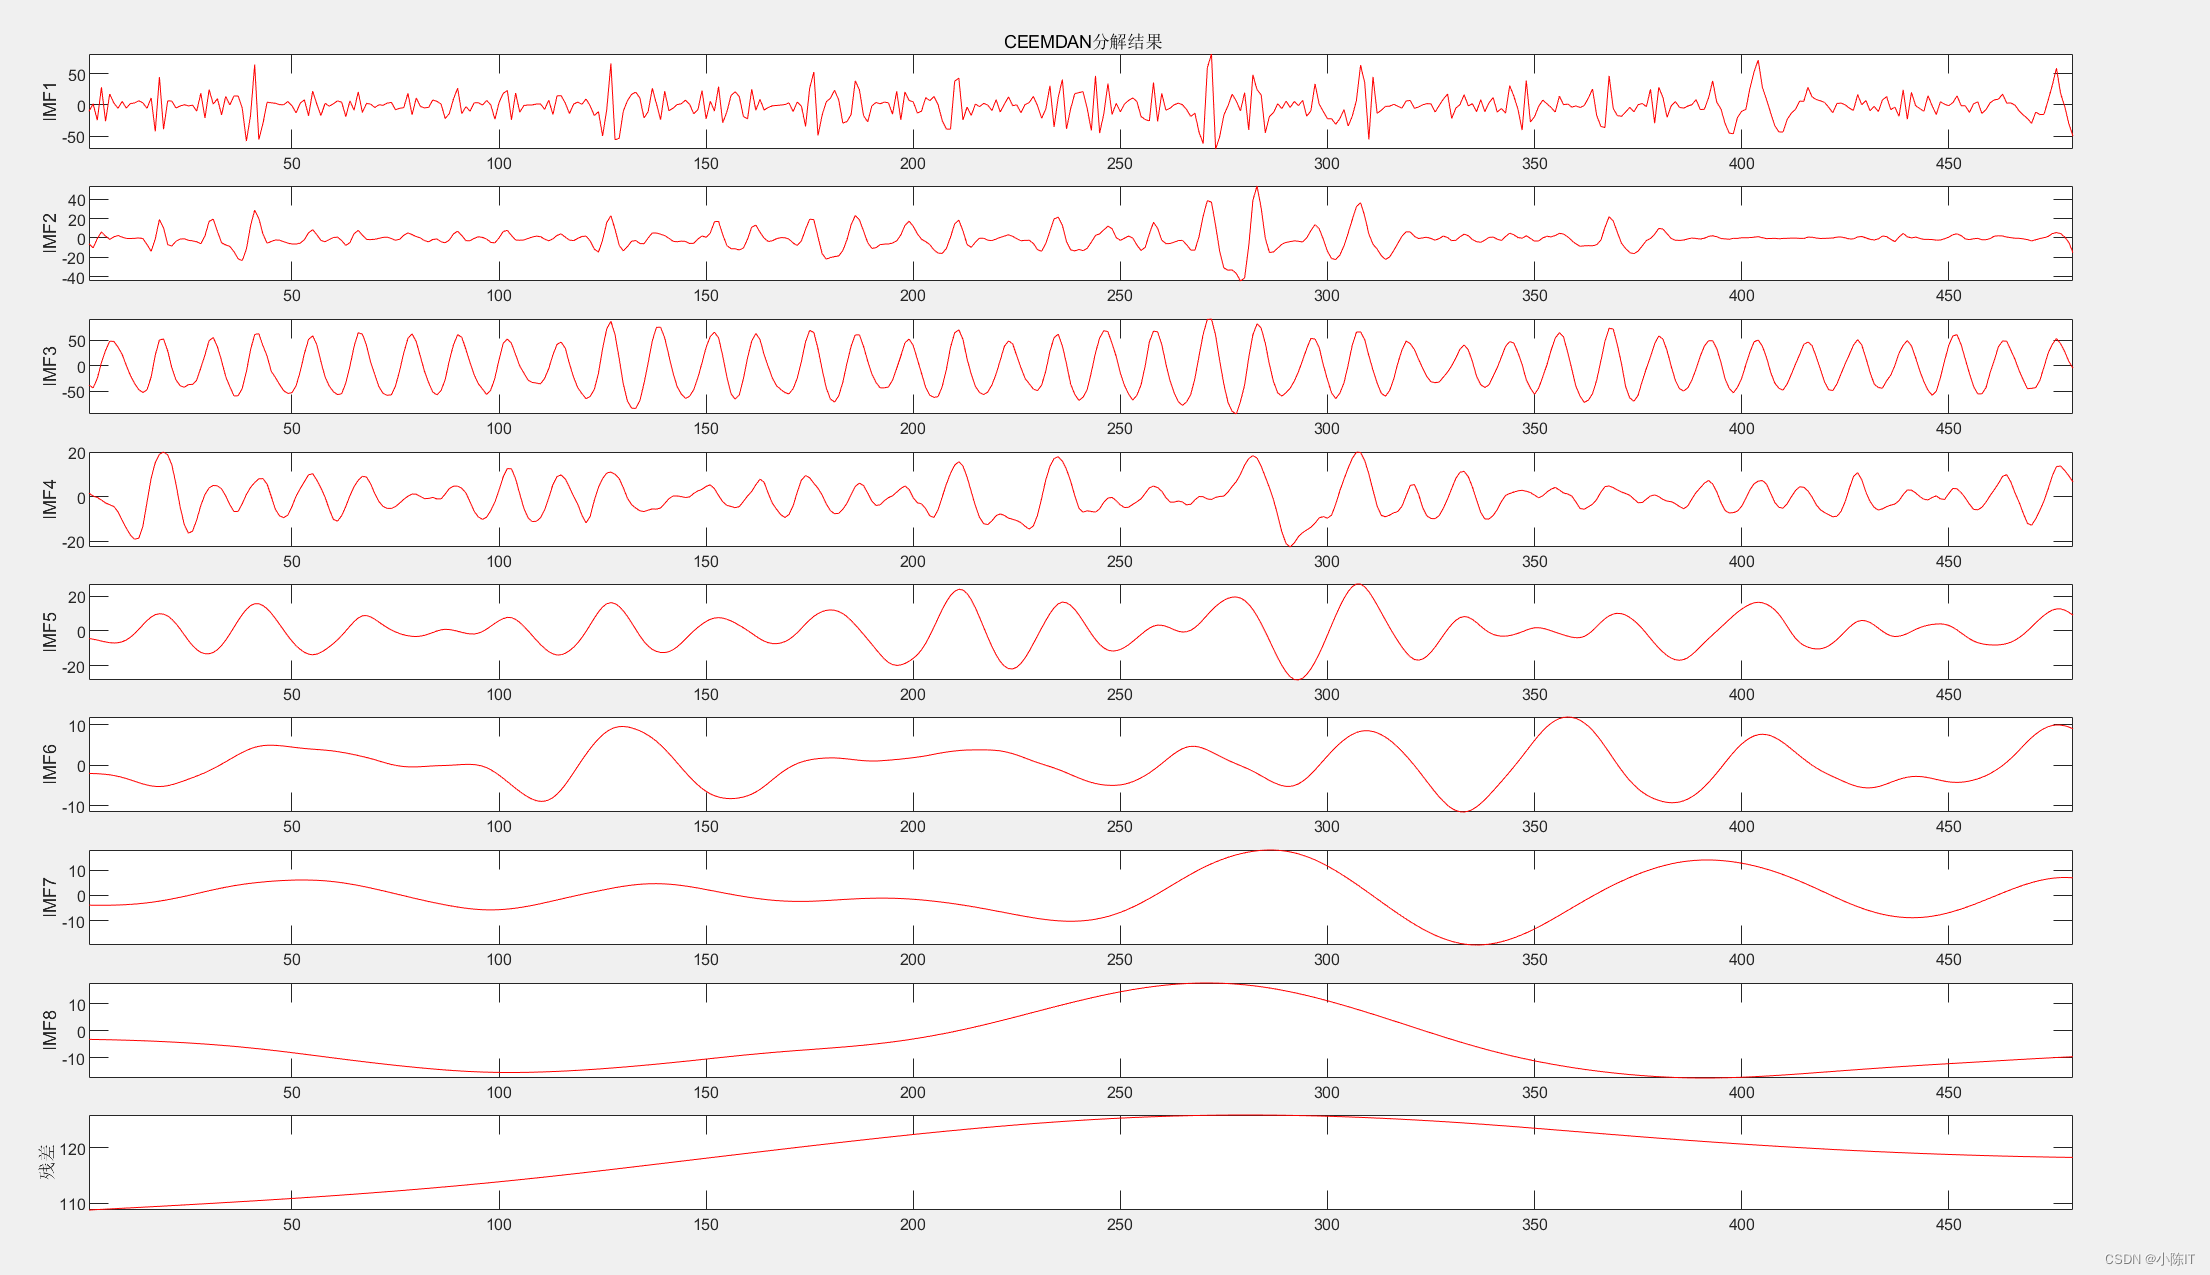
%% 图形绘制
plotimf(ceemdan_imf,size(ceemdan_imf,1),'r',' CEEMDAN分解结果'); %画图
%%
xlswrite('result.xlsx',ceemdan_imf);
2、
function [ ] = plotimf( IMF,num,color,name)
%   绘制imf
%   此处显示详细说明
for k_first=0:num:size(IMF,1)-1
    figure;
    clear k_second;
    for k_second=1:min(num,size(IMF,1)-k_first)
        subplot(num,1,k_second);
        plot(IMF(k_first+k_second,:),color);axis('tight');
        if(k_first==0 && k_second==1)
            title(name);
        end
       if k_first+k_second<size(IMF,1)
        ylabel(['IMF',num2str(k_first+k_second)]);
       else
        ylabel('残差');
        end
    end
end
disp(name)
end
3、
%EMD  computes Empirical Mode Decomposition
%
%
%   Syntax
%
%
% IMF = EMD(X)
% IMF = EMD(X,...,'Option_name',Option_value,...)
% IMF = EMD(X,OPTS)
% [IMF,ORT,NB_ITERATIONS] = EMD(...)
%
%
%   Description
%
%
% IMF = EMD(X) where X is a real vector computes the Empirical Mode
% Decomposition [1] of X, resulting in a matrix IMF containing 1 IMF per row, the
% last one being the residue. The default stopping criterion is the one proposed
% in [2]:
%
%   at each point, mean_amplitude < THRESHOLD2*envelope_amplitude
%   &
%   mean of boolean array {

    (mean_amplitude)/(envelope_amplitude) > THRESHOLD} < TOLERANCE
%   &
%   |#zeros-#extrema|<=1
%
% where mean_amplitude = abs(envelope_max+envelope_min)/2
% and envelope_amplitude = abs(envelope_max-envelope_min)/2
%
% IMF = EMD(X) where X is a complex vector computes Bivariate Empirical Mode
% Decomposition [3] of X, resulting in a matrix IMF containing 1 IMF per row, the
% last one being the residue. The default stopping criterion is similar to the
% one proposed in [2]:
%
%   at each point, mean_amplitude < THRESHOLD2*envelope_amplitude
%   &
%   mean of boolean array {

    (mean_amplitude)/(envelope_amplitude) > THRESHOLD} < TOLERANCE
%
% where mean_amplitude and envelope_amplitude have definitions similar to the
% real case
%
% IMF = EMD(X,...,'Option_name',Option_value,...) sets options Option_name to
% the specified Option_value (see Options)
%
% IMF = EMD(X,OPTS) is equivalent to the above syntax provided OPTS is a struct
% object with field names corresponding to option names and field values being the
% associated values
%
% [IMF,ORT,NB_ITERATIONS] = EMD(...) returns an index of orthogonality
%                       ________
%         _  |IMF(i,:).*IMF(j,:)|
%   ORT = \ _____________________
%         /
%         �        || X ||�
%        i~=j
%
% and the number of iterations to extract each mode in NB_ITERATIONS
%
%
%   Options
%
%
%  stopping criterion options:
%
% STOP: vector of stopping parameters [THRESHOLD,THRESHOLD2,TOLERANCE]
% if the input vector's length is less than 3, only the first parameters are
% set, the remaining ones taking default values.
% default: [0.05,0.5,0.05]
%
% FIX (int): disable the default stopping criterion and do exactly <FIX>
% number of sifting iterations for each mode
%
% FIX_H (int): disable the default stopping criterion and do <FIX_H> sifting
% iterations with |#zeros-#extrema|<=1 to stop [4]
%
%  bivariate/complex EMD options:
%
% COMPLEX_VERSION: selects the algorithm used for complex EMD ([3])
% COMPLEX_VERSION = 1: "algorithm 1"
% COMPLEX_VERSION = 2: "algorithm 2" (default)
%
% NDIRS: number of directions in which envelopes are computed (default 4)
% rem: the actual number of directions (according to [3]) is 2*NDIRS
%
%  other options:
%
% T: sampling times (line vector) (default: 1:length(x))
%
% MAXITERATIONS: maximum number of sifting iterations for the computation of each
% mode (default: 2000)
%
% MAXMODES: maximum number of imfs extracted (default: Inf)
%
% DISPLAY: if equals to 1 shows sifting steps with pause
% if equals to 2 shows sifting steps without pause (movie style)
% rem: display is disabled when the input is complex
%
% INTERP: interpolation scheme: 'linear', 'cubic', 'pchip' or 'spline' (default)
% see interp1 documentation for details
%
% MASK: masking signal used to improve the decomposition according to [5]
%
%
%   Examples
%
%
%X = rand(1,512);
%
%IMF = emd(X);
%
%IMF = emd(X,'STOP',[0.1,0.5,0.05],'MAXITERATIONS',100);
%
%T=linspace(0,20,1e3);
%X = 2*exp(i*T)+exp(3*i*T)+.5*T;
%IMF = emd(X,'T',T);
%
%OPTIONS.DISLPAY = 1;
%OPTIONS.FIX = 10;
%OPTIONS.MAXMODES = 3;
%[IMF,ORT,NBITS] = emd(X,OPTIONS);
%
%
%   References
%
%
% [1] N. E. Huang et al., "The empirical mode decomposition and the
% Hilbert spectrum for non-linear and non stationary time series analysis",
% Proc. Royal Soc. London A, Vol. 454, pp. 903-995, 1998
%
% [2] G. Rilling, P. Flandrin and P. Gon鏰lves
% "On Empirical Mode Decomposition and its algorithms",
% IEEE-EURASIP Workshop on Nonlinear Signal and Image Processing
% NSIP-03, Grado (I), June 2003
%
% [3] G. Rilling, P. Flandrin, P. Gon鏰lves and J. M. Lilly.,
% "Bivariate Empirical Mode Decomposition",
% Signal Processing Letters (submitted)
%
% [4] N. E. Huang et al., "A confidence limit for the Empirical Mode
% Decomposition and Hilbert spectral analysis",
% Proc. Royal Soc. London A, Vol. 459, pp. 2317-2345, 2003
%
% [5] R. Deering and J. F. Kaiser, "The use of a masking signal to improve
% empirical mode decomposition", ICASSP 2005
%
%
% See also
%  emd_visu (visualization),
%  emdc, emdc_fix (fast implementations of EMD),
%  cemdc, cemdc_fix, cemdc2, cemdc2_fix (fast implementations of bivariate EMD),
%  hhspectrum (Hilbert-Huang spectrum)
%
%
% G. Rilling, last modification: 3.2007
% gabriel.rilling@ens-lyon.fr


function [imf,ort,nbits] = emd(varargin)

[x,t,sd,sd2,tol,MODE_COMPLEX,ndirs,display_sifting,sdt,sd2t,r,imf,k,nbit,NbIt,MAXITERATIONS,FIXE,FIXE_H,MAXMODES,INTERP,mask] = init(varargin{

    :});

if display_sifting
  fig_h = figure;
end


%main loop : requires at least 3 extrema to proceed
while ~stop_EMD(r,MODE_COMPLEX,ndirs) && (k < MAXMODES+1 || MAXMODES == 0) && ~any(mask)

  % current mode
  m = r;

  % mode at previous iteration
  mp = m;

  %computation of mean and stopping criterion
  if FIXE
    [stop_sift,moyenne] = stop_sifting_fixe(t,m,INTERP,MODE_COMPLEX,ndirs);
  elseif FIXE_H
    stop_count = 0;
    [stop_sift,moyenne] = stop_sifting_fixe_h(t,m,INTERP,stop_count,FIXE_H,MODE_COMPLEX,ndirs);
  else
    [stop_sift,moyenne] = stop_sifting(m,t,sd,sd2,tol,INTERP,MODE_COMPLEX,ndirs);
  end

  % in case the current mode is so small that machine precision can cause
  % spurious extrema to appear
  if (max(abs(m))) < (1e-10)*(max(abs(x)))
    if ~stop_sift
      warning('emd:warning','forced stop of EMD : too small amplitude')
    else
      disp('forced stop of EMD : too small amplitude')
    end
    break
  end


  % sifting loop
  while ~stop_sift && nbit<MAXITERATIONS

    if(~MODE_COMPLEX && nbit>MAXITERATIONS/5 && mod(nbit,floor(MAXITERATIONS/10))==0 && ~FIXE && nbit > 100)
      disp(['mode ',int2str(k),', iteration ',int2str(nbit)])
      if exist('s','var')
        disp(['stop parameter mean value : ',num2str(s)])
      end
      [im,iM] = extr(m);
      disp([int2str(sum(m(im) > 0)),' minima > 0; ',int2str(sum(m(iM) < 0)),' maxima < 0.'])
    end

    %sifting
    m = m - moyenne;

    %computation of mean and stopping criterion
    if FIXE
      [stop_sift,moyenne] = stop_sifting_fixe(t,m,INTERP,MODE_COMPLEX,ndirs);
    elseif FIXE_H
      [stop_sift,moyenne,stop_count] = stop_sifting_fixe_h(t,m,INTERP,stop_count,FIXE_H,MODE_COMPLEX,ndirs);
    else
      [stop_sift,moyenne,s] = stop_sifting(m,t,sd,sd2,tol,INTERP,MODE_COMPLEX,ndirs);
    end

    % display
    if display_sifting && ~MODE_COMPLEX
      NBSYM = 2;
      [indmin,indmax] = extr(mp);
      [tmin,tmax,mmin,mmax] = boundary_conditions(indmin,indmax,t,mp,mp,NBSYM);
      envminp = interp1(tmin,mmin,t,INTERP);
      envmaxp = interp1(tmax,mmax,t,INTERP);
      envmoyp = (envminp+envmaxp)/2;
      if FIXE || FIXE_H
        display_emd_fixe(t,m,mp,r,envminp,envmaxp,envmoyp,nbit,k,display_sifting)
      else
        sxp=2*(abs(envmoyp))./(abs(envmaxp-envminp));
        sp = mean(sxp);
        display_emd(t,m,mp,r,envminp,envmaxp,envmoyp,s,sp,sxp,sdt,sd2t,nbit,k,display_sifting,stop_sift)
      end
    end

    mp = m;
    nbit=nbit+1;
    NbIt=NbIt+1;

    if(nbit==(MAXITERATIONS-1) && ~FIXE && nbit > 100)
      if exist('s','var')
        warning('emd:warning',['forced stop of sifting : too many iterations... mode ',int2str(k),'. stop parameter mean value : ',num2str(s)])
      else
        warning('emd:warning',['forced stop of sifting : too many iterations... mode ',int2str(k),'.'])
      end
    end

  end % sifting loop
  imf(k,:) = m;
  if display_sifting
    disp(['mode ',int2str(k),' stored'])
  end
  nbits(k) = nbit;
  k = k+1;


  r = r - m;
  nbit=0;


end %main loop

if any(r) && ~any(mask)
  imf(k,:) = r;
end

ort = io(x,imf);

if display_sifting
  close
end
end

%---------------------------------------------------------------------------------------------------
% tests if there are enough (3) extrema to continue the decomposition
function stop = stop_EMD(r,MODE_COMPLEX,ndirs)
if MODE_COMPLEX
  for k = 1:ndirs
    phi = (k-1)*pi/ndirs;
    [indmin,indmax] = extr(real(exp(i*phi)*r));
    ner(k) = length(indmin) + length(indmax);
  end
  stop = any(ner < 3);
else
  [indmin,indmax] = extr(r);
  ner = length(indmin) + length(indmax);
  stop = ner < 3;
end
end

%---------------------------------------------------------------------------------------------------
% computes the mean of the envelopes and the mode amplitude estimate
function [envmoy,nem,nzm,amp] = mean_and_amplitude(m,t,INTERP,MODE_COMPLEX,ndirs)
NBSYM = 2;
if MODE_COMPLEX
  switch MODE_COMPLEX
    case 1
      for k = 1:ndirs
        phi = (k-1)*pi/ndirs;
        y = real(exp(-i*phi)*m);
        [indmin,indmax,indzer] = extr(y);
        nem(k) = length(indmin)+length(indmax);
        nzm(k) = length(indzer);
        [tmin,tmax,zmin,zmax] = boundary_conditions(indmin,indmax,t,y,m,NBSYM);
        envmin(k,:) = interp1(tmin,zmin,t,INTERP);
        envmax(k,:) = interp1(tmax,zmax,t,INTERP);
      end
      envmoy = mean((envmin+envmax)/2,1);
      if nargout > 3
        amp = mean(abs(envmax-envmin),1)/2;
      end
    case 2
      for k = 1:ndirs
        phi = (k-1)*pi/ndirs;
        y = real(exp(-i*phi)*m);
        [indmin,indmax,indzer] = extr(y);
        nem(k) = length(indmin)+length(indmax);
        nzm(k) = length(indzer);
        [tmin,tmax,zmin,zmax] = boundary_conditions(indmin,indmax,t,y,y,NBSYM);
        envmin(k,:) = exp(i*phi)*interp1(tmin,zmin,t,INTERP);
        envmax(k,:) = exp(i*phi)*interp1(tmax,zmax,t,INTERP);
      end
      envmoy = mean((envmin+envmax),1);
      if nargout > 3
        amp = mean(abs(envmax-envmin),1)/2;
      end
  end
else
  [indmin,indmax,indzer] = extr(m);
  nem = length(indmin)+length(indmax);
  nzm = length(indzer);
  [tmin,tmax,mmin,mmax] = boundary_conditions(indmin,indmax,t,m,m,NBSYM);
  envmin = interp1(tmin,mmin,t,INTERP);
  envmax = interp1(tmax,mmax,t,INTERP);
  envmoy = (envmin+envmax)/2;
  if nargout > 3
    amp = mean(abs(envmax-envmin),1)/2;
  end
end
end

%-------------------------------------------------------------------------------
% default stopping criterion
function [stop,envmoy,s] = stop_sifting(m,t,sd,sd2,tol,INTERP,MODE_COMPLEX,ndirs)
try
  [envmoy,nem,nzm,amp] = mean_and_amplitude(m,t,INTERP,MODE_COMPLEX,ndirs);
  sx = abs(envmoy)./amp;
  s = mean(sx);
  stop = ~((mean(sx > sd) > tol | any(sx > sd2)) & (all(nem > 2)));
  if ~MODE_COMPLEX
    stop = stop && ~(abs(nzm-nem)>1);
  end
catch
  stop = 1;
  envmoy = zeros(1,length(m));
  s = NaN;
end
end

%-------------------------------------------------------------------------------
% stopping criterion corresponding to option FIX
function [stop,moyenne]= stop_sifting_fixe(t,m,INTERP,MODE_COMPLEX,ndirs)
try
  moyenne = mean_and_amplitude(m,t,INTERP,MODE_COMPLEX,ndirs);
  stop = 0;
catch
  moyenne = zeros(1,length(m));
  stop = 1;
end
end

%-------------------------------------------------------------------------------
% stopping criterion corresponding to option FIX_H
function [stop,moyenne,stop_count]= stop_sifting_fixe_h(t,m,INTERP,stop_count,FIXE_H,MODE_COMPLEX,ndirs)
try
  [moyenne,nem,nzm] = mean_and_amplitude(m,t,INTERP,MODE_COMPLEX,ndirs);
  if (all(abs(nzm-nem)>1))
    stop = 0;
    stop_count = 0;
  else
    stop_count = stop_count+1;
    stop = (stop_count == FIXE_H);
  end
catch
  moyenne = zeros(1,length(m));
  stop = 1;
end
end

%-------------------------------------------------------------------------------
% displays the progression of the decomposition with the default stopping criterion
function display_emd(t,m,mp,r,envmin,envmax,envmoy,s,sb,sx,sdt,sd2t,nbit,k,display_sifting,stop_sift)
subplot(4,1,1)
plot(t,mp);hold on;
plot(t,envmax,'--k');plot(t,envmin,'--k');plot(t,envmoy,'r');
title(['IMF ',int2str(k),';   iteration ',int2str(nbit),' before sifting']);
set(gca,'XTick',[])
hold  off
subplot(4,1,2)
plot(t,sx)
hold on
plot(t,sdt,'--r')
plot(t,sd2t,':k')
title('stop parameter')
set(gca,'XTick',[])
hold off
subplot(4,1,3)
plot(t,m)
title(['IMF ',int2str(k),';   iteration ',int2str(nbit),' after sifting']);
set(gca,'XTick',[])
subplot(4,1,4);
plot(t,r-m)
title('residue');
disp(['stop parameter mean value : ',num2str(sb),' before sifting and ',num2str(s),' after'])
if stop_sift
  disp('last iteration for this mode')
end
if display_sifting == 2
  pause(0.01)
else
  pause
end
end

%---------------------------------------------------------------------------------------------------
% displays the progression of the decomposition with the FIX and FIX_H stopping criteria
function display_emd_fixe(t,m,mp,r,envmin,envmax,envmoy,nbit,k,display_sifting)
subplot(3,1,1)
plot(t,mp);hold on;
plot(t,envmax,'--k');plot(t,envmin,'--k');plot(t,envmoy,'r');
title(['IMF ',int2str(k),';   iteration ',int2str(nbit),' before sifting']);
set(gca,'XTick',[])
hold  off
subplot(3,1,2)
plot(t,m)
title(['IMF ',int2str(k),';   iteration ',int2str(nbit),' after sifting']);
set(gca,'XTick',[])
subplot(3,1,3);
plot(t,r-m)
title('residue');
if display_sifting == 2
  pause(0.01)
else
  pause
end
end

%---------------------------------------------------------------------------------------
% defines new extrema points to extend the interpolations at the edges of the
% signal (mainly mirror symmetry)
function [tmin,tmax,zmin,zmax] = boundary_conditions(indmin,indmax,t,x,z,nbsym)

	lx = length(x);

	if (length(indmin) + length(indmax) < 3)
		error('not enough extrema')
	end

    % boundary conditions for interpolations :

	if indmax(1) < indmin(1)
    	if x(1) > x(indmin(1))
			lmax = fliplr(indmax(2:min(end,nbsym+1)));
			lmin = fliplr(indmin(1:min(end,nbsym)));
			lsym = indmax(1);
		else
			lmax = fliplr(indmax(1:min(end,nbsym)));
			lmin = [fliplr(indmin(1:min(end,nbsym-1))),1];
			lsym = 1;
		end
	else

		if x(1) < x(indmax(1))
			lmax = fliplr(indmax(1:min(end,nbsym)));
			lmin = fliplr(indmin(2:min(end,nbsym+1)));
			lsym = indmin(1);
		else
			lmax = [fliplr(indmax(1:min(end,nbsym-1))),1];
			lmin = fliplr(indmin(1:min(end,nbsym)));
			lsym = 1;
		end
	end

	if indmax(end) < indmin(end)
		if x(end) < x(indmax(end))
			rmax = fliplr(indmax(max(end-nbsym+1,1):end));
			rmin = fliplr(indmin(max(end-nbsym,1):end-1));
			rsym = indmin(end);
		else
			rmax = [lx,fliplr(indmax(max(end-nbsym+2,1):end))];
			rmin = fliplr(indmin(max(end-nbsym+1,1):end));
			rsym = lx;
		end
	else
		if x(end) > x(indmin(end))
			rmax = fliplr(indmax(max(end-nbsym,1):end-1));
			rmin = fliplr(indmin(max(end-nbsym+1,1):end));
			rsym = indmax(end);
		else
			rmax = fliplr(indmax(max(end-nbsym+1,1):end));
			rmin = [lx,fliplr(indmin(max(end-nbsym+2,1):end))];
			rsym = lx;
		end
	end

	tlmin = 2*t(lsym)-t(lmin);
	tlmax = 2*t(lsym)-t(lmax);
	trmin = 2*t(rsym)-t(rmin);
	trmax = 2*t(rsym)-t(rmax);

	% in case symmetrized parts do not extend enough
	if tlmin(1) > t(1) || tlmax(1) > t(1)
		if lsym == indmax(1)
			lmax = fliplr(indmax(1:min(end,nbsym)));
		else
			lmin = fliplr(indmin(1:min(end,nbsym)));
		end
		if lsym == 1
			error('bug')
		end
		lsym = 1;
		tlmin = 2*t(lsym)-t(lmin);
		tlmax = 2*t(lsym)-t(lmax);
	end

	if trmin(end) < t(lx) || trmax(end) < t(lx)
		if rsym == indmax(end)
			rmax = fliplr(indmax(max(end-nbsym+1,1):end));
		else
			rmin = fliplr(indmin(max(end-nbsym+1,1):end));
		end
	if rsym == lx
		error('bug')
	end
		rsym = lx;
		trmin = 2*t(rsym)-t(rmin);
		trmax = 2*t(rsym)-t(rmax);
	end

	zlmax =z(lmax);
	zlmin =z(lmin);
	zrmax =z(rmax);
	zrmin =z(rmin);

	tmin = [tlmin t(indmin) trmin];
	tmax = [tlmax t(indmax) trmax];
	zmin = [zlmin z(indmin) zrmin];
	zmax = [zlmax z(indmax) zrmax];
end

%---------------------------------------------------------------------------------------------------
%extracts the indices of extrema
function [indmin, indmax, indzer] = extr(x,t)

if(nargin==1)
  t=1:length(x);
end

m = length(x);

if nargout > 2
  x1=x(1:m-1);
  x2=x(2:m);
  indzer = find(x1.*x2<0);

  if any(x == 0)
    iz = find( x==0 );
    indz = [];
    if any(diff(iz)==1)
      zer = x == 0;
      dz = diff([0 zer 0]);
      debz = find(dz == 1);
      finz = find(dz == -1)-1;
      indz = round((debz+finz)/2);
    else
      indz = iz;
    end
    indzer = sort([indzer indz]);
  end
end

d = diff(x);

n = length(d);
d1 = d(1:n-1);
d2 = d(2:n);
indmin = find(d1.*d2<0 & d1<0)+1;
indmax = find(d1.*d2<0 & d1>0)+1;


% when two or more successive points have the same value we consider only one extremum in the middle of the constant area
% (only works if the signal is uniformly sampled)

if any(d==0)

  imax = [];
  imin = [];

  bad = (d==0);
  dd = diff([0 bad 0]);
  debs = find(dd == 1);
  fins = find(dd == -1);
  if debs(1) == 1
    if length(debs) > 1
      debs = debs(2:end);
      fins = fins(2:end);
    else
      debs = [];
      fins = [];
    end
  end
  if length(debs) > 0
    if fins(end) == m
      if length(debs) > 1
        debs = debs(1:(end-1));
        fins = fins(1:(end-1));

      else
        debs = [];
        fins = [];
      end
    end
  end
  lc = length(debs);
  if lc > 0
    for k = 1:lc
      if d(debs(k)-1) > 0
        if d(fins(k)) < 0
          imax = [imax round((fins(k)+debs(k))/2)];
        end
      else
        if d(fins(k)) > 0
          imin = [imin round((fins(k)+debs(k))/2)];
        end
      end
    end
  end

  if length(imax) > 0
    indmax = sort([indmax imax]);
  end

  if length(imin) > 0
    indmin = sort([indmin imin]);
  end

end
end

%---------------------------------------------------------------------------------------------------

function ort = io(x,imf)
% ort = IO(x,imf) computes the index of orthogonality
%
% inputs : - x    : analyzed signal
%          - imf  : empirical mode decomposition

n = size(imf,1);

s = 0;

for i = 1:n
  for j =1:n
    if i~=j
      s = s + abs(sum(imf(i,:).*conj(imf(j,:)))/sum(x.^2));
    end
  end
end

ort = 0.5*s;
end
%---------------------------------------------------------------------------------------------------

function [x,t,sd,sd2,tol,MODE_COMPLEX,ndirs,display_sifting,sdt,sd2t,r,imf,k,nbit,NbIt,MAXITERATIONS,FIXE,FIXE_H,MAXMODES,INTERP,mask] = init(varargin)

x = varargin{

    1};
if nargin == 2
  if isstruct(varargin{

    2})
    inopts = varargin{

    2};
  else
    error('when using 2 arguments the first one is the analyzed signal X and the second one is a struct object describing the options')
  end
elseif nargin > 2
  try
    inopts = struct(varargin{

    2:end});
  catch
    error('bad argument syntax')
  end
end

% default for stopping
defstop = [0.05,0.5,0.05];

opt_fields = {

    't','stop','display','maxiterations','fix','maxmodes','interp','fix_h','mask','ndirs','complex_version'};

defopts.stop = defstop;
defopts.display = 0;
defopts.t = 1:max(size(x));
defopts.maxiterations = 2000;
defopts.fix = 0;
defopts.maxmodes = 0;
defopts.interp = 'spline';
defopts.fix_h = 0;
defopts.mask = 0;
defopts.ndirs = 4;
defopts.complex_version = 2;

opts = defopts;


if(nargin==1)
  inopts = defopts;
elseif nargin == 0
  error('not enough arguments')
end


names = fieldnames(inopts);
for nom = names'
  if ~any(strcmpi(char(nom), opt_fields))
    error(['bad option field name: ',char(nom)])
  end
  if ~isempty(eval(['inopts.',char(nom)])) % empty values are discarded
    eval(['opts.',lower(char(nom)),' = inopts.',char(nom),';'])
  end
end

t = opts.t;
stop = opts.stop;
display_sifting = opts.display;
MAXITERATIONS = opts.maxiterations;
FIXE = opts.fix;
MAXMODES = opts.maxmodes;
INTERP = opts.interp;
FIXE_H = opts.fix_h;
mask = opts.mask;
ndirs = opts.ndirs;
complex_version = opts.complex_version;

if ~isvector(x)
  error('X must have only one row or one column')
end

if size(x,1) > 1
  x = x.';
end

if ~isvector(t)
  error('option field T must have only one row or one column')
end

if ~isreal(t)
  error('time instants T must be a real vector')
end

if size(t,1) > 1
  t = t';
end

if (length(t)~=length(x))
  error('X and option field T must have the same length')
end

if ~isvector(stop) || length(stop) > 3
  error('option field STOP must have only one row or one column of max three elements')
end

if ~all(isfinite(x))
  error('data elements must be finite')
end

if size(stop,1) > 1
  stop = stop';
end

L = length(stop);
if L < 3
  stop(3)=defstop(3);
end

if L < 2
  stop(2)=defstop(2);
end


if ~ischar(INTERP) || ~any(strcmpi(INTERP,{

    'linear','cubic','spline'}))
  error('INTERP field must be ''linear'', ''cubic'', ''pchip'' or ''spline''')
end

%special procedure when a masking signal is specified
if any(mask)
  if ~isvector(mask) || length(mask) ~= length(x)
    error('masking signal must have the same dimension as the analyzed signal X')
  end

  if size(mask,1) > 1
    mask = mask.';
  end
  opts.mask = 0;
  imf1 = emd(x+mask,opts);
  imf2 = emd(x-mask,opts);
  if size(imf1,1) ~= size(imf2,1)
    warning('emd:warning',['the two sets of IMFs have different sizes: ',int2str(size(imf1,1)),' and ',int2str(size(imf2,1)),' IMFs.'])
  end
  S1 = size(imf1,1);
  S2 = size(imf2,1);
  if S1 ~= S2
    if S1 < S2
      tmp = imf1;
      imf1 = imf2;
      imf2 = tmp;
    end
    imf2(max(S1,S2),1) = 0;
  end
  imf = (imf1+imf2)/2;

end


sd = stop(1);
sd2 = stop(2);
tol = stop(3);

lx = length(x);

sdt = sd*ones(1,lx);
sd2t = sd2*ones(1,lx);

if FIXE
  MAXITERATIONS = FIXE;
  if FIXE_H
    error('cannot use both ''FIX'' and ''FIX_H'' modes')
  end
end

MODE_COMPLEX = ~isreal(x)*complex_version;
if MODE_COMPLEX && complex_version ~= 1 && complex_version ~= 2
  error('COMPLEX_VERSION parameter must equal 1 or 2')
end


% number of extrema and zero-crossings in residual
ner = lx;
nzr = lx;

r = x;

if ~any(mask) % if a masking signal is specified "imf" already exists at this stage
  imf = [];
end
k = 1;

% iterations counter for extraction of 1 mode
nbit=0;

% total iterations counter
NbIt=0;
end
%---------------------------------------------------------------------------------------------------
4、
function [modes its]=ceemdan(x,Nstd,NR,MaxIter)

% WARNING: for this code works it is necessary to include in the same
%directoy the file emd.m developed by Rilling and Flandrin.
%This file is available at %http://perso.ens-lyon.fr/patrick.flandrin/emd.html
%We use the default stopping criterion.
%We use the last modification: 3.2007
%
% This version was run on Matlab 7.10.0 (R2010a)
%----------------------------------------------------------------------
%   INPUTs
%   x: signal to decompose
%   Nstd: noise standard deviation
%   NR: number of realizations
%   MaxIter: maximum number of sifting iterations allowed.
%
%  OUTPUTs
%  modes: contain the obtained modes in a matrix with the rows being the modes
%   its: contain the sifting iterations needed for each mode for each realization (one row for each realization)
% -------------------------------------------------------------------------
%  Syntax
%
%  modes=ceemdan(x,Nstd,NR,MaxIter)
%  [modes its]=ceemdan(x,Nstd,NR,MaxIter)
%
%--------------------------------------------------------------------------
% This algorithm was presented at ICASSP 2011, Prague, Czech Republic
% Plese, if you use this code in your work, please cite the paper where the
% algorithm was first presented.
% If you use this code, please cite:
%
% M.E.TORRES, M.A. COLOMINAS, G. SCHLOTTHAUER, P. FLANDRIN,
%  "A complete Ensemble Empirical Mode decomposition with adaptive noise,"
%  IEEE Int. Conf. on Acoust., Speech and Signal Proc. ICASSP-11, pp. 4144-4147, Prague (CZ)
%
% -------------------------------------------------------------------------
% Date: June 06,2011
% Authors:  Torres ME, Colominas MA, Schlotthauer G, Flandrin P.
% For problems with the code, please contact the authors:
% To:  macolominas(AT)bioingenieria.edu.ar
% CC:  metorres(AT)santafe-conicet.gov.ar
% -------------------------------------------------------------------------

x=x(:)';
desvio_x=std(x);
x=x/desvio_x;

modes=zeros(size(x));
temp=zeros(size(x));
aux=zeros(size(x));
acum=zeros(size(x));
iter=zeros(NR,round(log2(length(x))+5));

for i=1:NR
    white_noise{

    i}=randn(size(x));%creates the noise realizations
end;

for i=1:NR
    modes_white_noise{

    i}=emd(white_noise{

    i});%calculates the modes of white gaussian noise
end;

for i=1:NR %calculates the first mode
    temp=x+Nstd*white_noise{

    i};
    [temp, o, it]=emd(temp,'MAXMODES',1,'MAXITERATIONS',MaxIter);
    temp=temp(1,:);
    aux=aux+temp/NR;
    iter(i,1)=it;
end;

modes=aux; %saves the first mode
k=1;
aux=zeros(size(x));
acum=sum(modes,1);

while  nnz(diff(sign(diff(x-acum))))>2 %calculates the rest of the modes
    for i=1:NR
        tamanio=size(modes_white_noise{

    i});
        if tamanio(1)>=k+1
            noise=modes_white_noise{

    i}(k,:);
            noise=noise/std(noise);
            noise=Nstd*noise;
            try
                [temp, o, it]=emd(x-acum+std(x-acum)*noise,'MAXMODES',1,'MAXITERATIONS',MaxIter);
                temp=temp(1,:);
            catch
                it=0;
                temp=x-acum;
            end;
        else
            [temp, o, it]=emd(x-acum,'MAXMODES',1,'MAXITERATIONS',MaxIter);
            temp=temp(1,:);
        end;
        aux=aux+temp/NR;
    iter(i,k+1)=it;
    end;
    modes=[modes;aux];
    aux=zeros(size(x));
    acum=zeros(size(x));
    acum=sum(modes,1);
    k=k+1;
end;
modes=[modes;(x-acum)];
[a b]=size(modes);
iter=iter(:,1:a);
modes=modes*desvio_x;
its=iter;
CEEMDAN数据
CEEMDAN结果
EEMD代码
1、
%% EEMD(Ensemble Empirical Mode Decomposition)是最常见的一种EMD改进方法,
%% 它的优势主要是解决EMD方法中的模态混叠现象。
clc;
clear all;
close all;
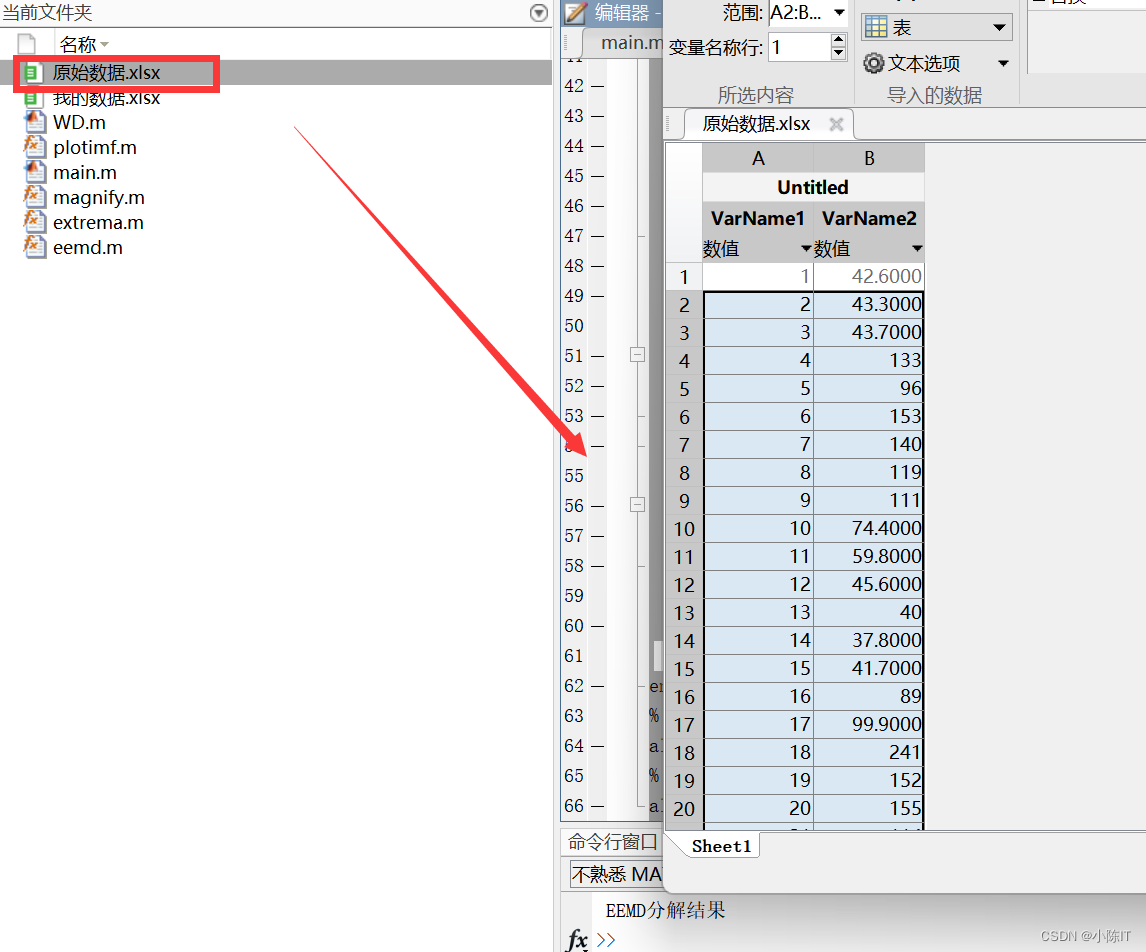
%% 数据导入
data__ = xlsread('原始数据.xlsx');
data = data__(:,2); %数据的第2列
figure;
plot(data,'b');
title('原始信号');
axis('tight');xlabel('采样点');ylabel('信号值');
%% 参数设置并分解
Nstd=0.1; %附加噪声标准差与Y标准差之比
Ne=100; %对信号的平均次数
anmodes=eemd(data,0.1,100)'; %anmodes表示分解后的模态
plotimf(anmodes,size(anmodes,1),'r',' EEMD分解结果'); %画图
2、
%% EEMD(Ensemble Empirical Mode Decomposition)是最常见的一种EMD改进方法,
%% 它的优势主要是解决EMD方法中的模态混叠现象。
clc;
clear all;
close all;
%% 数据导入
data = xlsread('我的数据.xlsx');
figure;
plot(data,'b');
title('原始信号');
axis('tight');xlabel('采样点');ylabel('信号值');
magnify
%% 参数设置并分解
Nstd=0.1; %附加噪声标准差与Y标准差之比
Ne=100; %对信号的平均次数
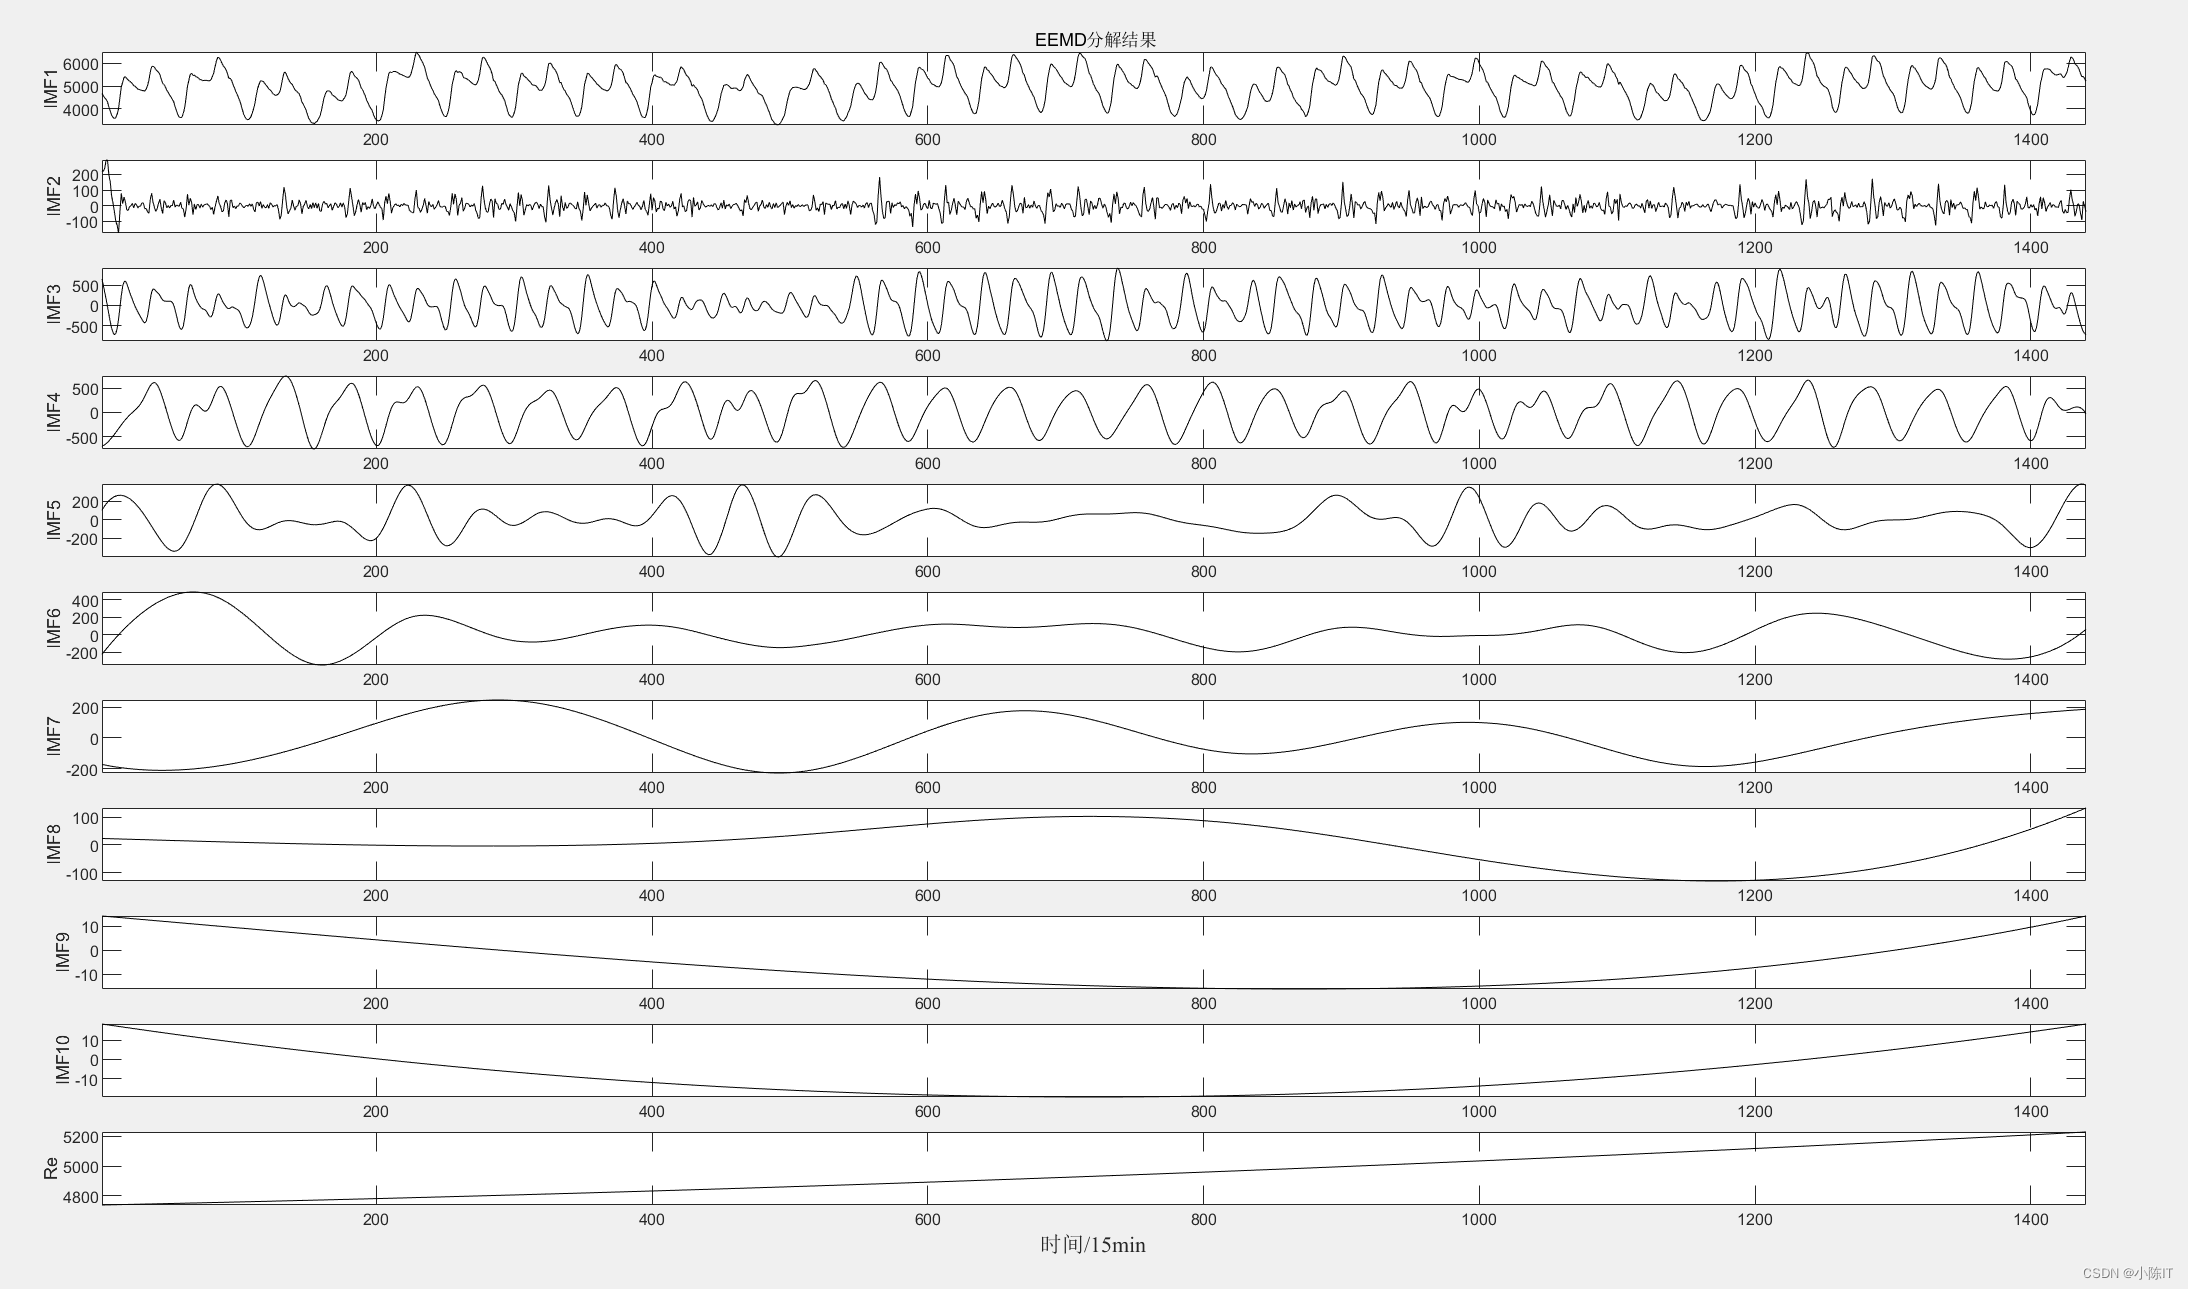
anmodes=eemd(data,0.1,100)'; %anmodes表示分解后的模态
plotimf(anmodes,size(anmodes,1),'k',' EEMD分解结果'); %画图
xlabel(['\fontname{
宋体}时间\fontname{
Times new roman}/15min'],'FontSize',11);
3、
function [ ] = plotimf( IMF,num,color,name)
%   绘制imf
%   此处显示详细说明
for k_first=0:num:size(IMF,1)-1
    figure;
    clear k_second;
    for k_second=1:min(num,size(IMF,1)-k_first)
        subplot(num,1,k_second);
        plot(IMF(k_first+k_second,:),color);axis('tight');
        if(k_first==0 && k_second==1)
            title(name);
        end
       if k_first+k_second<size(IMF,1)
        ylabel(['IMF',num2str(k_first+k_second)]);
       else
        ylabel('Re');
        end
    end
end
disp(name)
end
4、
function magnify(f1)
%
%magnify(f1)
%
%  Figure creates a magnification box when under the mouse
%  position when a button is pressed.  Press '+'/'-' while
%  button pressed to increase/decrease magnification. Press
%  '>'/'<' while button pressed to increase/decrease box size.
%  Hold 'Ctrl' while clicking to leave magnification on figure.
%
%  Example:
%     plot(1:100,randn(1,100),(1:300)/3,rand(1,300)), grid on,
%     magnify;

% Rick Hindman - 7/29/04

if (nargin == 0), f1 = gcf; end;
set(f1, ...
   'WindowButtonDownFcn',  @ButtonDownCallback, ...
   'WindowButtonUpFcn', @ButtonUpCallback, ...
   'WindowButtonMotionFcn', @ButtonMotionCallback, ...
   'KeyPressFcn', @KeyPressCallback);
return;

function ButtonDownCallback(src,eventdata)
   f1 = src;
   a1 = get(f1,'CurrentAxes');
   a2 = copyobj(a1,f1);

   set(f1, ...
      'UserData',[f1,a1,a2], ...
      'Pointer','fullcrosshair', ...
      'CurrentAxes',a2);
   set(a2, ...
      'UserData',[2,0.2], ...  %magnification, frame size
      'Color',get(a1,'Color'), ...
      'Box','on');
   xlabel(''); ylabel(''); zlabel(''); title('');
   set(get(a2,'Children'), ...
      'LineWidth', 2);
   set(a1, ...
      'Color',get(a1,'Color')*0.95);
   set(f1, ...
      'CurrentAxes',a1);
   ButtonMotionCallback(src);
return;

function ButtonUpCallback(src,eventdata)
   H = get(src,'UserData');
   f1 = H(1); a1 = H(2); a2 = H(3);
   set(a1, ...
      'Color',get(a2,'Color'));
   set(f1, ...
      'UserData',[], ...
      'Pointer','arrow', ...
      'CurrentAxes',a1);
   if ~strcmp(get(f1,'SelectionType'),'alt'),
      delete(a2);
   end;
return;

function ButtonMotionCallback(src,eventdata)
   H = get(src,'UserData');
   if ~isempty(H)
      f1 = H(1); a1 = H(2); a2 = H(3);
      a2_param = get(a2,'UserData');
      f_pos = get(f1,'Position');
      a1_pos = get(a1,'Position');

      [f_cp, a1_cp] = pointer2d(f1,a1);

      set(a2,'Position',[(f_cp./f_pos(3:4)) 0 0]+a2_param(2)*a1_pos(3)*[-1 -1 2 2]);
      a2_pos = get(a2,'Position');

   	set(a2,'XLim',a1_cp(1)+(1/a2_param(1))*(a2_pos(3)/a1_pos(3))*diff(get(a1,'XLim'))*[-0.5 0.5]);
   	set(a2,'YLim',a1_cp(2)+(1/a2_param(1))*(a2_pos(4)/a1_pos(4))*diff(get(a1,'YLim'))*[-0.5 0.5]);
   end;
return;

function KeyPressCallback(src,eventdata)
   H = get(gcf,'UserData');
   if ~isempty(H)
      f1 = H(1); a1 = H(2); a2 = H(3);
      a2_param = get(a2,'UserData');
      if (strcmp(get(f1,'CurrentCharacter'),'+') | strcmp(get(f1,'CurrentCharacter'),'='))
         a2_param(1) = a2_param(1)*1.2;
      elseif (strcmp(get(f1,'CurrentCharacter'),'-') | strcmp(get(f1,'CurrentCharacter'),'_'))
         a2_param(1) = a2_param(1)/1.2;
      elseif (strcmp(get(f1,'CurrentCharacter'),'<') | strcmp(get(f1,'CurrentCharacter'),','))
         a2_param(2) = a2_param(2)/1.2;
      elseif (strcmp(get(f1,'CurrentCharacter'),'>') | strcmp(get(f1,'CurrentCharacter'),'.'))
         a2_param(2) = a2_param(2)*1.2;
      end;
      set(a2,'UserData',a2_param);
   	ButtonMotionCallback(src);
   end;
return;


% Included for completeness (usually in own file)
function [fig_pointer_pos, axes_pointer_val] = pointer2d(fig_hndl,axes_hndl)
%
%pointer2d(fig_hndl,axes_hndl)
%
%	Returns the coordinates of the pointer (in pixels)
%	in the desired figure (fig_hndl) and the coordinates
%       in the desired axis (axes coordinates)
%
% Example:
%  figure(1),
%  hold on,
%  for i = 1:1000,
%     [figp,axp]=pointer2d;
%     plot(axp(1),axp(2),'.','EraseMode','none');
%     drawnow;
%  end;
%  hold off

% Rick Hindman - 4/18/01

if (nargin == 0), fig_hndl = gcf; axes_hndl = gca; end;
if (nargin == 1), axes_hndl = get(fig_hndl,'CurrentAxes'); end;

set(fig_hndl,'Units','pixels');

pointer_pos = get(0,'PointerLocation');	%pixels {

    0,0} lower left
fig_pos = get(fig_hndl,'Position');	%pixels {

    l,b,w,h}

fig_pointer_pos = pointer_pos - fig_pos([1,2]);
set(fig_hndl,'CurrentPoint',fig_pointer_pos);

if (isempty(axes_hndl)),
	axes_pointer_val = [];
elseif (nargout == 2),
	axes_pointer_line = get(axes_hndl,'CurrentPoint');
	axes_pointer_val = sum(axes_pointer_line)/2;
end;
5、
% This is a utility program for significance test.
%
%   function [spmax, spmin, flag]= extrema(in_data)
%
% INPUT:
%       in_data: Inputted data, a time series to be sifted;
% OUTPUT:
%       spmax: The locations (col 1) of the maxima and its corresponding
%              values (col 2)
%       spmin: The locations (col 1) of the minima and its corresponding
%              values (col 2)
%
% References can be found in the "Reference" section.
%
% The code is prepared by Zhaohua Wu. For questions, please read the "Q&A" section or
% contact
%   zhwu@cola.iges.org
%
function [spmax, spmin, flag]= extrema(in_data)

flag=1;
dsize=length(in_data);

spmax(1,1) = 1;
spmax(1,2) = in_data(1);
jj=2;
kk=2;
while jj<dsize,
    if ( in_data(jj-1)<=in_data(jj) & in_data(jj)>=in_data(jj+1) )
        spmax(kk,1) = jj;
        spmax(kk,2) = in_data (jj);
        kk = kk+1;
    end
    jj=jj+1;
end
spmax(kk,1)=dsize;
spmax(kk,2)=in_data(dsize);

if kk>=4
    slope1=(spmax(2,2)-spmax(3,2))/(spmax(2,1)-spmax(3,1));
    tmp1=slope1*(spmax(1,1)-spmax(2,1))+spmax(2,2);
    if tmp1>spmax(1,2)
        spmax(1,2)=tmp1;
    end

    slope2=(spmax(kk-1,2)-spmax(kk-2,2))/(spmax(kk-1,1)-spmax(kk-2,1));
    tmp2=slope2*(spmax(kk,1)-spmax(kk-1,1))+spmax(kk-1,2);
    if tmp2>spmax(kk,2)
        spmax(kk,2)=tmp2;
    end
else
    flag=-1;
end


msize=size(in_data);
dsize=max(msize);
xsize=dsize/3;
xsize2=2*xsize;

spmin(1,1) = 1;
spmin(1,2) = in_data(1);
jj=2;
kk=2;
while jj<dsize,
    if ( in_data(jj-1)>=in_data(jj) & in_data(jj)<=in_data(jj+1))
        spmin(kk,1) = jj;
        spmin(kk,2) = in_data (jj);
        kk = kk+1;
    end
    jj=jj+1;
end
spmin(kk,1)=dsize;
spmin(kk,2)=in_data(dsize);

if kk>=4
    slope1=(spmin(2,2)-spmin(3,2))/(spmin(2,1)-spmin(3,1));
    tmp1=slope1*(spmin(1,1)-spmin(2,1))+spmin(2,2);
    if tmp1<spmin(1,2)
        spmin(1,2)=tmp1;
    end

    slope2=(spmin(kk-1,2)-spmin(kk-2,2))/(spmin(kk-1,1)-spmin(kk-2,1));
    tmp2=slope2*(spmin(kk,1)-spmin(kk-1,1))+spmin(kk-1,2);
    if tmp2<spmin(kk,2)
        spmin(kk,2)=tmp2;
    end
else
    flag=-1;
end

flag=1;
6、
% Y: Inputted data;
% Nstd: ratio of the standard deviation of the added noise and that of Y;
% NE: Ensemble member being used
% TNM: total number of modes (not including the trend)
%
function allmode=eemd_n(Y,Nstd,NE)
% find data length
xsize=length(Y);
dd=1:1:xsize;
% Nornaliz data
Ystd=std(Y);
Y=Y/Ystd;
% Initialize saved data
TNM=fix(log2(xsize))-1;
TNM2=TNM+2;
for kk=1:1:TNM2,
    for ii=1:1:xsize,
        allmode(ii,kk)=0.0;
    end
end

for iii=1:1:NE
% adding noise
    for i=1:xsize,
        temp=randn(1,1)*Nstd;
        X1(i)=Y(i)+temp;
    end

    % sifting X1
    xorigin = X1;
    xend = xorigin;
% save the initial data into the first column
    for jj=1:1:xsize
        mode(jj,1) = xorigin(jj);
    end
    nmode = 1;
    while nmode <= TNM,
         xstart = xend;
        iter = 1;
        while iter<=5,
             [spmax, spmin, flag]=extrema(xstart);
             upper= spline(spmax(:,1),spmax(:,2),dd);
             lower= spline(spmin(:,1),spmin(:,2),dd);
             mean_ul = (upper + lower)/2;
             xstart = xstart - mean_ul;
             iter = iter +1;
        end
        xend = xend - xstart;
        nmode=nmode+1;
        % save a mode
        for jj=1:1:xsize,
            mode(jj,nmode) = xstart(jj);
        end
    end
    % save the trend
    for jj=1:1:xsize,
        mode(jj,nmode+1)=xend(jj);
    end
    % add mode to the sum of modes from earlier ensemble members
    allmode=allmode+mode;

end
% ensemble average
allmode=allmode/NE/2;
% Rescale mode to origional unit.
allmode=allmode*Ystd;
EEMD数据
EEMD结果

EMD代码
1、
%% EEMD(Ensemble Empirical Mode Decomposition)是最常见的一种EMD改进方法,
%% 它的优势主要是解决EMD方法中的模态混叠现象。
clc;
clear all;
close all;
%% 数据导入
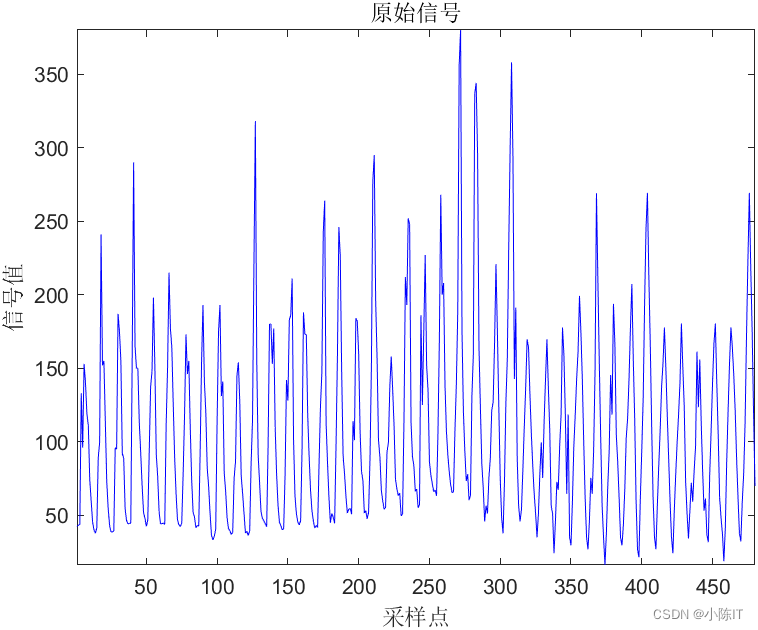
data= xlsread('我的数据.xlsx');
figure;
plot(data,'b');
title('原始信号');
axis('tight');xlabel('采样点');ylabel('信号值');
%% 参数设置并分解
Nstd=0.1; %附加噪声标准差与Y标准差之比
Ne=100; %对信号的平均次数
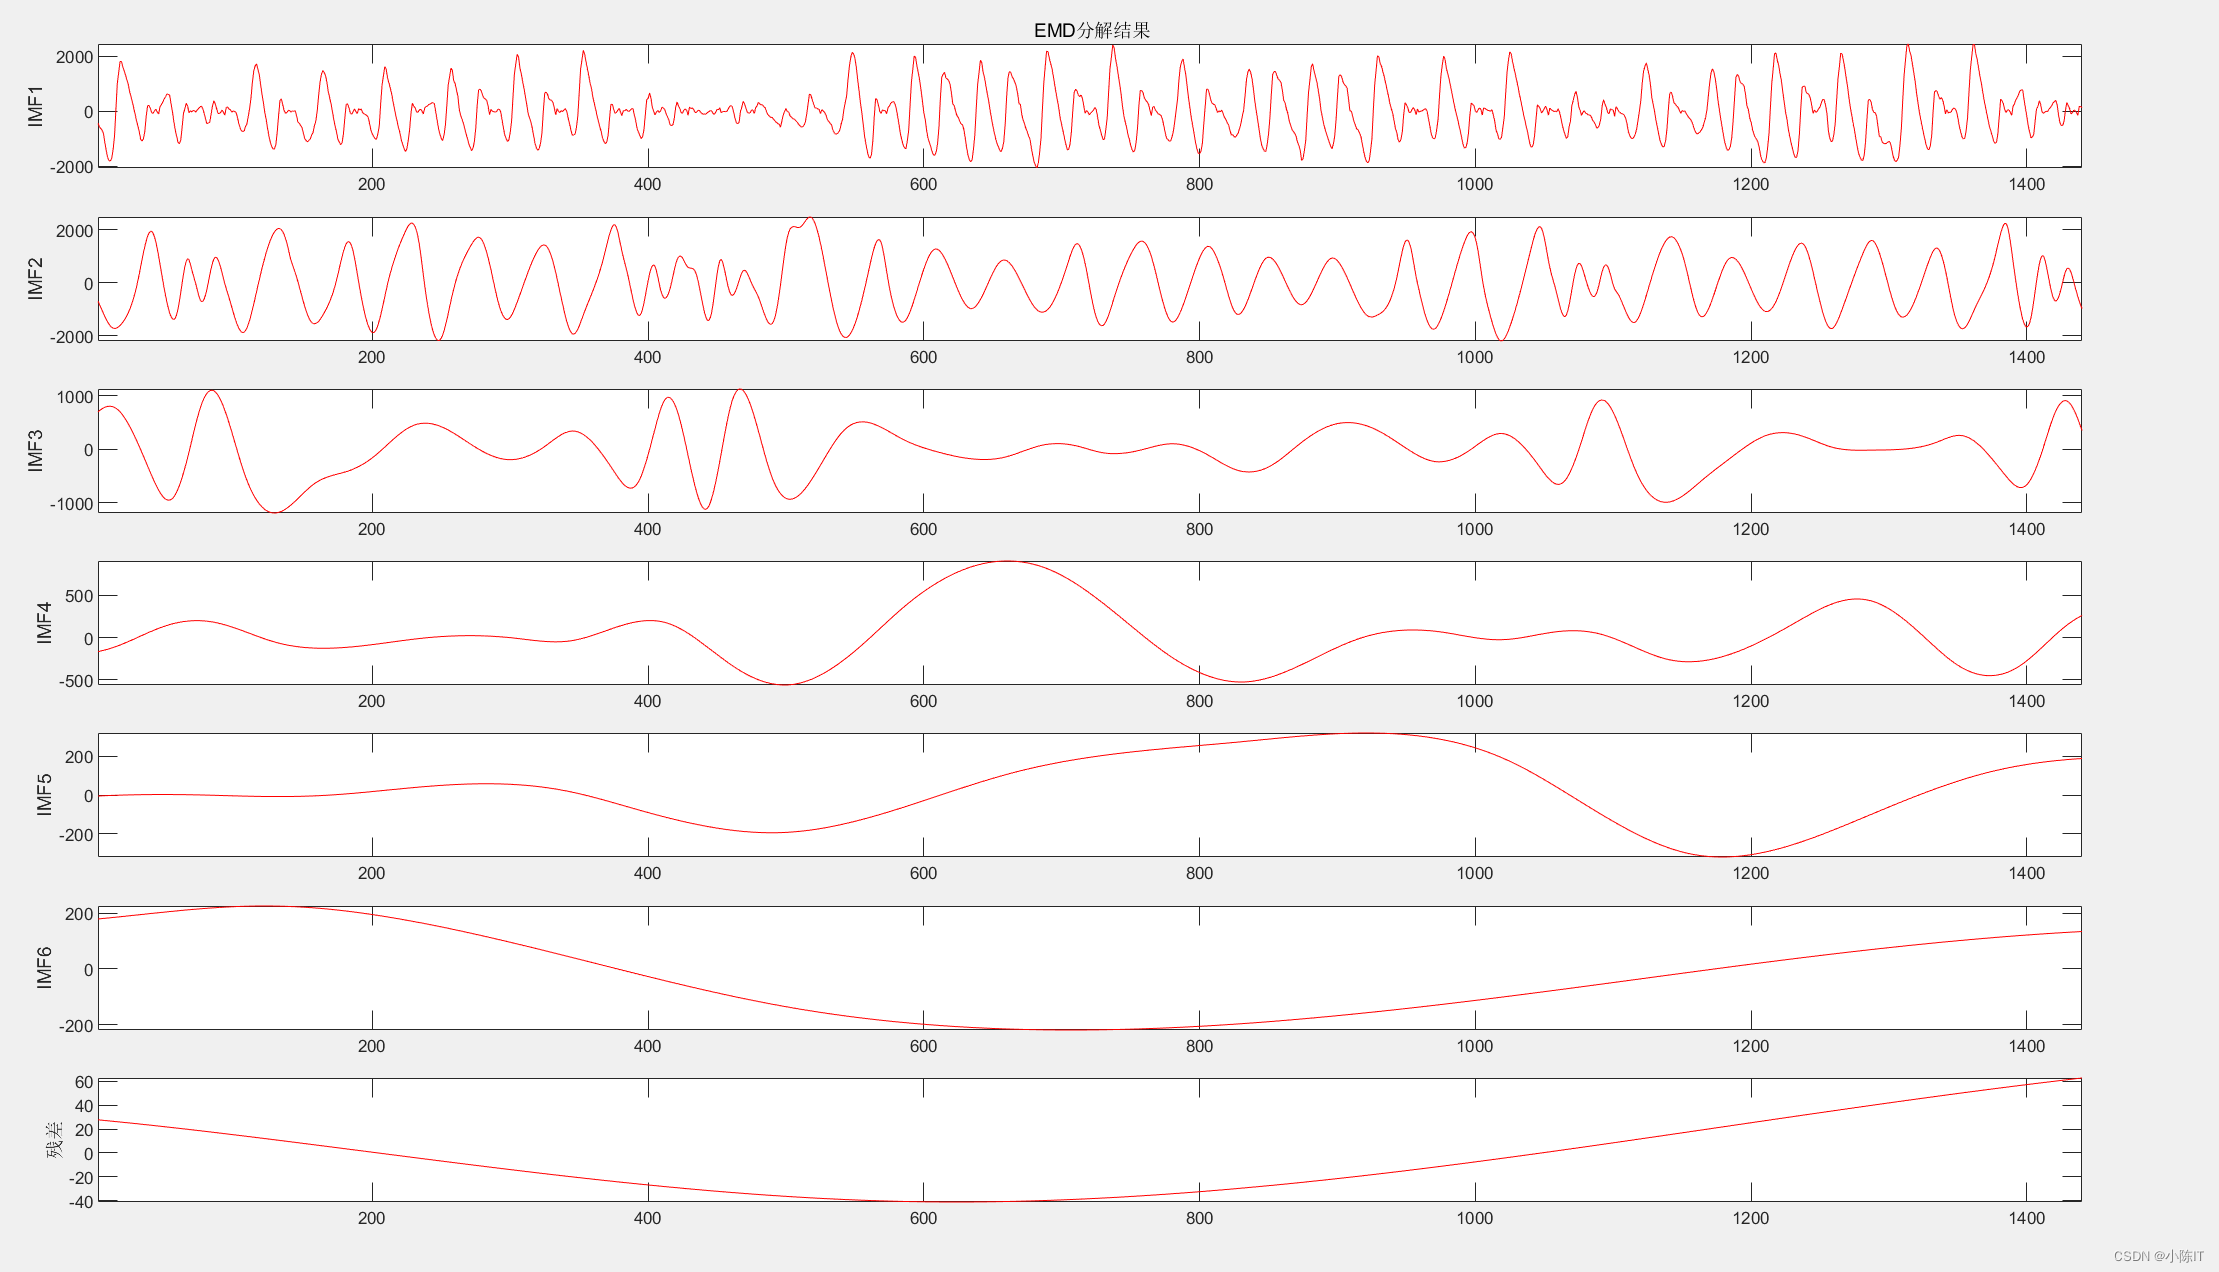
anmodes=emd(data)'; %anmodes表示分解后的模态
plotimf(anmodes,size(anmodes,1),'r',' EMD分解结果'); %画图
2、
function [ ] = plotimf( IMF,num,color,name)
%   绘制imf
%   此处显示详细说明
for k_first=0:num:size(IMF,1)-1
    figure;
    clear k_second;
    for k_second=1:min(num,size(IMF,1)-k_first)
        subplot(num,1,k_second);
        plot(IMF(k_first+k_second,:),color);axis('tight');
        if(k_first==0 && k_second==1)
            title(name);
        end
       if k_first+k_second<size(IMF,1)
        ylabel(['IMF',num2str(k_first+k_second)]);
       else
        ylabel('残差');
        end
    end
end
disp(name)
end
EMD数据
EMD结果
VMD代码
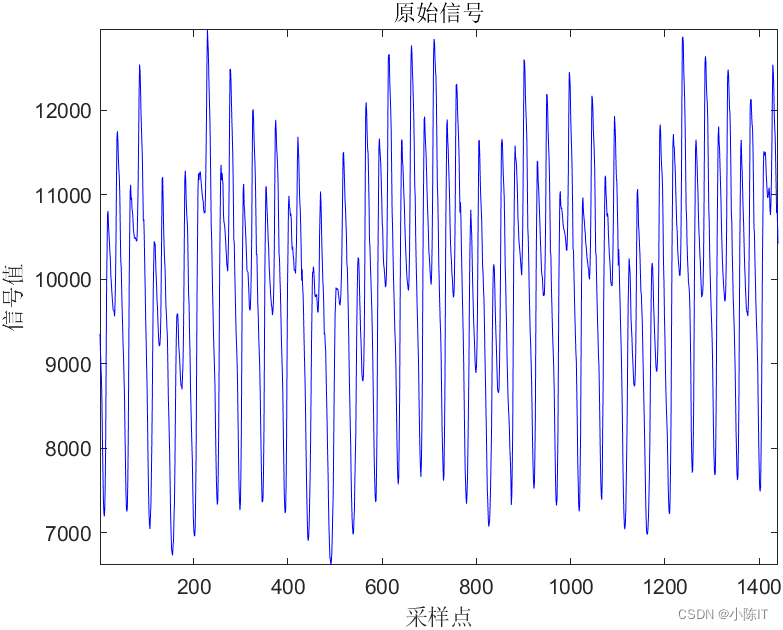
1、
%% EEMD(Ensemble Empirical Mode Decomposition)是最常见的一种EMD改进方法,
%% 它的优势主要是解决EMD方法中的模态混叠现象。
clc;
clear all;
close all;
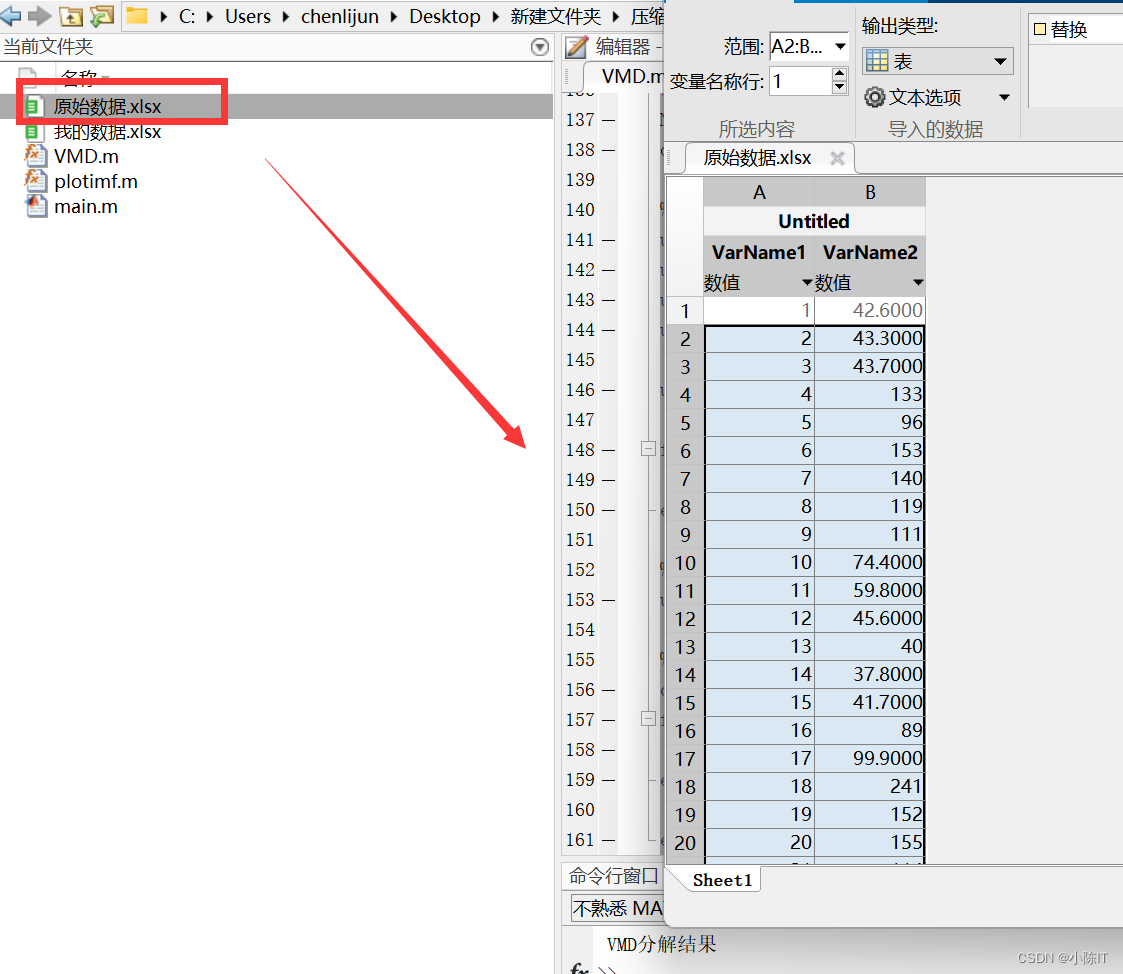
%% 数据导入
data__ = xlsread('原始数据.xlsx');
data = data__(:,2); %数据的第2列
figure;
plot(data,'b');
title('原始信号');
axis('tight');xlabel('采样点');ylabel('信号值');
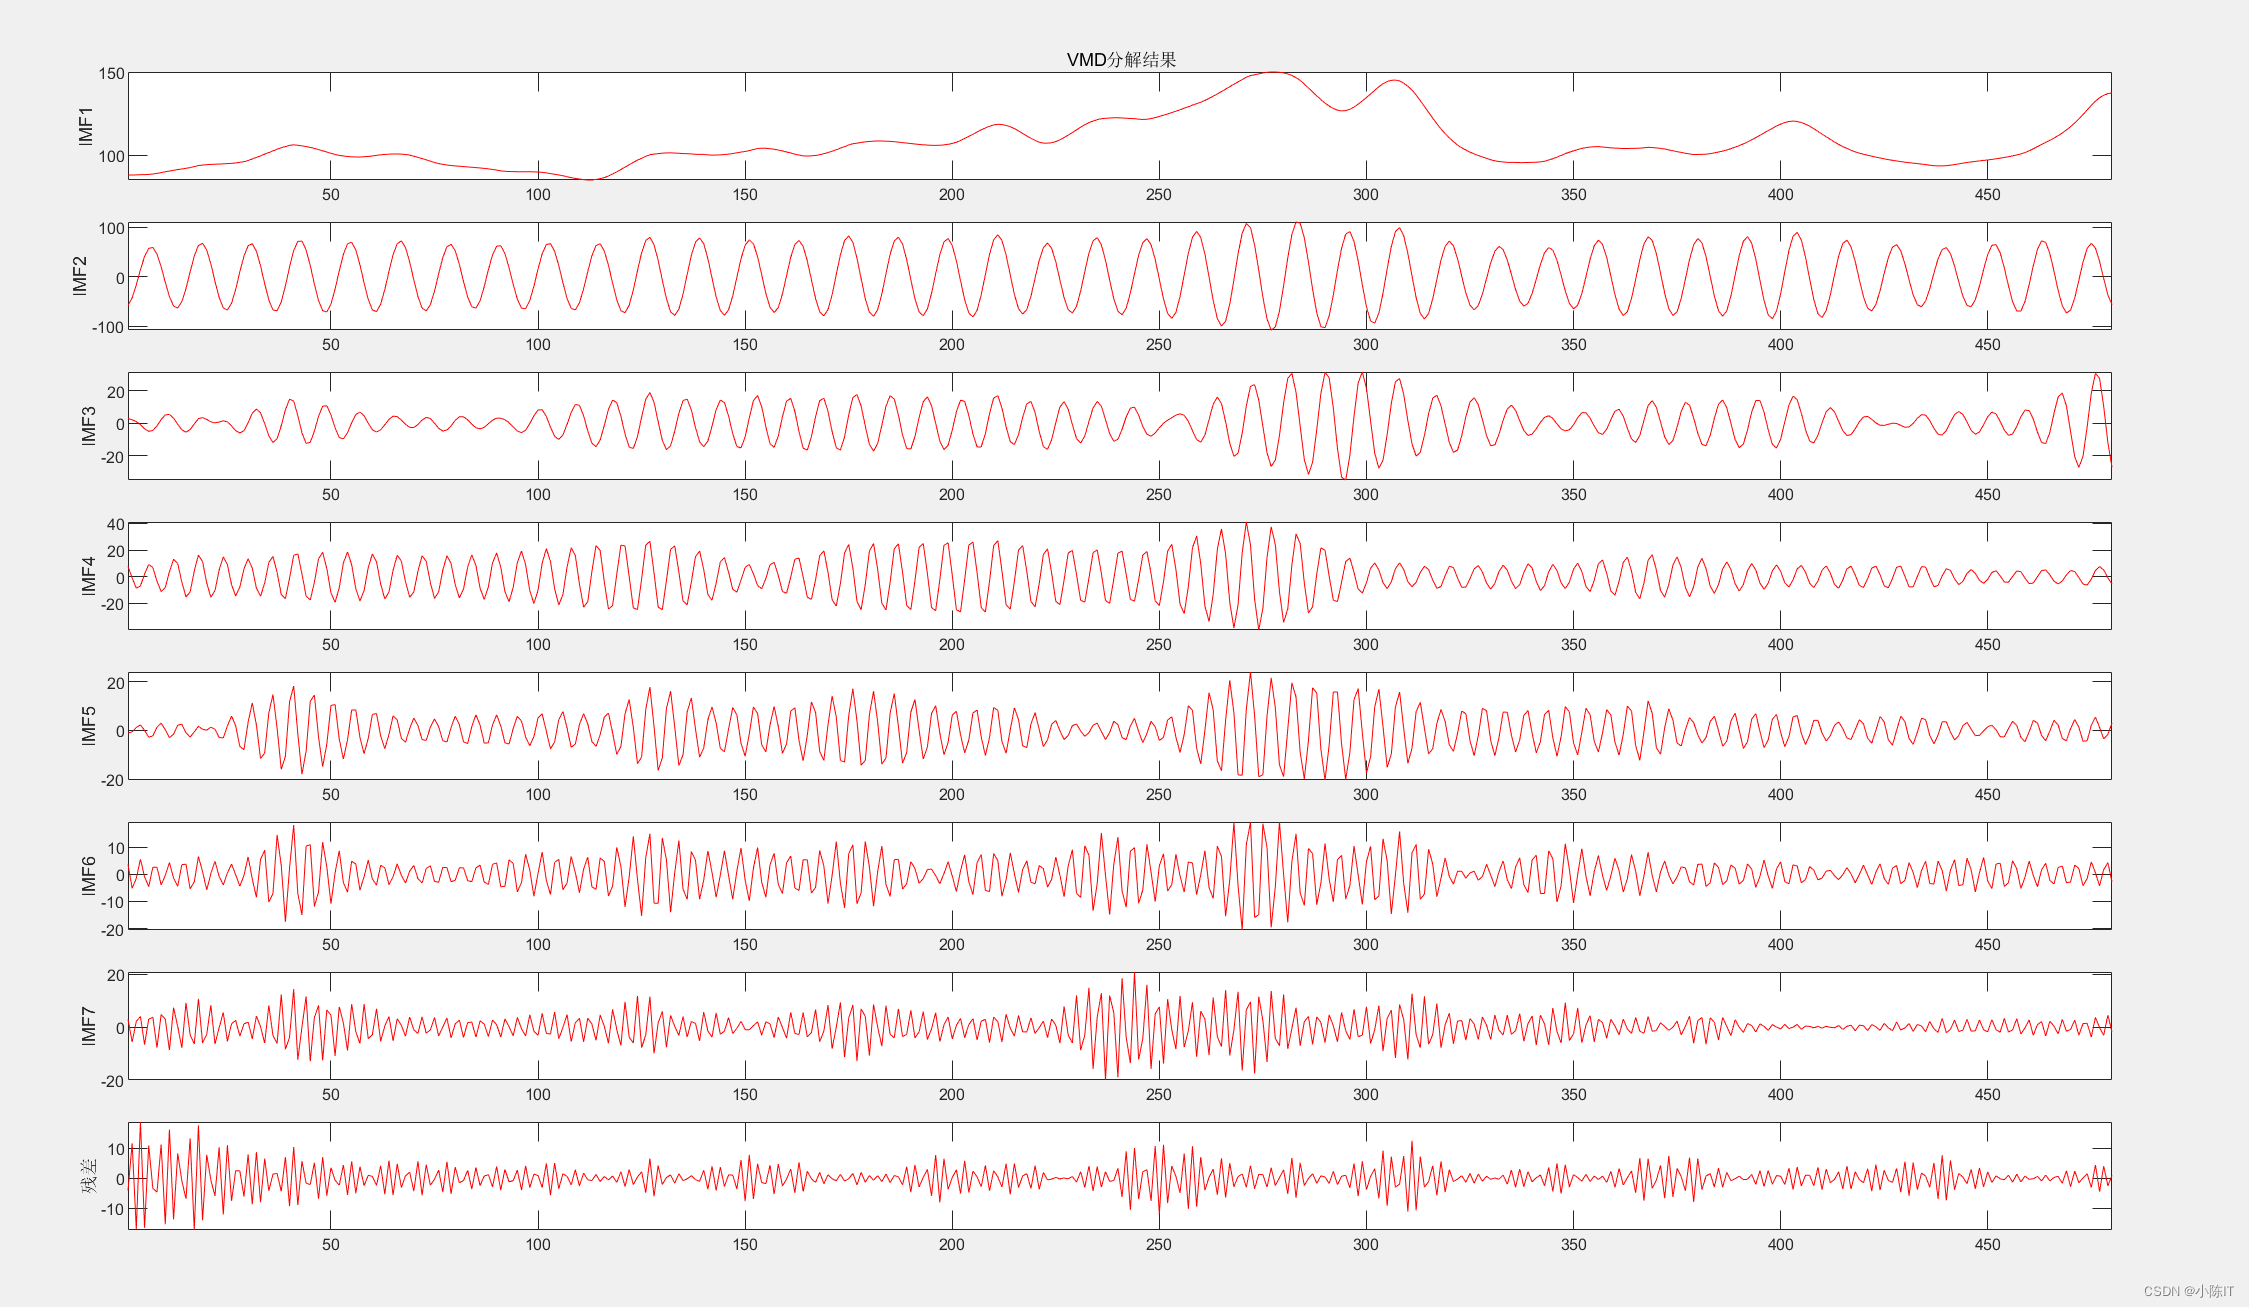
%% 参数设置并分解
alpha = 2000; % moderate bandwidth constraint
tau = 0; % noise-tolerance (no strict fidelity enforcement)
K = 8; % 4 modes
DC = 0; % no DC part imposed
init = 1; % initialize omegas uniformly
tol = 1e-7;
[anmodes, u_hat, omega] = VMD(data, alpha, tau, K, DC, init, tol);
plotimf(anmodes,size(anmodes,1),'r',' VMD分解结果'); %画图
2、
function [ ] = plotimf( IMF,num,color,name)
%   绘制imf
%   此处显示详细说明
for k_first=0:num:size(IMF,1)-1
    figure;
    clear k_second;
    for k_second=1:min(num,size(IMF,1)-k_first)
        subplot(num,1,k_second);
        plot(IMF(k_first+k_second,:),color);axis('tight');
        if(k_first==0 && k_second==1)
            title(name);
        end
       if k_first+k_second<size(IMF,1)
        ylabel(['IMF',num2str(k_first+k_second)]);
       else
        ylabel('残差');
        end
    end
end
disp(name)
end
3、
function [u, u_hat, omega] = VMD(signal, alpha, tau, K, DC, init, tol)
% Input and Parameters:
% ---------------------

% Input Parameters:
% signal:要分解的时域信号
% alpha: 惩罚因子,也称平衡参数
% tau:噪声容忍度
% K:分解的模态数
% DC:直流分量
% init:初始化中心频率
%       0 = all omegas start at 0
%       1 = all omegas start uniformly distributed
%       2 = all omegas initialized randomly
% tol:收敛准则容忍度;通常在1e-6左右。
%
% Output Parameters:
% u:分解模式的集合
% u_hat:模式的频谱
% omega:估计模式中心频率

%---------- Preparations

% 输入信号的周期和采样频率
save_T = length(signal);
fs = 1/save_T;

% 通过镜像扩展信号
T = save_T;
f_mirror(1:T/2) = signal(T/2:-1:1);
f_mirror(T/2+1:3*T/2) = signal;
f_mirror(3*T/2+1:2*T) = signal(T:-1:T/2+1);
f = f_mirror;

% 时域0到T(镜像信号)
T = length(f);
t = (1:T)/T;

% Spectral Domain discretization
freqs = t-0.5-1/T;

% 最大迭代数
N = 500;

% For future generalizations: individual alpha for each mode
Alpha = alpha*ones(1,K);

% Construct and center f_hat
f_hat = fftshift((fft(f)));
f_hat_plus = f_hat;
f_hat_plus(1:T/2) = 0;

% matrix keeping track of every iterant // could be discarded for mem
u_hat_plus = zeros(N, length(freqs), K);

% Initialization of omega_k
omega_plus = zeros(N, K);
switch init
    case 1
        for i = 1:K
            omega_plus(1,i) = (0.5/K)*(i-1);
        end
    case 2
        omega_plus(1,:) = sort(exp(log(fs) + (log(0.5)-log(fs))*rand(1,K)));
    otherwise
        omega_plus(1,:) = 0;
end

% if DC mode imposed, set its omega to 0
if DC
    omega_plus(1,1) = 0;
end

% start with empty dual variables
lambda_hat = zeros(N, length(freqs));

% other inits
uDiff = tol+eps; % update step
n = 1; % loop counter
sum_uk = 0; % accumulator


% ----------- Main loop for iterative updates


while ( uDiff > tol &&  n < N ) % not converged and below iterations limit

    % update first mode accumulator
    k = 1;
    sum_uk = u_hat_plus(n,:,K) + sum_uk - u_hat_plus(n,:,1);

    % update spectrum of first mode through Wiener filter of residuals
    u_hat_plus(n+1,:,k) = (f_hat_plus - sum_uk - lambda_hat(n,:)/2)./(1+Alpha(1,k)*(freqs - omega_plus(n,k)).^2);

    % update first omega if not held at 0
    if ~DC
        omega_plus(n+1,k) = (freqs(T/2+1:T)*(abs(u_hat_plus(n+1, T/2+1:T, k)).^2)')/sum(abs(u_hat_plus(n+1,T/2+1:T,k)).^2);
    end

    % update of any other mode
    for k=2:K

        % accumulator
        sum_uk = u_hat_plus(n+1,:,k-1) + sum_uk - u_hat_plus(n,:,k);

        % mode spectrum
        u_hat_plus(n+1,:,k) = (f_hat_plus - sum_uk - lambda_hat(n,:)/2)./(1+Alpha(1,k)*(freqs - omega_plus(n,k)).^2);

        % center frequencies
        omega_plus(n+1,k) = (freqs(T/2+1:T)*(abs(u_hat_plus(n+1, T/2+1:T, k)).^2)')/sum(abs(u_hat_plus(n+1,T/2+1:T,k)).^2);

    end

    % Dual ascent
    lambda_hat(n+1,:) = lambda_hat(n,:) + tau*(sum(u_hat_plus(n+1,:,:),3) - f_hat_plus);

    % loop counter
    n = n+1;

    % converged yet?
    uDiff = eps;
    for i=1:K
        uDiff = uDiff + 1/T*(u_hat_plus(n,:,i)-u_hat_plus(n-1,:,i))*conj((u_hat_plus(n,:,i)-u_hat_plus(n-1,:,i)))';
    end
    uDiff = abs(uDiff);

end


%------ Postprocessing and cleanup


% discard empty space if converged early
N = min(N,n);
omega = omega_plus(1:N,:);

% Signal reconstruction
u_hat = zeros(T, K);
u_hat((T/2+1):T,:) = squeeze(u_hat_plus(N,(T/2+1):T,:));
u_hat((T/2+1):-1:2,:) = squeeze(conj(u_hat_plus(N,(T/2+1):T,:)));
u_hat(1,:) = conj(u_hat(end,:));

u = zeros(K,length(t));

for k = 1:K
    u(k,:)=real(ifft(ifftshift(u_hat(:,k))));
end

% remove mirror part
u = u(:,T/4+1:3*T/4);

% recompute spectrum
clear u_hat;
for k = 1:K
    u_hat(:,k)=fftshift(fft(u(k,:)))';
end

end
VMD数据
VMD结果
IMF代码
1、
%% IMF方差贡献率、平均周期、相关系数的计算,高频、低频、趋势项分量判别与重构程序(公开版)
% 本程序2022.03定型,后续更新都在完整版代码中
% 知乎原文链接(方差贡献率、平均周期、相关系数):https://zhuanlan.zhihu.com/p/476576594
% 知乎原文链接(高频、低频、趋势项分量判别与重构程序):https://zhuanlan.zhihu.com/p/479581902
% 完整版代码地址:http://www.khscience.cn/docs/index.php/2022/03/20/imf/
clear all
close all
%% 0.读入数据
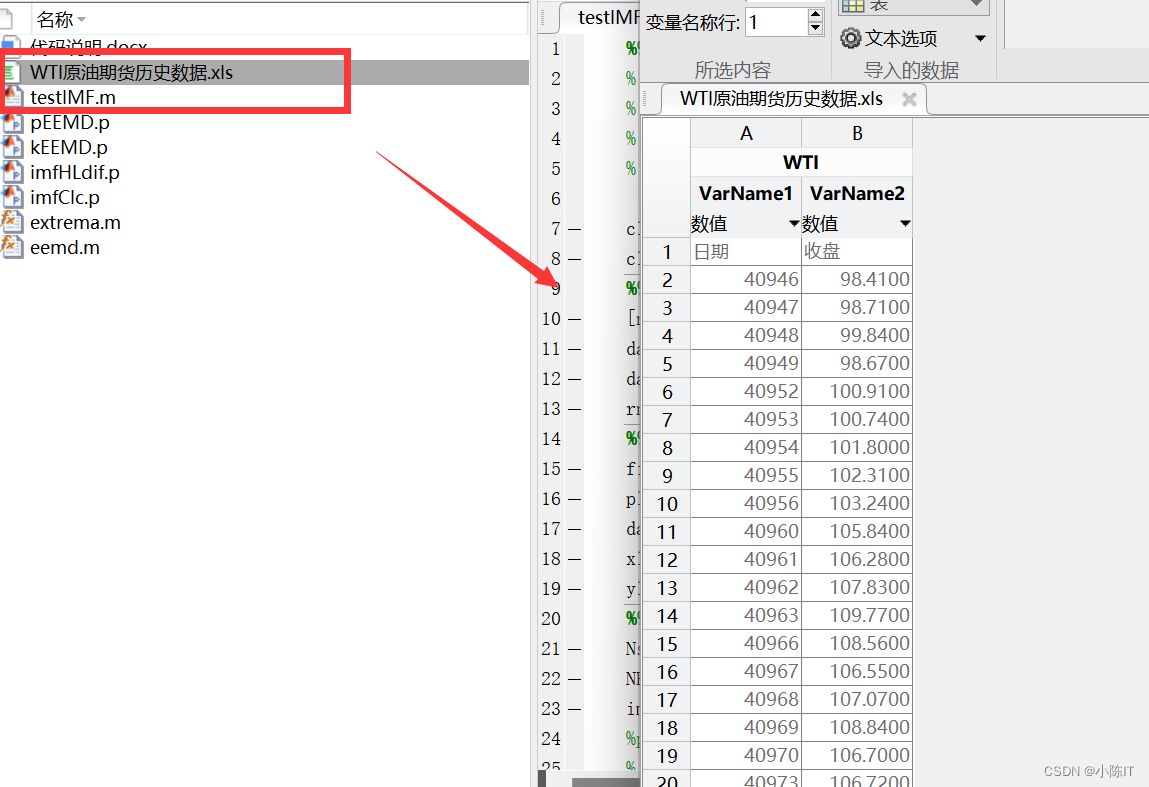
[num,date,raw] = xlsread('WTI原油期货历史数据.xls','A2:A300');
data = xlsread('WTI原油期货历史数据.xls','B2:B300');
datenn = datenum(date);
rng(12345); %设置随机种子,使每次运行结果保持一致
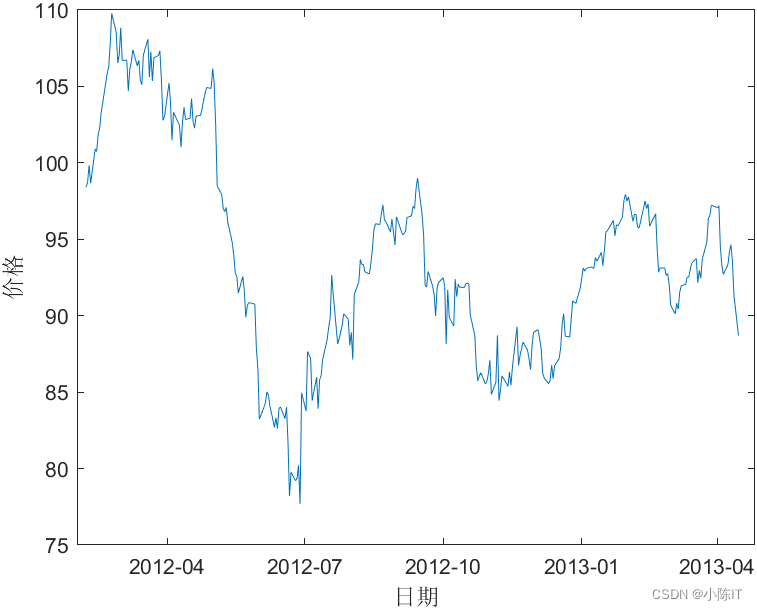
%% 1.原始数据画图
figure('color','w')
plot(datenn,data)
datetick('x','yyyy-mm','keeplimits')
xlabel('日期')
ylabel('价格')
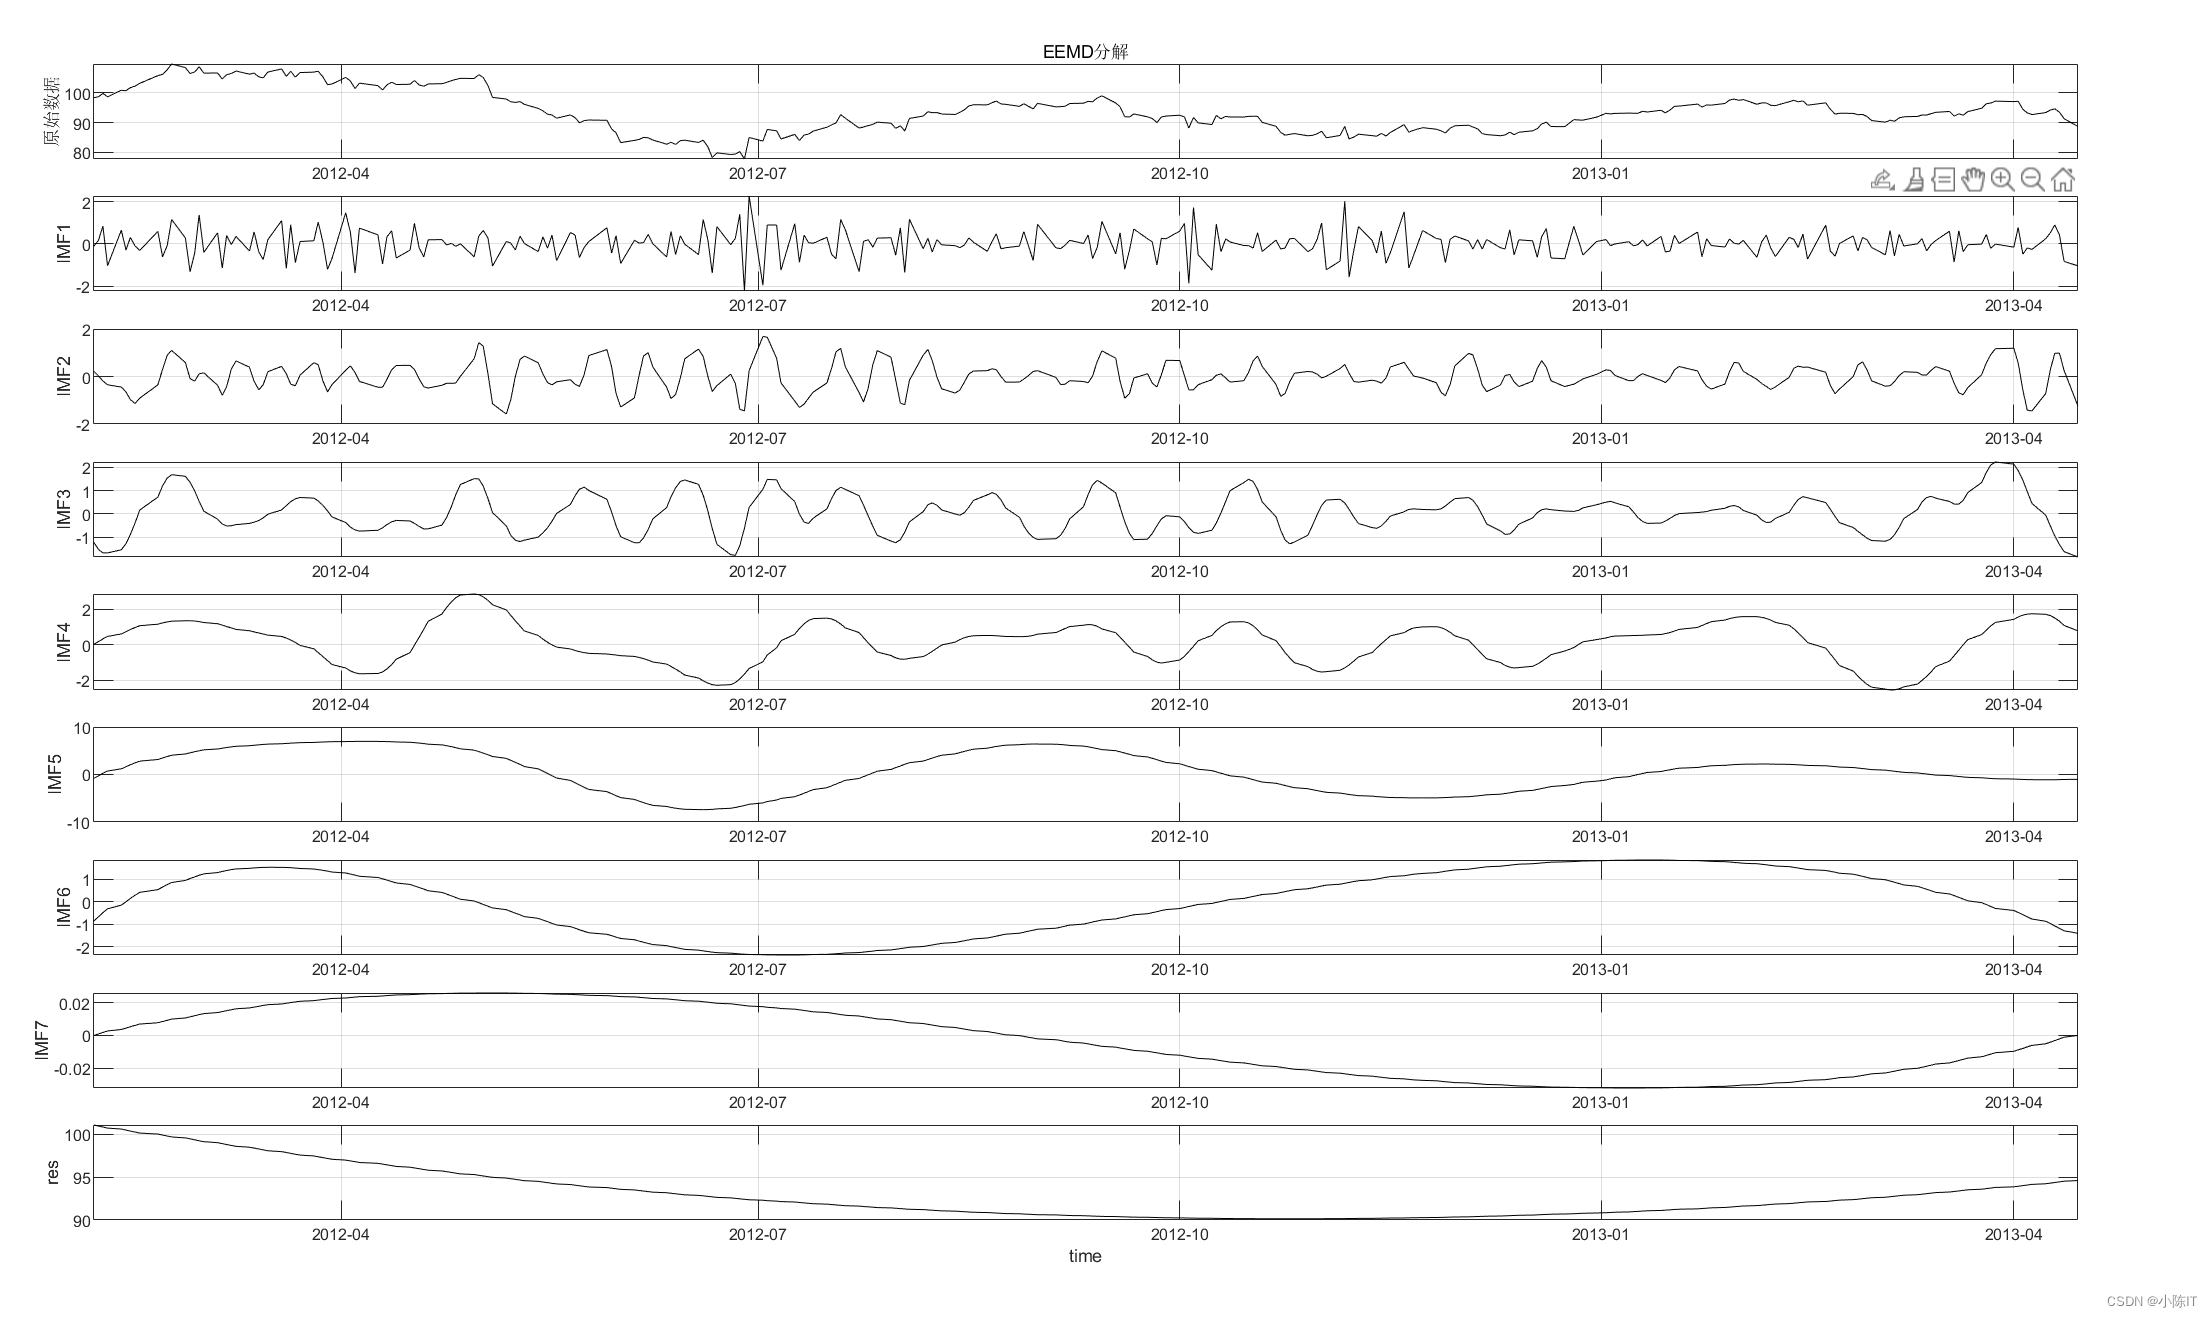
%% 2.EEMD分解
Nstd = 0.2; %Nstd为附加噪声标准差与Y标准差之比
NE = 100; %NE为对信号的平均次数
imf = pEEMD(data,datenn,Nstd,NE);
%pEEMD进行了一定修改,即在34、41行加入datetick('x','yyyy-mm','keeplimits'),
%目的是设定横坐标的刻度值为日期,如果改用其他分解方法,如果要以日期为时间轴,则要参照此函数文件的写法修改
%% 3.分析imf方差比,平均周期和Pearson相关系数
[VarR,AvePer,PearsonCor] = imfClc(data,imf(1:end-1,:));
% 对于“类EMD”方法分解后得到的各个分量计算评价指标
% 包括方差贡献率、平均周期和Pearson相关系数
% 输入:
% data:分解前的原数据
% imf:分解后得到的分量,注意imf需要沿行方向分布
% 输出:
% VarR:方差贡献率
% AvePer:平均周期
% PearsonCor:Pearson相关系数
disp(['各分量方差比为:',num2str(VarR)]) %最后一项为趋势项
disp(['各分量平均周期为:',num2str(AvePer)]) %最后一项为趋势项
disp(['各分量Pearson相关系数为:',num2str(PearsonCor)]) %最后一项为趋势项
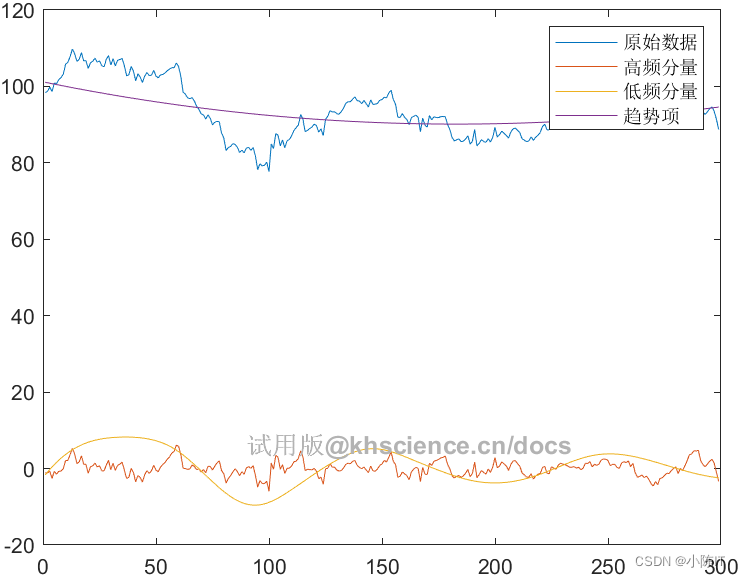
%% 4.频率识别
[HighCom,LowCom,TrCom,HighIdx,LowIdx]=imfHLdif(data,imf,'on'); %注意:此处的画图结果中,横坐标为数据点数,如果要让横坐标为日期,请参考完整版代码写法
% 根据重构算法将分解得出的IMF进行高低频的区分
% 参考《基于EEMD模型的中国碳市场价格形成机制研究》
% 该方法将IMF1记为指标1,IMF1+IMF2为指标2,以此类推,
% 前i个IMF的和加成为指标i,并对该均值是否显著区别于0进行t检验。
% 输入:
% data:分解前的原始数据
% imf:经过模态分解方法得到的分量,每一行为一个分量
% figflag:设置是否画图的参数,'on'为画图,'off'为不画图
% 输出:
% HighCom:重构后的高频分量
% LowCom:重构后的低频分量
% TrCom:趋势项
% HighIdx:高频分量对索引
% LowIdx:低频分量对索引
disp(['高频IMF分量索引包括:',num2str(HighIdx)])
disp(['低频IMF分量索引包括:',num2str(LowIdx)])
%% 5.计算高低频分量和趋势项与原价格序列的相关系数与方差比
[VarR2,AvePer2,PearsonCor2] = imfClc(data,[HighCom;LowCom;TrCom]);
disp(['高、低频分量和趋势项与原序列的相关系数:',num2str(PearsonCor2)])
disp(['高、低频分量和趋势项与原序列的方差比:',num2str(VarR2)])
%% 关于完整版代码:
% 公开版代码的函数文件为p文件,可以被调用,但无法查看代码。
% 完整版代码中全部为m文件,m文件可以查看源码并自由修改。
% 公开版代码仅可对长度300以内的数据分析;完整版无长度限制。
% 完整版代码画图无水印。
% 如果需要封装好的函数(imfClc.m、imfHLdif.m、pEEMD.m和kEEMD.m)的源码,可在下述连接(完整版)获取:
% http://www.khscience.cn/docs/index.php/2022/03/20/imf/
2、
%  function [spmax, spmin, flag]= extrema(in_data)
%
% This is a utility program for cubic spline envelope,
%   the code is to  find out max values and max positions
%                            min values and min positions
%    (then use matlab function spline to form the spline)
%
%   function [spmax, spmin, flag]= extrema(in_data)
%
% INPUT:
%       in_data: Inputted data, a time series to be sifted;
% OUTPUT:
%       spmax: The locations (col 1) of the maxima and its corresponding
%              values (col 2)
%       spmin: The locations (col 1) of the minima and its corresponding
%              values (col 2)
%
% NOTE:
%      EMD uses Cubic Spline to be the Maximun and Minimum Envelope for
%        the data.Besides finding spline,end points should be noticed.
%
%References:  ? which paper?
%
%
%
% code writer: Zhaohua Wu.
% footnote:S.C.Su
%
% There are two seperste loops in this code .
% part1.-- find out max values and max positions
%          process the start point and end point
% part2.-- find out min values and max positions
%          process the start point and end point
% Those parts are similar.
%
% Association:eemd.m
% this function ususally used for finding spline envelope
%
% Concerned function: no
%                     (all matlab internal function)

function [spmax, spmin, flag]= extrema(in_data)

flag=1;
dsize=length(in_data);

%part1.--find local max value and do end process

%start point
%spmax(1,1)-the first 1 means first point max value,the second 1 means first index
%spmax(1,2)-the first 1 means first point max value,the second 2 means first index
%spmax(1,1)-for position of max
%spmax(1,2)-for value    of max

spmax(1,1) = 1;
spmax(1,2) = in_data(1);

%Loop --start find max by compare the values
%when [ (the jj th value > than the jj-1 th value ) AND (the jj th value > than the jj+1 th value )
%the value jj is the position of the max
%the value in_data (jj) is the value of the max
%do the loop by index-jj
%after the max value is found,use index -kk to store in the matrix
%kk=1,the start point
%the last value of kk ,the end point

jj=2;
kk=2;
while jj<dsize,
    if ( in_data(jj-1)<=in_data(jj) & in_data(jj)>=in_data(jj+1) )
        spmax(kk,1) = jj;
        spmax(kk,2) = in_data (jj);
        kk = kk+1;
    end
    jj=jj+1;
end

%end point
spmax(kk,1)=dsize;
spmax(kk,2)=in_data(dsize);

%End point process-please see reference about spline end effect
%extend the slpoe of neighbor 2 max value ---as extend value
%original value of end point -----as original value
%compare extend and original value

if kk>=4
    slope1=(spmax(2,2)-spmax(3,2))/(spmax(2,1)-spmax(3,1));
    tmp1=slope1*(spmax(1,1)-spmax(2,1))+spmax(2,2);
    if tmp1>spmax(1,2)
        spmax(1,2)=tmp1;
    end

    slope2=(spmax(kk-1,2)-spmax(kk-2,2))/(spmax(kk-1,1)-spmax(kk-2,1));
    tmp2=slope2*(spmax(kk,1)-spmax(kk-1,1))+spmax(kk-1,2);
    if tmp2>spmax(kk,2)
        spmax(kk,2)=tmp2;
    end
else
    flag=-1;
end

%these 4 sentence seems useless.
msize=size(in_data);
dsize=max(msize);
xsize=dsize/3;
xsize2=2*xsize;


%part2.--find local min value and do end process
%the syntax are all similar with part1.
%here-explan with beginning local max-find upper starting envelope
%the end process procedure-find out the neighbor 2 local extrema value
%connect those 2 local extrema and extend the line to the end
%make judgement with 1).line extend value  2).original data value
%the bigger value is chosen for upper envelope end control point

%local max
spmin(1,1) = 1;
spmin(1,2) = in_data(1);
jj=2;
kk=2;
while jj<dsize,
    if ( in_data(jj-1)>=in_data(jj) & in_data(jj)<=in_data(jj+1))
        spmin(kk,1) = jj;
        spmin(kk,2) = in_data (jj);
        kk = kk+1;
    end
    jj=jj+1;
end


%local min
spmin(kk,1)=dsize;
spmin(kk,2)=in_data(dsize);

if kk>=4
    slope1=(spmin(2,2)-spmin(3,2))/(spmin(2,1)-spmin(3,1));
    tmp1=slope1*(spmin(1,1)-spmin(2,1))+spmin(2,2);
    if tmp1<spmin(1,2)
        spmin(1,2)=tmp1;
    end

    slope2=(spmin(kk-1,2)-spmin(kk-2,2))/(spmin(kk-1,1)-spmin(kk-2,1));
    tmp2=slope2*(spmin(kk,1)-spmin(kk-1,1))+spmin(kk-1,2);
    if tmp2<spmin(kk,2)
        spmin(kk,2)=tmp2;
    end
else
    flag=-1;
end

flag=1;
3、
%function allmode=eemd(Y,Nstd,NE)
%
% This is an EMD/EEMD program
%
% INPUT:
%       Y: Inputted data;1-d data only
%       Nstd: ratio of the standard deviation of the added noise and that of Y;
%       NE: Ensemble number for the EEMD
% OUTPUT:
%       A matrix of N*(m+1) matrix, where N is the length of the input
%       data Y, and m=fix(log2(N))-1. Column 1 is the original data, columns 2, 3, ...
%       m are the IMFs from high to low frequency, and comlumn (m+1) is the
%       residual (over all trend).
%
% NOTE:
%       It should be noted that when Nstd is set to zero and NE is set to 1, the
%       program degenerates to a EMD program.(for EMD Nstd=0,NE=1)
%       This code limited sift number=10 ,the stoppage criteria can't change.
%
% References:
%  Wu, Z., and N. E Huang (2008),
%  Ensemble Empirical Mode Decomposition: a noise-assisted data analysis method.
%   Advances in Adaptive Data Analysis. Vol.1, No.1. 1-41.
%
% code writer: Zhaohua Wu.
% footnote:S.C.Su 2009/03/04
%
% There are three loops in this code coupled together.
%  1.read data, find out standard deviation ,devide all data by std
%  2.evaluate TNM as total IMF number--eq1.
%    TNM2=TNM+2,original data and residual included in TNM2
%    assign 0 to TNM2 matrix
%  3.Do EEMD NE times-------------------------------------------------------------loop EEMD start
%     4.add noise
%     5.give initial values before sift
%     6.start to find an IMF------------------------------------------------IMF loop start
%     7.sift 10 times to get IMF--------------------------sift loop  start  and end
%     8.after 10 times sift --we got IMF
%     9.subtract IMF from data ,and let the residual to find next IMF by loop
%     6.after having all the IMFs---------------------------------------------IMF loop end
%     9.after TNM IMFs ,the residual xend is over all trend
%  3.Sum up NE decomposition result-------------------------------------------------loop EEMD end
% 10.Devide EEMD summation by NE,std be multiply back to data
%
% Association: no
% this function ususally used for doing 1-D EEMD with fixed
% stoppage criteria independently.
%
% Concerned function: extrema.m
%                     above mentioned m file must be put together

function allmode=eemd(Y,Nstd,NE)

%part1.read data, find out standard deviation ,devide all data by std
xsize=length(Y);
dd=1:1:xsize;
Ystd=std(Y);
Y=Y/Ystd;

%part2.evaluate TNM as total IMF number,ssign 0 to TNM2 matrix
TNM=fix(log2(xsize))-1;
TNM2=TNM+2;
for kk=1:1:TNM2,
    for ii=1:1:xsize,
        allmode(ii,kk)=0.0;
    end
end

%part3 Do EEMD  -----EEMD loop start
for iii=1:1:NE,   %EEMD loop -NE times EMD sum together

    %part4 --Add noise to original data,we have X1
    for i=1:xsize,
        temp=randn(1,1)*Nstd;
        X1(i)=Y(i)+temp;
    end

    %part4 --assign original data in the first column
    for jj=1:1:xsize,
        mode(jj,1) = Y(jj);
    end

    %part5--give initial 0 to xorigin and xend
    xorigin = X1;
    xend = xorigin;

    %part6--start to find an IMF-----IMF loop start
    nmode = 1;
    while nmode <= TNM,
        xstart = xend; %last loop value assign to new iteration loop
                       %xstart -loop start data
        iter = 1;      %loop index initial value

        %part7--sift 10 times to get IMF---sift loop  start
        while iter<=10,
            [spmax, spmin, flag]=extrema(xstart);  %call function extrema
            %the usage of  spline ,please see part11.
            upper= spline(spmax(:,1),spmax(:,2),dd); %upper spline bound of this sift
            lower= spline(spmin(:,1),spmin(:,2),dd); %lower spline bound of this sift
            mean_ul = (upper + lower)/2;%spline mean of upper and lower
            xstart = xstart - mean_ul;%extract spline mean from Xstart
            iter = iter +1;
        end
        %part7--sift 10 times to get IMF---sift loop  end

        %part8--subtract IMF from data ,then let the residual xend to start to find next IMF
         xend = xend - xstart;

   	     nmode=nmode+1;

        %part9--after sift 10 times,that xstart is this time IMF
        for jj=1:1:xsize,
            mode(jj,nmode) = xstart(jj);
        end

    end
    %part6--start to find an IMF-----IMF loop end

    %part 10--after gotten  all(TNM) IMFs ,the residual xend is over all trend
    %                        put them in the last column
    for jj=1:1:xsize,
        mode(jj,nmode+1)=xend(jj);
    end
    %after part 10 ,original +TNM-IMF+overall trend  ---those are all in mode
     allmode=allmode+mode;

end
%part3 Do EEMD  -----EEMD loop end

%part10--devide EEMD summation by NE,std be multiply back to data
allmode=allmode/NE;
allmode=allmode*Ystd;

%part11--the syntax of the matlab function spline
%yy= spline(x,y,xx); this means
%x and y are matrixs of n1 points ,use n1 set (x,y) to form the cubic spline
%xx and yy are matrixs of n2 points,we want know the spline value yy(y-axis) in the xx (x-axis)position
%after the spline is formed by n1 points ,find coordinate value on the spline for [xx,yy] --n2 position.
IMF数据
IMF结果
如有需要代码和数据的同学请在评论区发邮箱,一般一天之内会回复,请点赞+关注谢谢!!