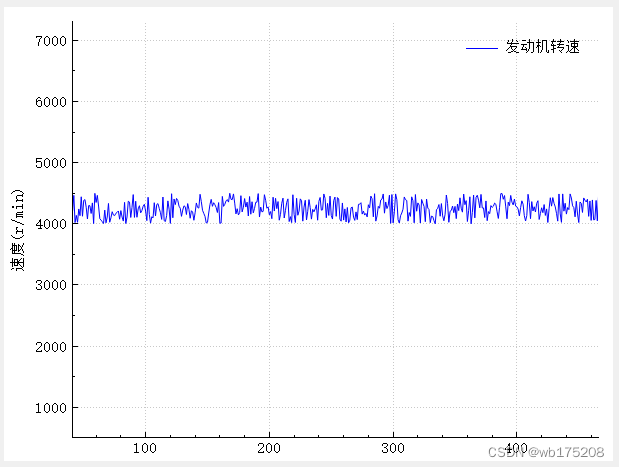
绘制曲线示例:
void SpeedCurePlot::init() {


	//1.设置可以拖动和缩放
	setInteractions(QCP::iRangeDrag | QCP::iRangeZoom);
	//2.设置坐标轴的范围
	xAxis->setRange(0, 500);
	yAxis->setRange(0, 8000);

	//6. 为坐标轴添加标签
	//xAxis->setLabel(QStringLiteral("时间"));
	yAxis->setLabel(QStringLiteral("速度(r/min)"));

	//3.设置X轴数据
	QVector<double> xData(500);
	for (int i = 0; i < 500; i += 1) {


		xData[i] = i;
	}

	//4.设置Y轴数据
	QTime randTime;
	randTime = QTime::currentTime();

	/*
	* 以当前时间ms为随机种子,如qsrand(10),产生[10,32767]之间的数据
	* qrand()返回0 到 RAND_MAX间的值。
	* 如果要返回0~n间的值,则为:qrand()%n;
	* 如果要返回a~b间的值,则为:a + qrand() % (b - a)
	*/
	qsrand(randTime.msec() + randTime.second() * 1000);
	QVector<double> yData(500);
	for (int i = 0; i < 500; i += 1) {


		int n = qrand() % 500 + 4000;
		yData[i] = n;
	}

	//5.添加曲线
	addGraph();

	//7.设置图例
	graph(0)->setName(QStringLiteral("发动机转速"));// 设置图例名称
	QPen pen;
	pen.setColor(QColor(255, 0, 0, 0));
	legend->setBorderPen(pen);

	//设置图表的画笔
	pen.setColor(QColor(0, 0, 255));
	graph(0)->setPen(pen);

	//8.添加数据
	graph(0)->setData(xData, yData);

	QBrush brush;
	legend->setBrush(brush);
	legend->setVisible(true); // 显示图例

	//9.重画图像
	replot();
}
aaa