该功能有点类似于Matlab数据游标的功能,博主本人并没有找到关于Qt自己封装的方法,因此在网上搜索资料,按照目前的方法,实现该功能。
在头文件里我们需要关注QCustomplot、QCPItemText、QCPItemTracer这三个类,后两个类是在QCustomplot类上开发的新组件,第一个类是我们需要用的绘图类,需要包含.h与.cpp文件,同时修改pro文件,就可以使用了,第二个类是用来显示我们文本坐标的,第三个类相当于一个锚点,用来定位我们点击的点。关于这写类的具体说明,官方有文档介绍,下面给我出一些引用,供各位参考。官方文档的说明如下:
QCustomPlot allows placing and anchoring of graphical elements such as text, arrows, lines, rectangles, arbitrary pixmaps etc. on the plot. They are based on the abstract base class QCPAbstractItem. A detailed description of the item mechanism and what built-in items are currently available can be found in the documentation of QCPAbstractItem.
QCustomPlot允许在绘图上放置和锚定图形元素,例如文本,箭头,线条,矩形,任意像素图等。它们基于抽象基类QCPAbstractItem。有关项目机制和当前可用的内置项目的详细说明,可以在QCPAbstractItem的文档中找到。
头文件
我们继承了一个QWidget的子类,并在私有上文提到过的几个实例,然后用到了,QCustomplot的绘图需要用到的QVctor,这里注意,这里的Vector必须是用dobule存放的。其中,我们申明了两个槽函数,一个是用来接收绘图数据的,一个是用来响应鼠标点击的响应事件。
#ifndef CHARTWIDGET_H
#define CHARTWIDGET_H

#include <QWidget>
#include <QGroupBox>
#include <QGridLayout>


class ChartWidget : public QWidget
{
    Q_OBJECT
public:
    ChartWidget(QWidget *parent = 0);
    ~ChartWidget();
private slots:
    void SLOT_PlotData(char *,uint16_t);
    void SLOT_mouseTracetoCoord(QMouseEvent *event);//鼠标按下触发的槽函数,后面解释

private:
    QCustomPlot *m_RcustomPlot = nullptr;

    QCPItemText *m_currentLabel;//显示坐标的文本框
    QCPItemTracer *m_tracer;//锚点的一个标记

    QVector<double> m_VData;//存放数据
    QVector<double> m_DataSize;//存放数据的下标
};
cpp文件
我们在构造函数里对我们的成员进行配置,这里我们新建了一个GroupBox,将我们的QCustomplot放入了这个Box中,并且对于两个小部件进行属性配置。
ChartWidget::ChartWidget(QWidget *parent):QWidget(parent)
{
    m_RcustomPlot = new QCustomPlot();
    m_RcustomPlot->addGraph();
    m_RcustomPlot->graph(0)->setPen(QPen(Qt::blue));//实部

    //自动设置显示界面的范围
    m_RcustomPlot->graph(0)->rescaleAxes();
    //设置绘制输出图像界面缩放
    m_RcustomPlot->setInteractions(QCP::iRangeDrag | QCP::iRangeZoom );

    //x轴参数配置
    m_RcustomPlot->xAxis->setBasePen(QPen(Qt::black));  //基础线
    m_RcustomPlot->xAxis->setTickPen(QPen(Qt::black));  //刻度
    m_RcustomPlot->xAxis->grid()->setVisible(true);  //网格线可见
    m_RcustomPlot->xAxis->grid()->setPen(QPen(QColor(130, 130, 130), 0, Qt::DotLine)); //网格线颜色及线样式
    m_RcustomPlot->xAxis->setTickLabelColor(Qt::black);    //x轴刻度线文字颜色
    m_RcustomPlot->xAxis->setLabelColor(Qt::black);    //x轴标签颜色
    m_RcustomPlot->xAxis->setLabel("距离门");    //x轴标签值

    //y轴参数配置
    m_RcustomPlot->yAxis->setBasePen(QPen(Qt::black));
    m_RcustomPlot->yAxis->setTickPen(QPen(Qt::black));
    m_RcustomPlot->yAxis->grid()->setVisible(true);
    m_RcustomPlot->yAxis->grid()->setPen(QPen(QColor(130, 130, 130), 0, Qt::DotLine));
    m_RcustomPlot->yAxis->setTickLabelColor(Qt::black);
    m_RcustomPlot->yAxis->setLabelColor(Qt::black);
    m_RcustomPlot->yAxis->setLabel("信号幅值");

    QGroupBox *gbox_Real = new QGroupBox();//将实例化好的QCustomplot放入QGroupbox中
    gbox_Real->setStyleSheet("background:white");//设置背景色

    QVBoxLayout *gbox_Real_layout = new QVBoxLayout();//构建布局
    gbox_Real->setLayout(gbox_Real_layout);
    gbox_Real_layout->addWidget(m_RcustomPlot);

    connect(this->m_RcustomPlot,SIGNAL(mousePress(QMouseEvent *)),this,SLOT(SLOT_mouseTracetoCoord(QMouseEvent *)));

    //小部件的属性配置
    m_tracer = new QCPItemTracer(this->m_RcustomPlot);//设置部件的父类
    m_tracer->setStyle(QCPItemTracer::tsCircle);//锚点的类型设置为圆形
    m_tracer->setPen(QPen(Qt::red, 1, Qt::DashLine));//画笔类型
    m_tracer->setBrush(Qt::NoBrush);

    m_currentLabel = new QCPItemText(this->m_RcustomPlot);//文本框父类设置
    m_currentLabel->setLayer("overlay");
    m_currentLabel->setClipToAxisRect(false);
    m_currentLabel->setPadding(QMargins(3,3,3,3));
    m_currentLabel->setPen(QPen(QColor(130, 130, 130), 0, Qt::DotLine));
    m_currentLabel->setBrush(Qt::NoBrush);
    m_currentLabel->position->setParentAnchor(m_tracerR->position);//显示位置跟随锚点的位置
    m_currentLabel->setFont(QFont("Arial",8));
    m_currentLabel->setColor(Qt::red);


    m_tracer->position->setTypeX(QCPItemPosition::ptPlotCoords);//在曲线上显示
    m_tracer->position->setTypeY(QCPItemPosition::ptPlotCoords);
    m_tracer->setSize(5);

    m_currentLabel->setPositionAlignment(Qt::AlignLeft | Qt::AlignVCenter);

    m_currentLabel->setVisible(false);
    m_tracer->setVisible(false);
}
这里是整个代码段核心的地方,这里的这个槽函数,上文提到过是用来响应鼠标点击事件,这里对获取到的鼠标坐标进行转换,转换为该customplot对应的x轴、y轴坐标值。
因为我的数据是离散的点,我需要对这些离散点的幅值进行观察,因此鼠标点击后的坐标,我会对其先做一次判断,看该值与我数据中的x、y值差值如果足够小,我便认为已经选到了数据集中的数据点,然后我便选择对该点进行文本显示。
由于我们会对customplot这个页面,进行放大以及缩小操作,由于前面的配置,这里的xy轴应该会随着变化,因此坐标轴的显示范围也会跟着变化,为了能更好自适应的我们的功能,因此我会先获取到x,y轴的范围,除以一个我试出来的比例系数,从而避免鼠标点击该点,但显示错点的问题。
文中还有一个利用Qtooltip的简单实现,该实现每次显示的时间我不好控制,因此没有使用。
做完以上操作后,一定要记得replot函数的调用,只有调用该句,才会将你刚才的代码里的内容进行重绘,并显示出来。
void ChartWidget::SLOT_mouseTracetoCoord(QMouseEvent *event)
{
    //获取鼠标坐标点
    QPointF ChickedPoint = event->pos();
    m_currentLabel->setVisible(false);
    m_tracer->setVisible(false);
    //排除区间外点
    if(this->m_RcustomPlot->viewport().contains(event->pos()))
    {
        //鼠标点击的后位置转换到下坐标轴对应坐标
        int16_t current_Rx = this->m_RcustomPlot->xAxis->pixelToCoord(ChickedPoint.x());
        int16_t current_Ry = this->m_RcustomPlot->yAxis->pixelToCoord(ChickedPoint.y());

        //获取实部y轴的显示范围
        double y_range = (this->m_RcustomPlot->yAxis->range().size()) / 100;
        double x_range = (this->m_RcustomPlot->xAxis->range().size()) / 50;

        if(!m_VDataReal.empty())
        {
            for(int i = 0; i != m_VDataReal.size(); i++)//对我的数据集进行遍历
            {
                if((abs(current_Ry - m_VDataReal.at(i)) <= y_range) && (abs(current_Rx - m_DataSize.at(i)) <= x_range))
                {
                    //QToolTip输出值
#if 0  //value值观察实现的简易版本 鼠标箭头容易遮挡住label
                    QToolTip::showText(mapToGlobal(event->pos()),QString("%1 ,%2 ").arg(current_x).arg(current_y),this/*,QRectF(QPointF(15,15),QPointF(15,15))*/);
#else
                    m_currentLabel->setVisible(true);
                    m_tracer->setVisible(true);
                    this->m_tracer->position->setCoords(m_DataSize.at(i),m_VDataReal.at(i));
                    this->m_currentLabel->position->setCoords(0,-10);//对标签绘图位置进行向上偏移
                    this->m_currentLabel->setText(QString("%1 ,%2 ").arg(current_Rx).arg(current_Ry));

                    break;
#endif
                }

            }
            this->m_RcustomPlot->replot();
        }
    }

    else return;

}
最后
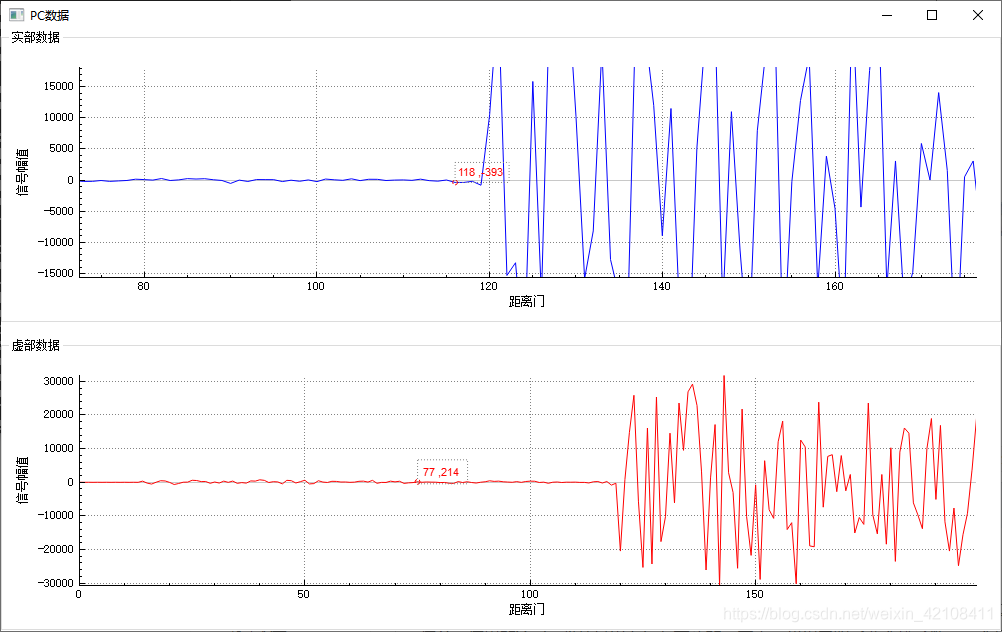
我们看下效果图,该代码是我从项目中抽取的一部分,可能不能直接编译,这里提供一个思路,以后有时间了,再改成可执行的代码吧。图中的红点就是我们的锚点,虚线框就是我们的文本框

