1、QCustomPlot介绍
QCustomPlot是一个小型的Qt画图标类,支持绘制静态曲线、动态曲线、多重坐标曲线,柱状图,蜡烛图等。只需要在项目中加入头文件qcustomplot.h和qcustomplot.cpp文件,然后使一个widget提升为QCustomPlot类,即可使用。
QCustomPlot官网:
http://www.qcustomplot.com/
例子与说明:
https://www.qcustomplot.com/index.php/tutorials/basicplotting
1
QCustomPlot下载地址:
http://www.qcustomplot.com/index.php/download
1
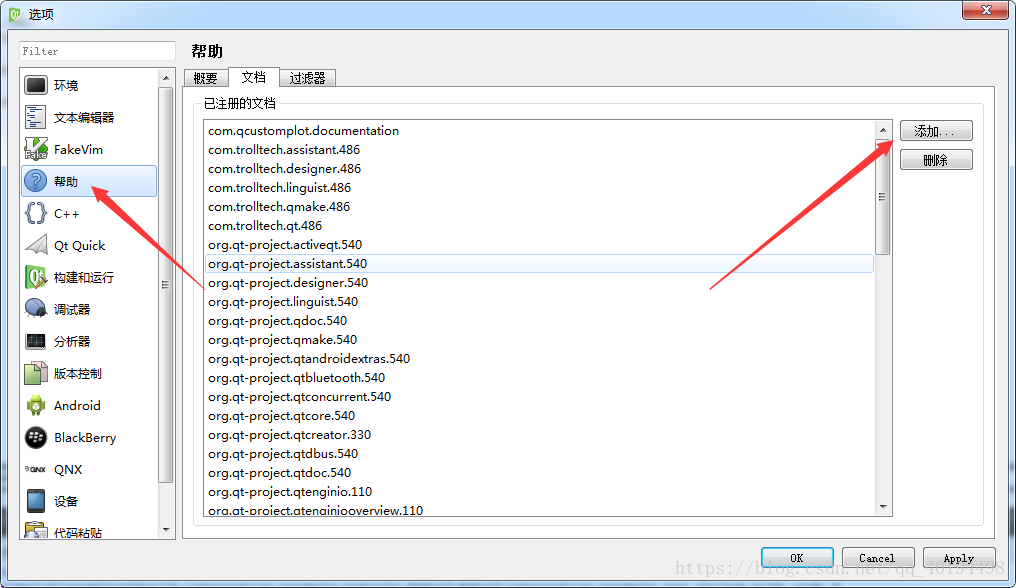
QCustomPlot帮助文件
QCustomPlot源码包中,有QCustomPlot帮助文件,将其添加进Qt帮助文件,如图,点击添加按钮,在下载的QCustomPlot源码包中找到qch为后缀的文件进行添加。
2、简单例子详解:
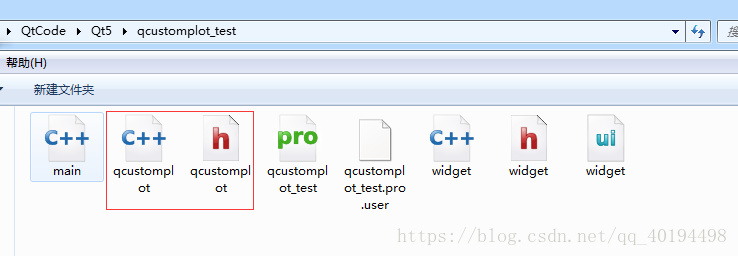
建立Qt工程,将下载的QCustomPlot源码中的qcustomplot.h和qcustomplot.cpp文件复制到项目所在文件夹,如图
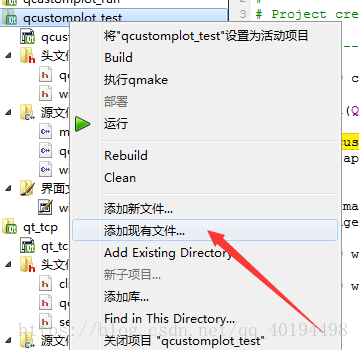
QtCreater中,右键项目,添加现有文件,如图,选择qcustomplot.h和qcustomplot.cpp添加:
在UI界面拖入一个widget,如图
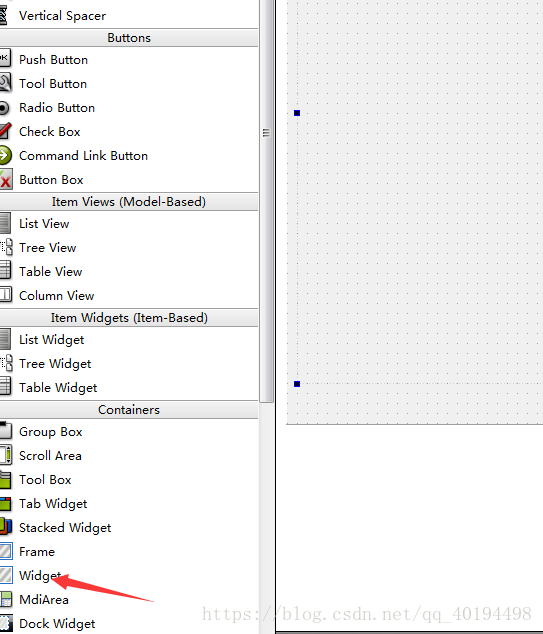
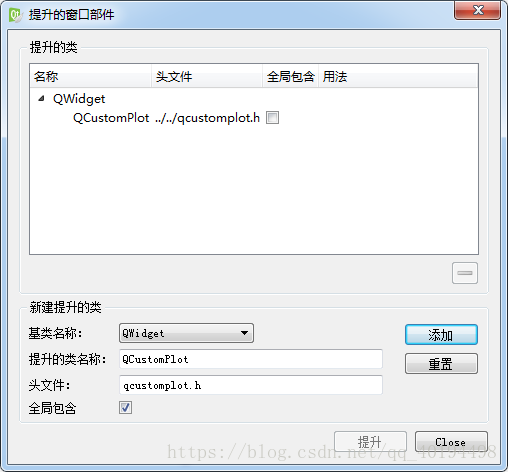
UI界面右键widget,点击提升为,选择全局包含,如图
这里强调一下:Qt提升控件时,通常提升的类名称中,每个单词的首字母必须大写【与Qt控件命名规则保持一致,各种第三方控件都采用这种命名格式】,否则无法识别,如这里必须写成QCustomPlot而不能写成Qcustomplot或qcustomplot
另一种简单方法是将被提升类的名称直接复制过来粘贴。
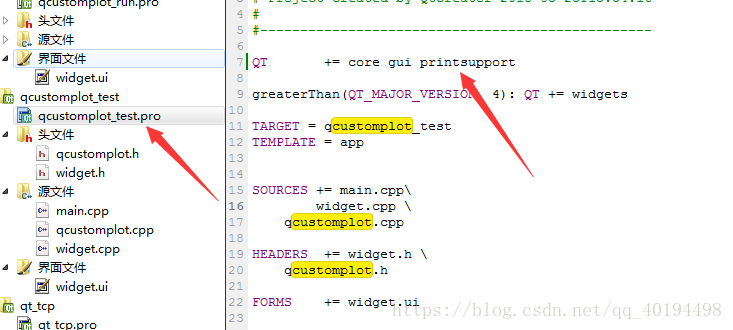
选择项目的.pro文件,添加printsupport,如图,QCustomPlot包含了一些打印的东西,如果没有这一步,程序会报错
-
最后一步,编写代码:
头文件:
#ifndef WIDGET_H
#define WIDGET_H
#include <QWidget>
#include "qcustomplot.h"
namespace Ui {
class Widget;
}
class Widget : public QWidget
{
Q_OBJECT
public:
explicit Widget(QWidget *parent = 0);
~Widget();
private:
Ui::Widget *ui;
};
#endif // WIDGET_H
cpp文件:
#include "widget.h"
#include "ui_widget.h"
#include <QVector>
Widget::Widget(QWidget *parent) :
QWidget(parent),
ui(new Ui::Widget)
{
ui->setupUi(this);
//设定背景为黑色
//ui->widget->setBackground(QBrush(Qt::black));
//设定右上角图形标注可见
ui->widget->legend->setVisible(true);
//设定右上角图形标注的字体
ui->widget->legend->setFont(QFont("Helvetica", 9));
QVector<double> x(101),y(101);
//图形为y=x^3
for(int i=0;i<101;i++)
{
x[i] = i/5.0-10;
y[i] = x[i]*x[i]*x[i];//qPow(x[i],3)
}
//添加图形
ui->widget->addGraph();
//设置画笔
ui->widget->graph(0)->setPen(QPen(Qt::blue));
//设置画刷,曲线和X轴围成面积的颜色
ui->widget->graph(0)->setBrush(QBrush(QColor(255,255,0)));
//设置右上角图形标注名称
ui->widget->graph(0)->setName("曲线");
//传入数据,setData的两个参数类型为double
ui->widget->graph(0)->setData(x,y);
QVector<double> temp(20);
QVector<double> temp1(20);
//图形为y = 100*x;
for(int i=0;i<20;i++)
{
temp[i] = i;
temp1[i] = 10*i+10;
}
//添加图形
ui->widget->addGraph();
//设置画笔
ui->widget->graph(1)->setPen(QPen(Qt::red));
//设置画刷,曲线和X轴围成面积的颜色
//ui->widget->graph(1)->setBrush(QBrush(QColor(0,255,0)));
//传入数据
ui->widget->graph(1)->setData(temp,temp1);
/*-------------------------------------------*/
//画动态曲线时,传入数据采用addData,通过定时器多次调用,并在之后调用ui->widget->replot();
//动态曲线可以通过另一种设置坐标的方法解决坐标问题:
//setRange ( double position, double size, Qt::AlignmentFlag alignment )
//参数分别为:原点,偏移量,对其方式,有兴趣的读者可自行尝试,欢迎垂询
/*-------------------------------------------*/
//设置右上角图形标注名称
ui->widget->graph(1)->setName("直线");
//设置X轴文字标注
ui->widget->xAxis->setLabel("time");
//设置Y轴文字标注
ui->widget->yAxis->setLabel("temp/shidu");
//设置X轴坐标范围
ui->widget->xAxis->setRange(-20,20);
//设置Y轴坐标范围
ui->widget->yAxis->setRange(-1100,1100);
//在坐标轴右侧和上方画线,和X/Y轴一起形成一个矩形
ui->widget->axisRect()->setupFullAxesBox();
}
Widget::~Widget()
{
delete ui;
}
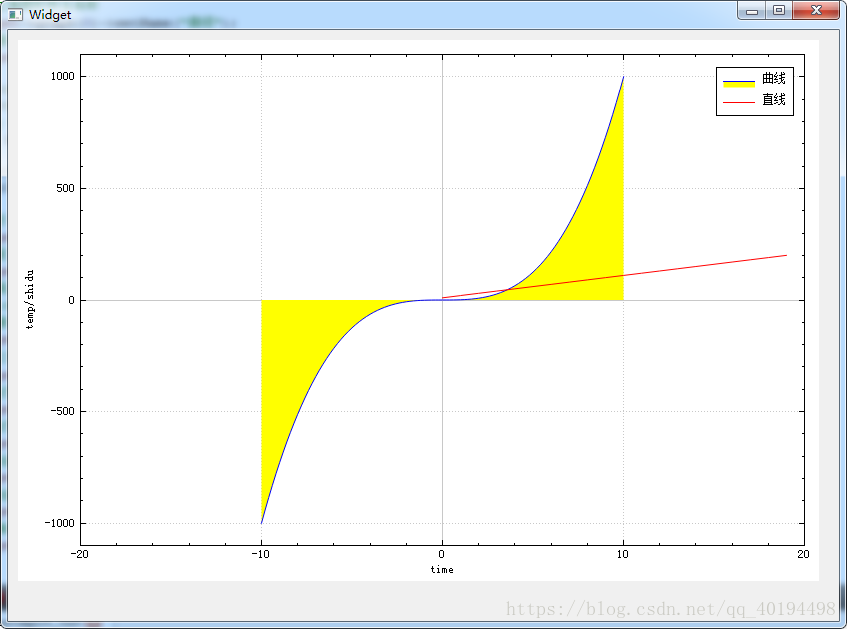
效果如图:
---------------------
原文:https://blog.csdn.net/qq_40194498/article/details/79666903