目录
6.1修改每个 API Server 的 kube-apiserver.yaml 配置开启 Aggregator Routing
7.2修改cluster-configuration集群配置
7.3安装kubesphere并配置kubesphere(注意运行顺序)
八: 解决Prometheus监控etcd找不到Secret的问题
一:KubeSphere概述

官网地址:https://kubesphere.com.cn/
KubeSphere 是在目前主流容器调度平台 Kubernetes 之上构建的企业级分布式多租户容器平台,提供简单易用的操作界面以及向导式操作方式,在降低用户使用容器调度平台学习成本的同时,极大减轻开发、测试、运维的日常工作的复杂度,旨在解决 Kubernetes 本身存在的存储、网络、安全和易用性等痛点。除此之外,平台已经整合并优化了多个适用于容器场景的功能模块,以完整的解决方案帮助企业轻松应对敏捷开发与自动化运维、微服务治理、多租户管理、工作负载和集群管理、服务与网络管理、应用编排与管理、镜像仓库管理和存储管理等业务场景。
1、KubeSphere是打造一个以Kubernetes为内核的云原生分布式操作系统。它的架构可以非常方便地使第三方应用与云原生生态组件进行即插即用(plug-and-play)的集成,支持云原生应用在多云与多集群的统一分发和运维管理。
2、KubeSphere是个全栈的Kubernetes容器云PaaS解决方案
3、KubeSphere 是在 Kubernetes 之上构建的以应用为中心的多租户容器平台,提供全栈的 IT 自动化运维的能力,简化企业的 DevOps 工作流。KubeSphere 提供了运维友好的向导式操作界面,帮助企业快速构建一个强大和功能丰富的容器云平台。
二:为什么选择 KubeSphere ?
KubeSphere 为企业用户提供高性能可伸缩的容器应用管理服务,旨在帮助企业完成新一代互联网技术驱动下的数字化转型,加速业务的快速迭代与交付,以满足企业日新月异的业务需求。
2.1KubeSphere优势
通过 KubeSphere 可以快速管理 Kubernetes 集群、部署应用、服务发现、CI/CD 流水线、集群扩容、微服务治理、日志查询和监控告警。换句话说,Kubernetes 是一个很棒的开源项目(或被认为是一个框架),但是 KubeSphere 是一款非常专业的企业级平台产品,专注于解决用户在复杂业务场景中的痛点,提供更友好更专业的用户体验。
2.2极简体验,向导式 UI
- 面向开发、测试、运维友好的用户界面,向导式用户体验,降低 Kubernetes 学习成本的设计理念
- 用户基于应用模板可以一键部署一个完整应用的所有服务,UI 提供全生命周期管理
2.3业务高可靠与高可用
- 自动弹性伸缩:部署 (Deployment) 支持根据访问量进行动态横向伸缩和容器资源的弹性扩缩容,保证集群和容器资源的高可用
- 提供健康检查:支持为容器设置健康检查探针来检查容器的健康状态,确保业务的可靠性
2.4容器化 DevOps 持续交付
- 简单易用的 DevOps:基于 Jenkins 的可视化 CI/CD 流水线编辑,无需对 Jenkins 进行配置,同时内置丰富的 CI/CD 流水线模版
- Source to Image (s2i):从已有的代码仓库中获取代码,并通过 s2i 自动构建镜像完成应用部署并自动推送至镜像仓库,无需编写 Dockerfile
- 端到端的流水线设置:支持从仓库 (GitHub / SVN / Git)、代码编译、镜像制作、镜像安全、推送仓库、版本发布、到定时构建的端到端流水线设置
- 安全管理:支持代码静态分析扫描以对 DevOps 工程中代码质量进行安全管理
- 日志:日志完整记录 CI / CD 流水线运行全过程
2.5开箱即用的微服务治理
- 灵活的微服务框架:基于 Istio 微服务框架提供可视化的微服务治理功能,将 Kubernetes 的服务进行更细粒度的拆分,支持无侵入的微服务治理
- 完善的治理功能:支持灰度发布、熔断、流量监测、流量管控、限流、链路追踪、智能路由等完善的微服务治理功能
2.5.1灵活的持久化存储方案
- 支持 GlusterFS、CephRBD、NFS 等开源存储方案,支持有状态存储
- NeonSAN CSI 插件对接 QingStor NeonSAN,以更低时延、更加弹性、更高性能的存储,满足核心业务需求
- QingCloud CSI 插件对接 QingCloud 云平台各种性能的块存储服务
2.5.2灵活的网络方案支持
- 支持 Calico、Flannel 等开源网络方案
- 分别开发了 QingCloud 云平台负载均衡器插件 和适用于物理机部署 Kubernetes 的 负载均衡器插件 Porter
- 商业验证的 SDN 能力:可通过 QingCloud CNI 插件对接 QingCloud SDN,获得更安全、更高性能的网络支持
2.6多维度监控日志告警
- KubeSphere 全监控运维功能可通过可视化界面操作,同时,开放标准接口对接企业运维系统,以统一运维入口实现集中化运维
- 可视化秒级监控:秒级频率、双重维度、十六项指标立体化监控;提供服务组件监控,快速定位组件故障
- 提供按节点、企业空间、项目等资源用量排行
- 支持基于多租户、多维度的监控指标告警,目前告警策略支持集群节点级别和工作负载级别等两个层级
- 提供多租户日志管理,在 KubeSphere 的日志查询系统中,不同的租户只能看到属于自己的日志信息
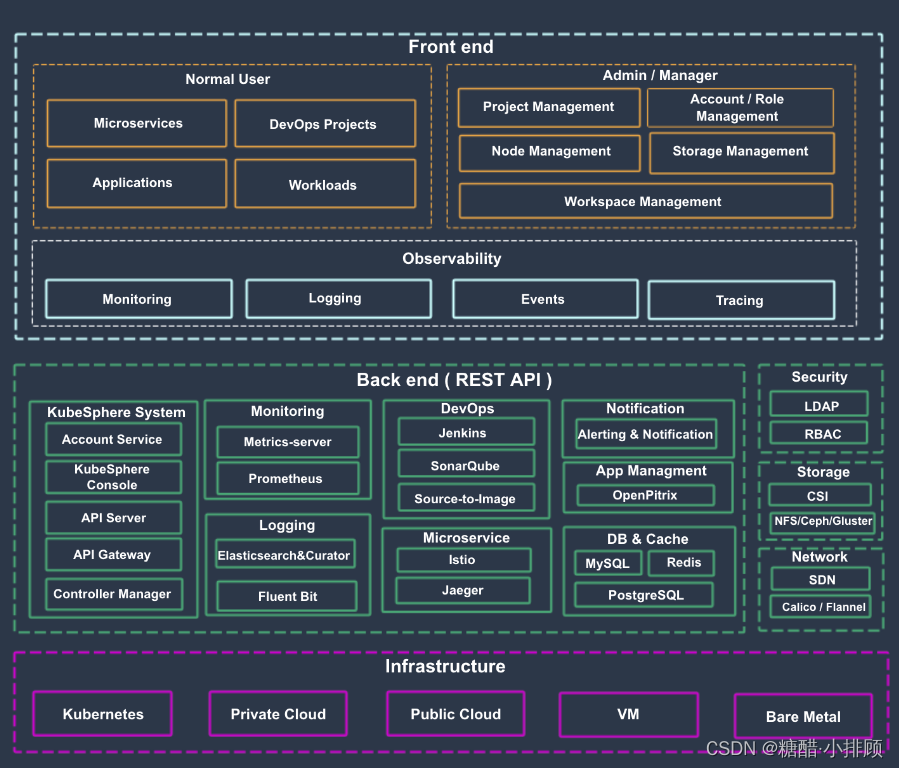
三:KubeSphere架构说明
KubeSphere 采用了前后端分离的架构,实现了面向云原生的设计,后端的各个功能组件可通过 REST API 对接外部系统,可参考 API 文档。KubeSphere 无底层的基础设施依赖,可以运行在任何 Kubernetes、私有云、公有云、VM 或物理环境(BM)之上。
| 后端组件 | 功能说明 |
| ks-account | 提供用户、权限管理相关的 API |
| ks-apiserver | 整个集群管理的 API 接口和集群内部各个模块之间通信的枢纽,以及集群安全控制 |
| ks-apigateway | 负责处理服务请求和处理 API 调用过程中的所有任务 |
| ks-console | 提供 KubeSphere 的控制台服务 |
| ks-controller-manager | 实现业务逻辑的,例如创建企业空间时,为其创建对应的权限;或创建服务策略时,生成对应的 Istio 配置等 |
| Metrics-server | Kubernetes 的监控组件,从每个节点的 Kubelet 采集指标信息 |
| Prometheus | 提供集群、节点、工作负载、API 对象等相关监控数据与服务 |
| Elasticsearch | 提供集群的日志索引、查询、数据管理等服务,在安装时也可对接您已有的 ES 减少资源消耗 |
| Fluent Bit | 提供日志接收与转发,可将采集到的⽇志信息发送到 ElasticSearch、Kafka |
| Jenkins | 提供 CI/CD 流水线服务 |
| SonarQube | 可选安装项,提供代码静态检查与质量分析 |
| Source-to-Image | 将源代码自动将编译并打包成 Docker 镜像,方便快速构建镜像 |
| Istio | 提供微服务治理与流量管控,如灰度发布、金丝雀发布、熔断、流量镜像等 |
| Jaeger | 收集 Sidecar 数据,提供分布式 Tracing 服务 |
| OpenPitrix | 提供应用模板、应用部署与管理的服务 |
| Alert | 提供集群、Workload、Pod、容器级别的自定义告警服务 |
| Notification | 通用的通知服务,目前支持邮件通知 |
| redis | 将 ks-console 与 ks-account 的数据存储在内存中的存储系统 |
| MySQL | 集群后端组件的数据库,监控、告警、DevOps、OpenPitrix 共用 MySQL 服务 |
| PostgreSQL | SonarQube 和 Harbor 的后端数据库 |
| OpenLDAP | 负责集中存储和管理用户账号信息与对接外部的 LDAP |
| 存储 | 内置 CSI 插件对接云平台存储服务,可选安装开源的 NFS/Ceph/Gluster 的客户端 |
| 网络 | 可选安装 Calico/Flannel 等开源的网络插件,支持对接云平台 SDN |
四:kubesphere所用端口
| 服务 | 类型 | 端口 |
| ssh | TCP | 22 |
| etcd | TCP | 2379,2380 |
| apiserver | TCP | 6443 |
| calico | TCP | 9099,9100 |
| bgp | TCP | 179 |
| nodeport | TCP | 30000-32767 |
| master | TCP | 10250-10258 |
| dns | TCP | 53 |
| dns | UDP | 53 |
| dns | UDP | 53 |
| local-registry | TCP | 5000 |
| local-apt | TCP | 5080 |
| rpcbind | TCP | 111 |
五:Kubesphere安装步骤
5.1安装KubeSphere(v3.1.1)
安装KubeSphere最好的方法就是参考官方文档,而且官方文档是中文的。
官网地址:https://kubesphere.com.cn/
5.2安装环境说明
- Kubernetes:V1.20.9(1.17.x,1.18.x,1.19.x,1.20.x),注意:如果安装3.1.x版本,K8S不能大于1.20.x版本
- Docker:20.10.7
- 服务器配置: 使用华为云ECS弹性云服务器
- k8s-master 4VCPU+8G
- node1 8VCPU+16G
- node2 8VCPU+16G
我上面的配置是针对所有插件都选用了,也就是说如果你开启了DevOps,Service Mesh,警告…等所有功能,就需要如上配置。如果你就最小化安装KubeSphere应该每个节点2VCPU+2G即可。
CentOS7.9
前提:
具备好一个最基本Kubernetes平台。
注:如果没有安装kubernetes平台请参考文档:
https://blog.csdn.net/weixin_59663288/article/details/125994307?spm=1001.2014.3001.5502
如果使用v1.20.9版本的话,使用就参考雷神老师的文档和镜像仓库:
https://www.yuque.com/leifengyang/oncloud/gz1sls
5.3安装并配置NFS存储
根据官方文档要求,在安装,KubeSphere之前,Kubernetes平台上需要有个默认的StorageClass类资源,也就是默认存储,提到StorageClass类资源,我们就要想到PV,PVC,这里的StorageClass类资源不再是传统的手动创建PV,PVC了,而是采用动态的方式绑定存储,比如:我写个PVC文件,底层会自动匹配相应的PV(如果没有对应的PV,则自动创建)。但是这一切的前提都需要有个存储,因此我们用NFS来实现。
这里以master节点为NFS服务器
5.3.1安装nfs-server(所有节点的操作)
yum install -y nfs-utils
5.3.2授权存储目录(master)
echo "/nfs/data/ *(insecure,rw,sync,no_root_squash)" > /etc/exports
5.3.3执行以下命令,启动 nfs 服务,创建共享目录
mkdir -p /nfs/data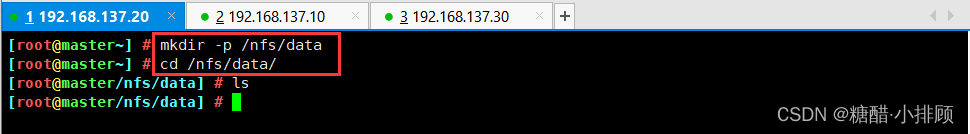
5.3.4在master节点执行
systemctl enable rpcbind
systemctl enable nfs-server
systemctl start rpcbind
systemctl start nfs-server
5.3.5使配置生效并查看
exportfs -r
exportfs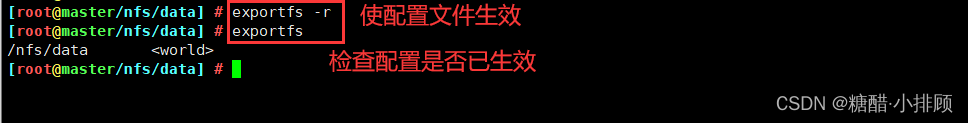
5.3.6在客户端进行测试
showmount -e 192.168.137.20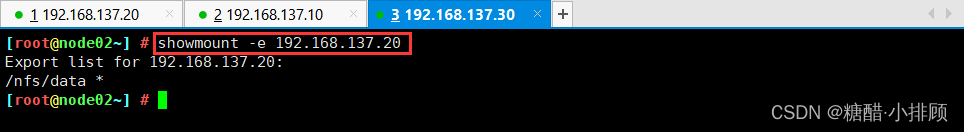
5.4配置默认存储
(1)上面说到我们是采用StorageClass抽象来动态创建PV,但是使用StorageClass有个前提,就是需要个存储分配器。StorageClass是通过存储分配器(provisioner)来分配PV的,但是Kubernetes官方内置的分配器并不支持NFS,所以需要额外安装NFS存储分配器。它以deployment运行。也就是说我们需要创建个deployment。
(2)由于存储分配器在Kubernetes集群内部,存储分配器想要操控NFS分配空间,就需要和API Server交互,这属于集群内部Pod和API Server交互,因此我们还需要创建个ServiceAccount,然后在创建存储类(StorageClass),之后创建ClusterRole,ClusterRoleBinding,Role,RoleBinding等账号权限配置
以上就是我们配置默认存储所执行的步骤:创建StorageClass资源,创建ServiceAccount资源,创建deployment资源,创建ClusterRole,ClusterRoleBinding,Role,RoleBinding等权限资源。
5.5执行如下yaml文件
vim sc.yaml 下面来逐行介绍:
## 创建了一个存储类
apiVersion: storage.k8s.io/v1
kind: StorageClass                  #存储类的资源名称
metadata:
  name: nfs-storage                 #存储类的名称,自定义
  annotations:
    storageclass.kubernetes.io/is-default-class: "true"          #注解,是否是默认的存储,注意:KubeSphere默认就需要个默认存储,因此这里注解要设置为“默认”的存储系统,表示为"true",代表默认。
provisioner: k8s-sigs.io/nfs-subdir-external-provisioner         #存储分配器的名字,自定义
parameters:
  archiveOnDelete: "true"  ## 删除pv的时候,pv的内容是否要备份

---
apiVersion: apps/v1
kind: Deployment
metadata:
  name: nfs-client-provisioner
  labels:
    app: nfs-client-provisioner
  # replace with namespace where provisioner is deployed
  namespace: default
spec:
  replicas: 1                 #只运行一个副本应用
  strategy:                   #描述了如何用新的POD替换现有的POD
    type: Recreate            #Recreate表示重新创建Pod
  selector:        #选择后端Pod
    matchLabels:
      app: nfs-client-provisioner
  template:
    metadata:
      labels:
        app: nfs-client-provisioner
    spec:
      serviceAccountName: nfs-client-provisioner          #创建账户
      containers:
        - name: nfs-client-provisioner
          image: registry.cn-hangzhou.aliyuncs.com/lfy_k8s_images/nfs-subdir-external-provisioner:v4.0.2      #使用NFS存储分配器的镜像
          # resources:
          #    limits:
          #      cpu: 10m
          #    requests:
          #      cpu: 10m
          volumeMounts:
            - name: nfs-client-root           #定义个存储卷,
              mountPath: /persistentvolumes   #表示挂载容器内部的路径
          env:
            - name: PROVISIONER_NAME          #定义存储分配器的名称
              value: k8s-sigs.io/nfs-subdir-external-provisioner         #需要和上面定义的保持名称一致
            - name: NFS_SERVER                                       #指定NFS服务器的地址,你需要改成你的NFS服务器的IP地址
              value: 192.168.137.20 ## 指定自己nfs服务器地址
            - name: NFS_PATH
              value: /nfs/data  ## nfs服务器共享的目录            #指定NFS服务器共享的目录
      volumes:
        - name: nfs-client-root           #存储卷的名称,和前面定义的保持一致
          nfs:
            server: 192.168.137.20            #NFS服务器的地址,和上面保持一致,这里需要改为你的IP地址
            path: /nfs/data               #NFS共享的存储目录,和上面保持一致
---
apiVersion: v1
kind: ServiceAccount                 #创建个SA账号
metadata:
  name: nfs-client-provisioner        #和上面的SA账号保持一致
  # replace with namespace where provisioner is deployed
  namespace: default
---
#以下就是ClusterRole,ClusterRoleBinding,Role,RoleBinding都是权限绑定配置,不在解释。直接复制即可。
kind: ClusterRole
apiVersion: rbac.authorization.k8s.io/v1
metadata:
  name: nfs-client-provisioner-runner
rules:
  - apiGroups: [""]
    resources: ["nodes"]
    verbs: ["get", "list", "watch"]
  - apiGroups: [""]
    resources: ["persistentvolumes"]
    verbs: ["get", "list", "watch", "create", "delete"]
  - apiGroups: [""]
    resources: ["persistentvolumeclaims"]
    verbs: ["get", "list", "watch", "update"]
  - apiGroups: ["storage.k8s.io"]
    resources: ["storageclasses"]
    verbs: ["get", "list", "watch"]
  - apiGroups: [""]
    resources: ["events"]
    verbs: ["create", "update", "patch"]
---
kind: ClusterRoleBinding
apiVersion: rbac.authorization.k8s.io/v1
metadata:
  name: run-nfs-client-provisioner
subjects:
  - kind: ServiceAccount
    name: nfs-client-provisioner
    # replace with namespace where provisioner is deployed
    namespace: default
roleRef:
  kind: ClusterRole
  name: nfs-client-provisioner-runner
  apiGroup: rbac.authorization.k8s.io
---
kind: Role
apiVersion: rbac.authorization.k8s.io/v1
metadata:
  name: leader-locking-nfs-client-provisioner
  # replace with namespace where provisioner is deployed
  namespace: default
rules:
  - apiGroups: [""]
    resources: ["endpoints"]
    verbs: ["get", "list", "watch", "create", "update", "patch"]
---
kind: RoleBinding
apiVersion: rbac.authorization.k8s.io/v1
metadata:
  name: leader-locking-nfs-client-provisioner
  # replace with namespace where provisioner is deployed
  namespace: default
subjects:
  - kind: ServiceAccount
    name: nfs-client-provisioner
    # replace with namespace where provisioner is deployed
    namespace: default
roleRef:
  kind: Role
  name: leader-locking-nfs-client-provisioner
  apiGroup: rbac.authorization.k8s.io
以上文件,只需要改动两个部分:就是把两处的IP地址,改为自己的NFS服务器的IP地址,即可。


5.6apply此Yaml文件,创建默认存储
kubectl apply -f sc.yaml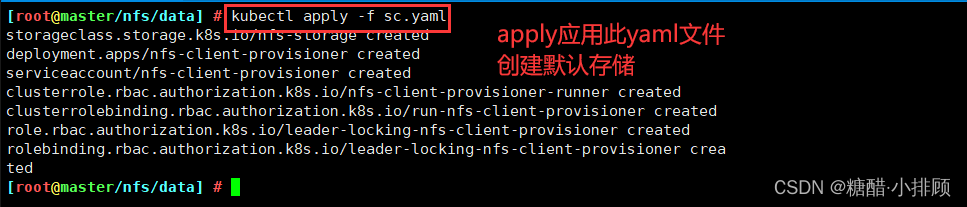
5.7查看SC
[root@master ~]# kubectl get sc
NAME                    PROVISIONER                                   RECLAIMPOLICY   VOLUMEBINDINGMODE   ALLOWVOLUMEEXPANSION   AGE
nfs-storage (default)   k8s-sigs.io/nfs-subdir-external-provisioner   Delete          Immediate           false                  10h

5.8查看Pod,其否正常启动
等到两分钟,如果还是Running,那说明一切正常
[root@master ~]# kubectl get pods -A
NAMESPACE              NAME                                         READY   STATUS      RESTARTS        AGE
default                nfs-client-provisioner-65878c6456-hsxqf      1/1     Running     1 (35m ago)     10h

5.9验证StorageClass存储类的效果
说明:上面说到采用StorageClass的方法,可以动态生成PV,上面我们已经创建好了StorageClass【存储类】,下面我们在没有任何PV的情况下来创建个PVC,看看PVC是否能立即绑定到PV。如果能就说明成功自动创建了PV,并进行了绑定。
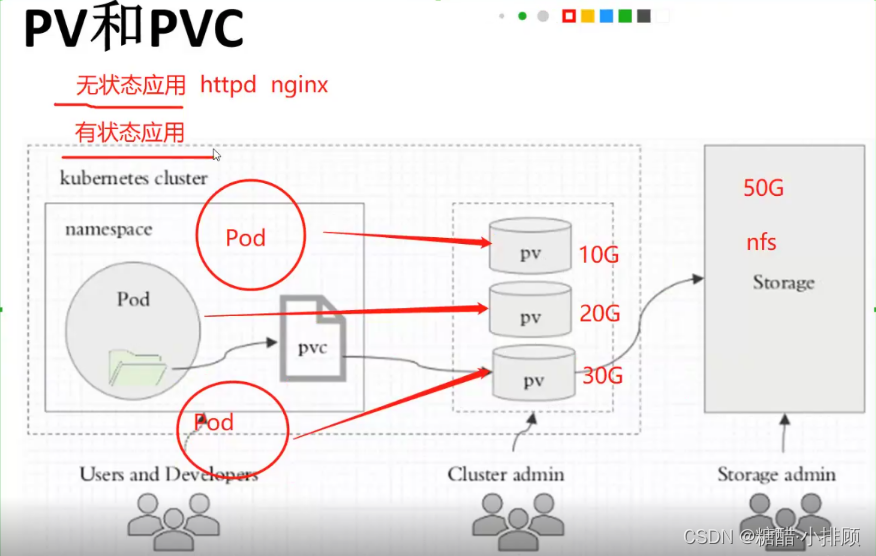
PV全称叫做 Persistent Volume,持久化存储卷。它是用来描述或者说用来定义一个存储卷的,这个通常都是由运维工程师来定义。
PVC的全称是Persistent Volume claim,是持久化存储的请求。它是用来描述希望使用什么样的或者说是满足什么条件的PⅣ存储。
PVC的使用逻辑:在 Pod 中定义一个存储卷(该存储卷类型为 PVC),定义的时候直接指定大小,PVC必须与对应的PV建立关系,PVC会根据配置的定义去PV申请,而PV是由存储空间创建出来的。PV和 PVC是Kubernetes 抽象出来的一种存储资源。
上面介绍的PV和PVC模式是需要运维人员先创建好PV,然后开发人员定义好PVC进行一对一的Bond,但是如果PVC请求成千上万,那么就需要创建成千上万的PV,对于运维人员来说维护成本很高,kubernetes提供一种自动创建PV的机制,叫storageclass,它的作用就是创建PV的模板。
创建StorageClass需要定义PV的属性,比如存储类型、大小等:另外创建这种PV需要用到的存储插件,比如ceph等。
有了这两部分信息,Kubernetes就能够根据用户批交的 PVC,找到对应的 storageClass,然后 Kubernetes就会调用storageClass声明的存储插件,自动创建需要的PV并进行绑定。
PV是集群中的资源。PVC是对这些资源的请求,也是对资源的索引检查。
PV和PVC之间的相互作用遵循这个生命周期:
Provisioning(配置)---> Binding(绑定) --->Using(使用) --->Releasing (释放)--->Recycling(回收)
Provisioning:即 PV的创建,可以直接创建PV(静态方式),也可以使用storageclass动态创建
Binding:将PV分配给PVC
Using:Pod通过 PVC使用该volume,并可以通过准入控制storageProtection (1.9及以前版本为PVCProtection)阻止删除正在使用的 PVC
Releasing:Pod 释放volume并册除PVC
Reclaiming:回收PV,可以保留PV以便下次使用,也可以直接从云存储中删除
根据这5个阶段,PV的状态有以下4种:
Available(可用):表示可用状态,还未被任何PVC绑定
Bound(己绑定):表示PV己经绑定到PVC
Released(己释放):表示 PVC被删掉,但是资源尚未被集群回收
Failed(失败):表示该PV的自动回收失败
5.9.1先查看是否有PV
[root@master ~]# kubectl get pv
No resources found

5.9.2创建PVC
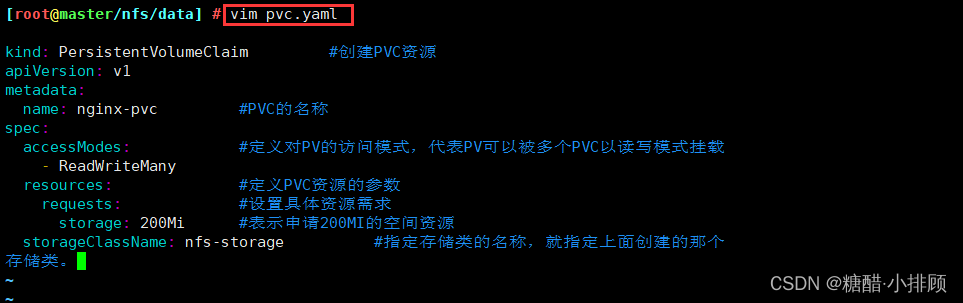
[root@master ~]# vim pvc.yaml
kind: PersistentVolumeClaim         #创建PVC资源
apiVersion: v1
metadata:
  name: nginx-pvc         #PVC的名称
spec:
  accessModes:            #定义对PV的访问模式,代表PV可以被多个PVC以读写模式挂载
    - ReadWriteMany
  resources:              #定义PVC资源的参数
    requests:             #设置具体资源需求
      storage: 200Mi      #表示申请200MI的空间资源
  storageClassName: nfs-storage          #指定存储类的名称,就指定上面创建的那个存储类。
5.9.3apply此Yaml文件,并查看PVC的状态
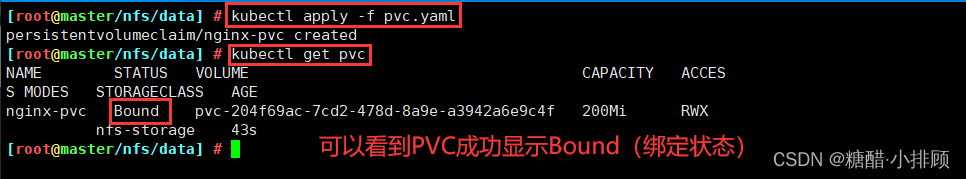
[root@master ~]# kubectl apply -f pvc.yaml
persistentvolumeclaim/nginx-pvc created
[root@master data]# kubectl get pvc
NAME        STATUS   VOLUME                                     CAPACITY   ACCESS MODES   STORAGECLASS   AGE
nginx-pvc   Bound    pvc-44413362-4617-4caa-8072-22a68ac6ce2b   200Mi      RWX            nfs-storage    7s

#可以看到PVC成功显示Bound(绑定状态)
在查看下PV
kubectl get pv 
六:安装Metrics-Server
Metrics-Server简介: 它是集群指标监控组件,用于和API Server交互,获取(采集)Kubernetes集群中各项指标数据的。 有了它我们可以查看各个Pod,Node等其他资源的CPU,Mem(内存)使用情况。
为什么需要它?
开头的时候说过,KubeSphere可以充当Kubernetes的dashboard(可视化面板)因此KubeSphere要想获取Kubernetes的各项数据,就需要某个组件去提供给想数据,这个数据采集功能由Metrics-Server实现。
6.1修改每个 API Server 的 kube-apiserver.yaml 配置开启 Aggregator Routing
[root@master ~]# vim /etc/kubernetes/manifests/kube-apiserver.yaml
apiVersion: v1
kind: Pod
metadata:
annotations:
kubeadm.kubernetes.io/kube-apiserver.advertise-address.endpoint: 192.168.137.20:6443
creationTimestamp: null
labels:
component: kube-apiserver
tier: control-plane
name: kube-apiserver
namespace: kube-system
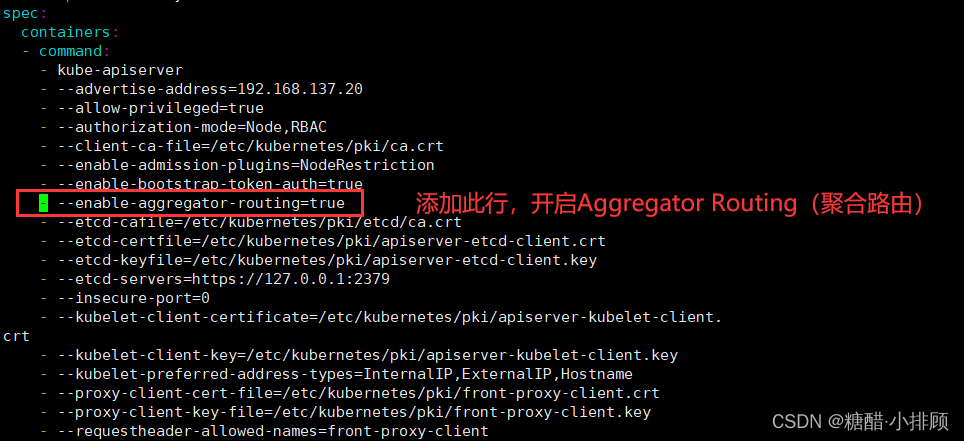
spec:
containers:
- command:
- kube-apiserver
- --advertise-address=192.168.137.20
- --allow-privileged=true
- --authorization-mode=Node,RBAC
- --client-ca-file=/etc/kubernetes/pki/ca.crt
- --enable-admission-plugins=NodeRestriction
- --enable-bootstrap-token-auth=true
- --enable-aggregator-routing=true #添加此行,开启Aggregator Routing(聚合路由)
- --etcd-cafile=/etc/kubernetes/pki/etcd/ca.crt
...
重启kubelet
systemctl daemon-reload
systemctl restart kubelet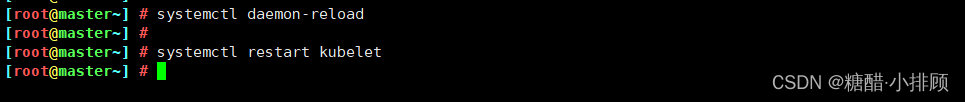
6.2安装所需的Yaml文件
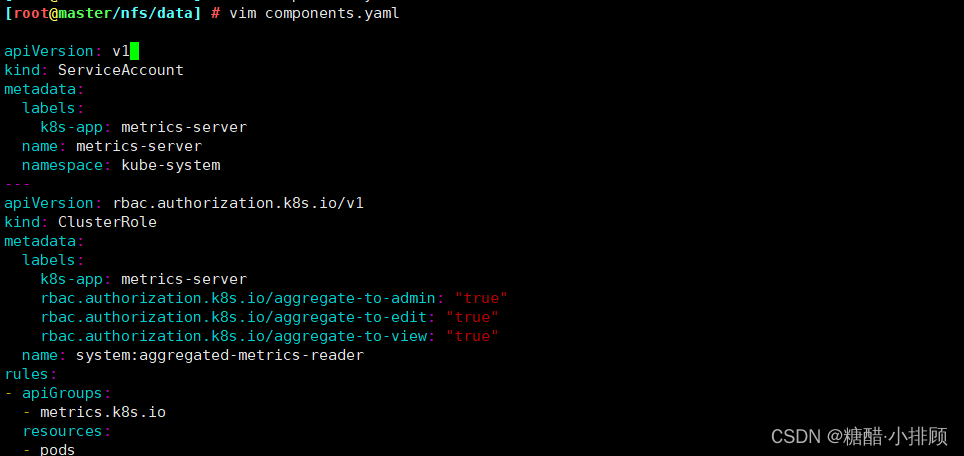
vim components.yaml
apiVersion: v1
kind: ServiceAccount
metadata:
  labels:
    k8s-app: metrics-server
  name: metrics-server
  namespace: kube-system
---
apiVersion: rbac.authorization.k8s.io/v1
kind: ClusterRole
metadata:
  labels:
    k8s-app: metrics-server
    rbac.authorization.k8s.io/aggregate-to-admin: "true"
    rbac.authorization.k8s.io/aggregate-to-edit: "true"
    rbac.authorization.k8s.io/aggregate-to-view: "true"
  name: system:aggregated-metrics-reader
rules:
- apiGroups:
  - metrics.k8s.io
  resources:
  - pods
  - nodes
  verbs:
  - get
  - list
  - watch
---
apiVersion: rbac.authorization.k8s.io/v1
kind: ClusterRole
metadata:
  labels:
    k8s-app: metrics-server
  name: system:metrics-server
rules:
- apiGroups:
  - ""
  resources:
  - pods
  - nodes
  - nodes/stats
  - namespaces
  - configmaps
  verbs:
  - get
  - list
  - watch
---
apiVersion: rbac.authorization.k8s.io/v1
kind: RoleBinding
metadata:
  labels:
    k8s-app: metrics-server
  name: metrics-server-auth-reader
  namespace: kube-system
roleRef:
  apiGroup: rbac.authorization.k8s.io
  kind: Role
  name: extension-apiserver-authentication-reader
subjects:
- kind: ServiceAccount
  name: metrics-server
  namespace: kube-system
---
apiVersion: rbac.authorization.k8s.io/v1
kind: ClusterRoleBinding
metadata:
  labels:
    k8s-app: metrics-server
  name: metrics-server:system:auth-delegator
roleRef:
  apiGroup: rbac.authorization.k8s.io
  kind: ClusterRole
  name: system:auth-delegator
subjects:
- kind: ServiceAccount
  name: metrics-server
  namespace: kube-system
---
apiVersion: rbac.authorization.k8s.io/v1
kind: ClusterRoleBinding
metadata:
  labels:
    k8s-app: metrics-server
  name: system:metrics-server
roleRef:
  apiGroup: rbac.authorization.k8s.io
  kind: ClusterRole
  name: system:metrics-server
subjects:
- kind: ServiceAccount
  name: metrics-server
  namespace: kube-system
---
apiVersion: v1
kind: Service
metadata:
  labels:
    k8s-app: metrics-server
  name: metrics-server
  namespace: kube-system
spec:
  ports:
  - name: https
    port: 443
    protocol: TCP
    targetPort: https
  selector:
    k8s-app: metrics-server
---
apiVersion: apps/v1
kind: Deployment
metadata:
  labels:
    k8s-app: metrics-server
  name: metrics-server
  namespace: kube-system
spec:
  selector:
    matchLabels:
      k8s-app: metrics-server
  strategy:
    rollingUpdate:
      maxUnavailable: 0
  template:
    metadata:
      labels:
        k8s-app: metrics-server
    spec:
      containers:
      - args:
        - --cert-dir=/tmp
        - --secure-port=4443
        - --kubelet-preferred-address-types=InternalIP       #删掉 ExternalIP,Hostname这两个,这里已经改好了
        - --kubelet-use-node-status-port
        - --kubelet-insecure-tls                             #加上该启动参数
        image: registry.cn-hangzhou.aliyuncs.com/google_containers/metrics-server:v0.4.1
        imagePullPolicy: IfNotPresent
        livenessProbe:
          failureThreshold: 3
          httpGet:
            path: /livez
            port: https
            scheme: HTTPS
          periodSeconds: 10
        name: metrics-server
        ports:
        - containerPort: 4443
          name: https
          protocol: TCP
        readinessProbe:
          failureThreshold: 3
          httpGet:
            path: /readyz
            port: https
            scheme: HTTPS
          periodSeconds: 10
        securityContext:
          readOnlyRootFilesystem: true
          runAsNonRoot: true
          runAsUser: 1000
        volumeMounts:
        - mountPath: /tmp
          name: tmp-dir
      nodeSelector:
        kubernetes.io/os: linux
      priorityClassName: system-cluster-critical
      serviceAccountName: metrics-server
      volumes:
      - emptyDir: {}
        name: tmp-dir
---
apiVersion: apiregistration.k8s.io/v1
kind: APIService
metadata:
  labels:
    k8s-app: metrics-server
  name: v1beta1.metrics.k8s.io
spec:
  group: metrics.k8s.io
  groupPriorityMinimum: 100
  insecureSkipTLSVerify: true
  service:
    name: metrics-server
    namespace: kube-system
  version: v1beta1
  versionPriority: 100
6.3拉取镜像
docker pull registry.cn-hangzhou.aliyuncs.com/google_containers/metrics-server:v0.4.1
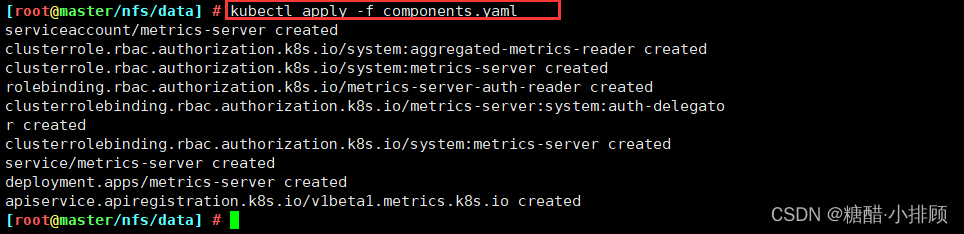
6.4安装
kubectl apply -f components.yaml
6.5查看Metrics Server服务状态
[root@master ~]# kubectl get pods -n kube-system
...
metrics-server-7d594964f5-5xzwd   1/1     Running   0          4h2m
...
6.6执行以下命令,检查节点占用性能情况
[root@master data]# kubectl top nodes
NAME     CPU(cores)   CPU%   MEMORY(bytes)   MEMORY%
master   95m          2%     1646Mi          21%
node01   34m          0%     3446Mi          44%
node02   26m          0%     899Mi           11%
#说明Metrics-Server正常运行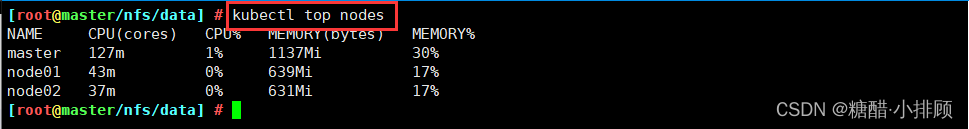
注:报错关闭虚拟机,添加内存和处理器
七:安装KubeSphere
7.1下载核心文件
wget https://github.com/kubesphere/ks-installer/releases/download/v3.1.1/kubesphere-installer.yaml
wget https://github.com/kubesphere/ks-installer/releases/download/v3.1.1/cluster-configuration.yaml

7.2修改cluster-configuration集群配置
说明:从 2.1.0 版本开始,KubeSphere 解耦了一些核心功能组件。这些组件设计成了可插拔式,您可以在安装之前或之后启用它们。如果您不启用它们,KubeSphere 会默认以最小化进行安装部署。不同的可插拔组件部署在不同的命名空间中。
上面是官方解释为啥需要修改cluster-configuration集群配置。
其实修改cluster-configuration集群配置就是额外启用一些KubeSphere插件,比如:启用DevOps的相关插件,开启ectd的监控功能,开启告警功能…
在 cluster-configuration.yaml中指定我们需要开启的功能
参照官网“启用可插拔组件”
https://kubesphere.com.cn/docs/pluggable-components/overview/
修改如下:
我们重点是改动spec下的字段,遇见"false"改为"true",但是几个不用改动,如下说明:
vim cluster-configuration.yaml
[root@master ~]# cat cluster-configuration.yaml
---
apiVersion: installer.kubesphere.io/v1alpha1
kind: ClusterConfiguration
metadata:
  name: ks-installer
  namespace: kubesphere-system
  labels:
    version: v3.1.1
spec:
  persistence:
    storageClass: ""        #这里保持默认即可,因为偶们有了默认的存储类
  authentication:
    jwtSecret: ""           # Keep the jwtSecret consistent with the Host Cluster. Retrieve the jwtSecret by executing "kubectl -n kubesphere-system get cm kubesphere-config -o yaml | grep -v "apiVersion" | grep jwtSecret" on the Host Cluster.
  local_registry: ""        # Add your private registry address if it is needed.
  etcd:
    monitoring: true       # 改为"true",表示开启etcd的监控功能
    endpointIps: 192.168.137.20  # 改为自己的master节点IP地址
    port: 2379              # etcd port.
    tlsEnable: true
  common:
    redis:
      enabled: true         #改为"true",开启redis功能
    openldap:
      enabled: true         #改为"true",开启轻量级目录协议
    minioVolumeSize: 20Gi # Minio PVC size.
    openldapVolumeSize: 2Gi   # openldap PVC size.
    redisVolumSize: 2Gi # Redis PVC size.
    monitoring:
      # type: external   # Whether to specify the external prometheus stack, and need to modify the endpoint at the next line.
      endpoint: http://prometheus-operated.kubesphere-monitoring-system.svc:9090 # Prometheus endpoint to get metrics data.
    es:   # Storage backend for logging, events and auditing.
      # elasticsearchMasterReplicas: 1   # The total number of master nodes. Even numbers are not allowed.
      # elasticsearchDataReplicas: 1     # The total number of data nodes.
      elasticsearchMasterVolumeSize: 4Gi   # The volume size of Elasticsearch master nodes.
      elasticsearchDataVolumeSize: 20Gi    # The volume size of Elasticsearch data nodes.
      logMaxAge: 7                     # Log retention time in built-in Elasticsearch. It is 7 days by default.
      elkPrefix: logstash              # The string making up index names. The index name will be formatted as ks-<elk_prefix>-log.
      basicAuth:
        enabled: false          #此处的"false"不用改为"true",这个标识在开启监控功能之后是否要连接ElasticSearch的账户和密码,此处不用
        username: ""
        password: ""
      externalElasticsearchUrl: ""
      externalElasticsearchPort: ""
  console:
    enableMultiLogin: true  # Enable or disable simultaneous logins. It allows different users to log in with the same account at the same time.
    port: 30880
  alerting:                # (CPU: 0.1 Core, Memory: 100 MiB) It enables users to customize alerting policies to send messages to receivers in time with different time intervals and alerting levels to choose from.
    enabled: true         # 改为"true",开启告警功能
    # thanosruler:
    #   replicas: 1
    #   resources: {}
  auditing:
    enabled: true         #  改为"true",开启审计功能
  devops:                  # (CPU: 0.47 Core, Memory: 8.6 G) Provide an out-of-the-box CI/CD system based on Jenkins, and automated workflow tools including Source-to-Image & Binary-to-Image.
    enabled: true             # 改为"true",开启DevOps功能
    jenkinsMemoryLim: 2Gi      # Jenkins memory limit.
    jenkinsMemoryReq: 1500Mi   # Jenkins memory request.
    jenkinsVolumeSize: 8Gi     # Jenkins volume size.
    jenkinsJavaOpts_Xms: 512m  # The following three fields are JVM parameters.
    jenkinsJavaOpts_Xmx: 512m
    jenkinsJavaOpts_MaxRAM: 2g
  events:                  # Provide a graphical web console for Kubernetes Events exporting, filtering and alerting in multi-tenant Kubernetes clusters.
    enabled: true         # 改为"true",开启集群的事件功能
    ruler:
      enabled: true
      replicas: 2
  logging:                 # (CPU: 57 m, Memory: 2.76 G) Flexible logging functions are provided for log query, collection and management in a unified console. Additional log collectors can be added, such as Elasticsearch, Kafka and Fluentd.
    enabled: true        # 改为"true",开启日志功能
    logsidecar:
      enabled: true
      replicas: 2
  metrics_server:                    # (CPU: 56 m, Memory: 44.35 MiB) It enables HPA (Horizontal Pod Autoscaler).
    enabled: false                   # 这个不用修改,因为在上卖弄我们已经安装过了,如果这里开启,镜像是官方的,会拉取镜像失败
  monitoring:
    storageClass: ""
    # prometheusReplicas: 1          # Prometheus replicas are responsible for monitoring different segments of data source and providing high availability.
    prometheusMemoryRequest: 400Mi   # Prometheus request memory.
    prometheusVolumeSize: 20Gi       # Prometheus PVC size.
    # alertmanagerReplicas: 1          # AlertManager Replicas.
  multicluster:
    clusterRole: none  # host | member | none  # You can install a solo cluster, or specify it as the Host or Member Cluster.
  network:
    networkpolicy: # Network policies allow network isolation within the same cluster, which means firewalls can be set up between certain instances (Pods).
      # Make sure that the CNI network plugin used by the cluster supports NetworkPolicy. There are a number of CNI network plugins that support NetworkPolicy, including Calico, Cilium, Kube-router, Romana and Weave Net.
      enabled: true # 改为"true",开启网络策略
    ippool: # Use Pod IP Pools to manage the Pod network address space. Pods to be created can be assigned IP addresses from a Pod IP Pool.
      type: none #如果你的网络插件是calico,需要修改为"calico",这里我是Flannel,保持默认。
    topology: # Use Service Topology to view Service-to-Service communication based on Weave Scope.
      type: none # Specify "weave-scope" for this field to enable Service Topology. "none" means that Service Topology is disabled.
  openpitrix: # An App Store that is accessible to all platform tenants. You can use it to manage apps across their entire lifecycle.
    store:
      enabled: true # 改为"true",开启应用商店
  servicemesh:         # (0.3 Core, 300 MiB) Provide fine-grained traffic management, observability and tracing, and visualized traffic topology.
    enabled: true     # 改为"true",开启微服务治理
  kubeedge:          # Add edge nodes to your cluster and deploy workloads on edge nodes.
    enabled: false   # 这个就不修改了,这个是边缘服务,我们也没有边缘的设备。
    cloudCore:
      nodeSelector: {"node-role.kubernetes.io/worker": ""}
      tolerations: []
      cloudhubPort: "10000"
      cloudhubQuicPort: "10001"
      cloudhubHttpsPort: "10002"
      cloudstreamPort: "10003"
      tunnelPort: "10004"
      cloudHub:
        advertiseAddress: # At least a public IP address or an IP address which can be accessed by edge nodes must be provided.
          - ""            # Note that once KubeEdge is enabled, CloudCore will malfunction if the address is not provided.
        nodeLimit: "100"
      service:
        cloudhubNodePort: "30000"
        cloudhubQuicNodePort: "30001"
        cloudhubHttpsNodePort: "30002"
        cloudstreamNodePort: "30003"
        tunnelNodePort: "30004"
    edgeWatcher:
      nodeSelector: {"node-role.kubernetes.io/worker": ""}
      tolerations: []
      edgeWatcherAgent:
        nodeSelector: {"node-role.kubernetes.io/worker": ""}
tolerations: [] 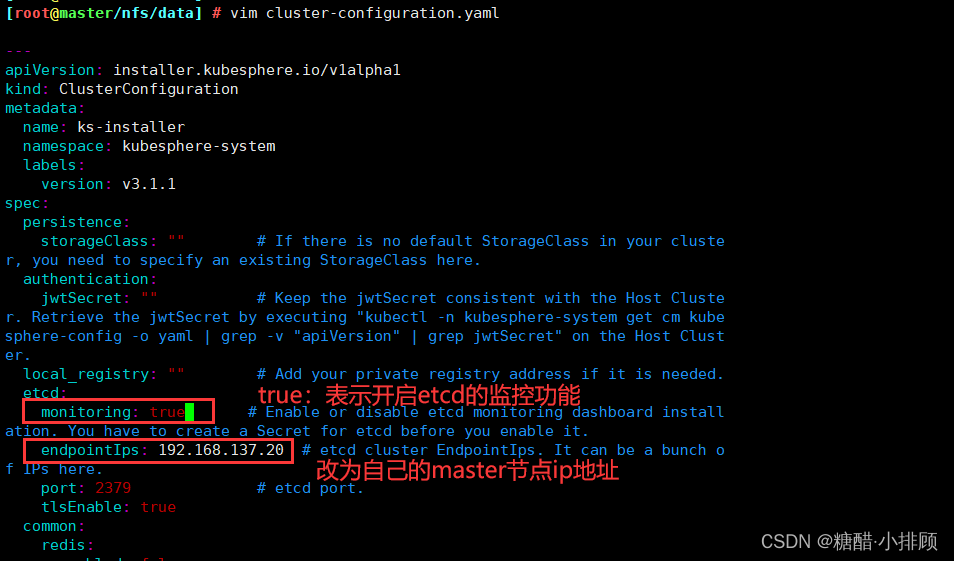
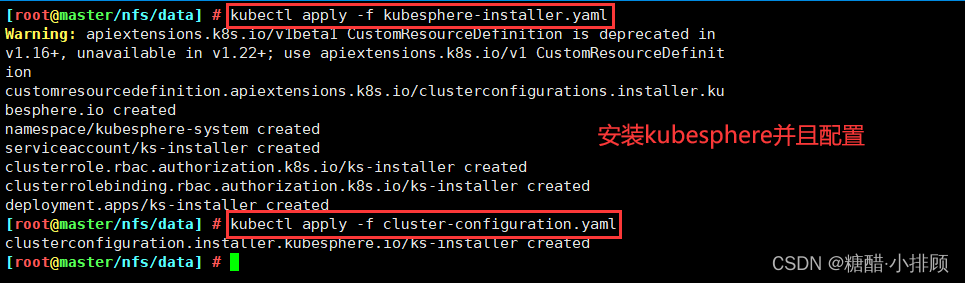
7.3安装kubesphere并配置kubesphere(注意运行顺序)
kubectl apply -f kubesphere-installer.yaml
kubectl apply -f cluster-configuration.yaml
7.4查看KubeSphere的状态
[root@master ~]# kubectl get pods -A
...
kubesphere-system            ks-installer-54c6bcf76b-br9vq                   1/1     Running             0          41m
...

7.5检查安装日志
使用如下命令可以查看kubesphere安装的日志
[root@k8s-master ~]# kubectl logs -n kubesphere-system $(kubectl get pod -n kubesphere-system -l app=ks-install -o jsonpath='{.items[0].metadata.name}') -f
#显示结果:
PLAY RECAP *********************************************************************
localhost : ok=31 changed=25 unreachable=0 failed=0 skipped=15 rescued=0 ignored=0
#注意查看failed=0,失败=0即可。
#下面就等待估计20min
Start installing monitoring
Start installing multicluster
Start installing openpitrix
Start installing network
Start installing alerting
Start installing auditing
Start installing devops
Start installing events
Start installing kubeedge
Start installing logging
Start installing servicemesh
**************************************************
Waiting for all tasks to be completed ...
task multicluster status is successful (1/11)
task network status is successful (2/11)
task alerting status is successful (3/11)
task openpitrix status is successful (4/11)
task auditing status is successful (5/11)
task logging status is successful (6/11)
task events status is successful (7/11)
task kubeedge status is successful (8/11)
task devops status is successful (9/11)
task monitoring status is successful (10/11)
task servicemesh status is successful (11/11)
**************************************************
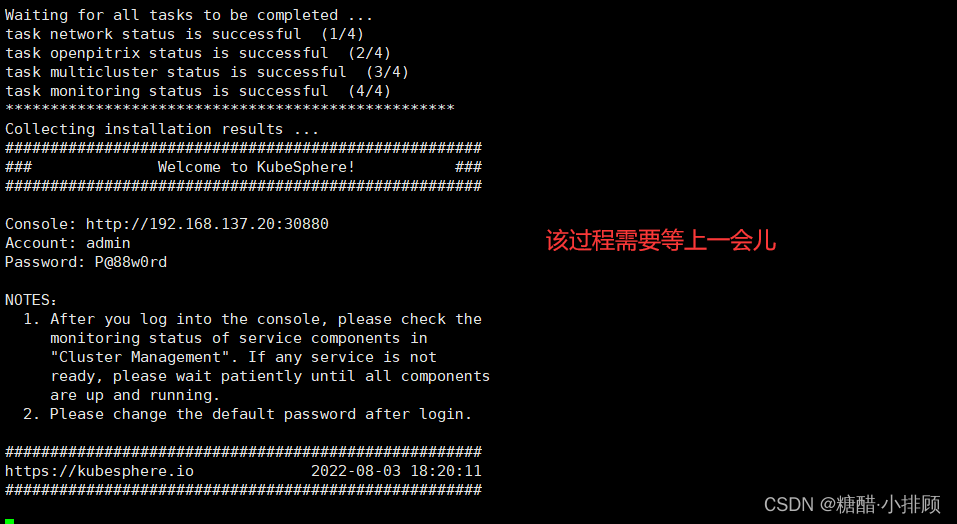
Collecting installation results ...
#####################################################
### Welcome to KubeSphere! ###
#####################################################
Console: http://192.168.0.206:30880
Account: admin
Password: P@88w0rd
NOTES:
1. After you log into the console, please check the
monitoring status of service components in
"Cluster Management". If any service is not
ready, please wait patiently until all components
are up and running.
2. Please change the default password after login.
#####################################################
https://kubesphere.io 2022-04-08 17:14:52
#####################################################
#出现如上信息表示安装KubeSphere行
八: 解决Prometheus监控etcd找不到Secret的问题
1、安装好了KubeSphere之后查看相关Pod,会发现有两个Prometheus(监控服务)一直处于ContainerCreating,那这时我们就需要排查一下错误了,首先describe
[root@k8s-master ~]# kubectl get pods -A
kubesphere-monitoring-system   prometheus-k8s-0                                   0/3     ContainerCreating   0          9m39s
kubesphere-monitoring-system   prometheus-k8s-1                                   0/3     ContainerCreating   0          9m39s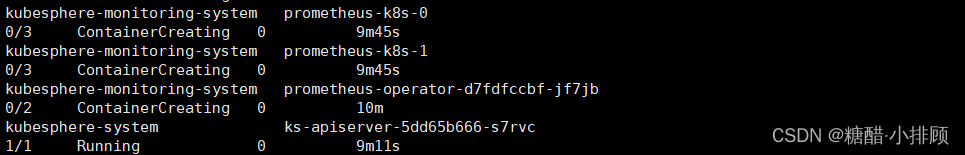
2、describe查看原因
[root@k8s-master ~]# kubectl describe pods -n kubesphere-monitoring-system   prometheus-k8s-0
Warning  FailedMount       8m6s                   kubelet            Unable to attach or mount volumes: unmounted volumes=[secret-kube-etcd-client-certs], unattached volumes=[prometheus-k8s-db prometheus-k8s-rulefiles-0 secret-kube-etcd-client-certs prometheus-k8s-token-nzqs8 config config-out tls-assets]: timed out waiting for the condition
  Warning  FailedMount       3m34s (x2 over 5m51s)  kubelet            Unable to attach or mount volumes: unmounted volumes=[secret-kube-etcd-client-certs], unattached volumes=[config config-out tls-assets prometheus-k8s-db prometheus-k8s-rulefiles-0 secret-kube-etcd-client-certs prometheus-k8s-token-nzqs8]: timed out waiting for the condition
  Warning  FailedMount       115s (x12 over 10m)    kubelet            MountVolume.SetUp failed for volume "secret-kube-etcd-client-certs" : secret "kube-etcd-client-certs" not found
  Warning  FailedMount       80s                    kubelet            Unable to attach or mount volumes: unmounted volumes=[secret-kube-etcd-client-certs], unattached volumes=[tls-assets prometheus-k8s-db prometheus-k8s-rulefiles-0 secret-kube-etcd-client-certs prometheus-k8s-token-nzqs8 config config-out]: timed out waiting for the condition
说明: 由于我们在cluster-configuration.yaml文件中开启了监控功能,但是Prometheus无法获取到etcd的证书,因为我们知道etcd是整个Kubernetes的核心,存放着重要的数据,因此需要有它的证书允许才能进行监控。
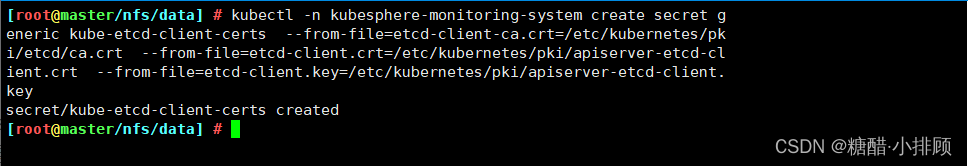
因此我们创建secret里面放证书即可:
kubectl -n kubesphere-monitoring-system create secret generic kube-etcd-client-certs --from-file=etcd-client-ca.crt=/etc/kubernetes/pki/etcd/ca.crt --from-file=etcd-client.crt=/etc/kubernetes/pki/apiserver-etcd-client.crt --from-file=etcd-client.key=/etc/kubernetes/pki/apiserver-etcd-client.key
大概等个5分钟左右,再次查看,就Running了。
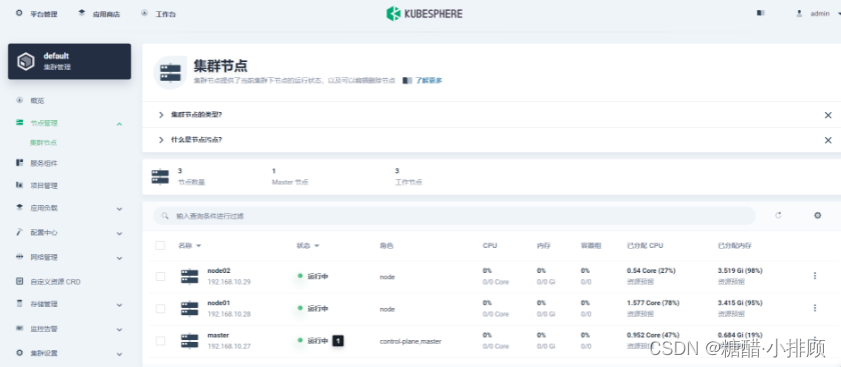
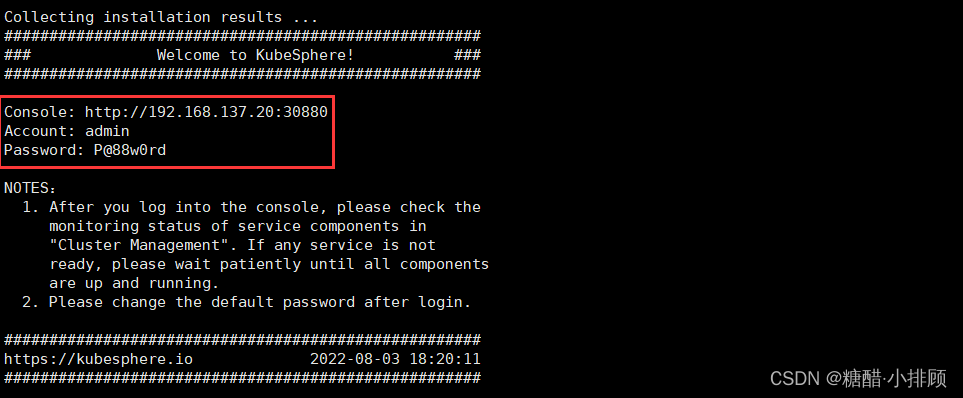
九 :访问KubeSphere
在确保KubeSphere的相关插件都Running后,我们就能访问KubeSphere了(KubeSphere默认监听30880端口,如果是公有云环境需要注意安全组开放30880端口):IP:30880
用户:admin
初始密码:P@88w0rd

更改密码

进入KubeSphere主界面