如图所示
<template>
  <div class="Chart">
    <div class="main_box">
      <div class="diagram_box" v-if="activeChart === 'diagram'">
        <div class="drawer">
          <drawer
            :drawer.sync="drawer"
            :cusStyle="{ top: '10px'}"
            :drawerTop="{width:imgWidth,height:'5px'}"
            width="424px"
            oldLeft="-5px"
            :moveLeft="moveLeft"
            @handleClick="DrawerHandleClick"
          >
            <div class="main_box">
              <div class="content_box" v-for="(item,index) in labelList" :key="index" @click="clickLabel(index)"> // 点击左侧
                <div :class="['content',{

     'selected': item[0].isSelect}]">
                  <div class="icon">
                    <img :src="origin + iconObj[item[0].value]['icon_path']" alt="">
                  </div>
                  <div class="info_box">
                    <div v-for="(e,i) in item" :key="i">
                      <div class="info" v-if="!e.isIcon">
                        <div class="label">{

   {e.label + ':'}}</div>
                        <div class="value" v-if="e.label_en === 'avatar_url' || e.label_en === 'car_image'">
                          <el-image
                            :src="origin + e.value"
                            fit="cover"
                          >
                            <div slot="error" class="image-slot">
                              <img :src="errImg" />
                            </div>
                          </el-image>
                        </div>
                        <div class="value" v-else>{

   {e.value}}</div>
                      </div>
                    </div>
                  </div>
                </div>
              </div>
            </div>
            <div class="total">
              <span>总数:</span>
              <span>{

   { labelList.length }}</span>
            </div>
          </drawer>
        </div>
        <Loading :isLoading.sync="isLoading">
          <Diagram
            ref="charts"
            v-if="chartList.length"
            :id="id"
            :bgColor="chartsBg"
            :chartList="chartList"
            @handleDbClick="handleDbClick"
            @updateData="updateData"
          />
          <div class="empty_div" v-else>
            <EmptyData />
          </div>
        </Loading>
      </div>
    </div>
  </div>
</template>

 // 点击左侧信息
clickLabel (index) {
 this.labelList.forEach(item => {
   item[0].isSelect = false
 })
 this.labelList[index][0].isSelect = true
 this.$refs.charts.switchHigh(index,1)
}
<template>
<div :id="id" class="chart"></div>
</template>
<script>
import {
colors} from './mock'
import {
lightTheme, darkTheme } from "@/assets/js/variable";
import {
mapState } from 'vuex';
// import { getEntityIcon } from '@/api/analysis'
// import { mapGetters } from 'vuex'
import * as echarts from 'echarts'
export default {
name: 'Charts',
props: {
id: {
type: String
},
chartList: {
type: Array
},
bgColor: {
// 图谱背景色
type: String
}
},
data () {
return {
myChart: null,
seriesData: [],
seriesLinks: [],
seriesCategories: [],
cerTypeObj: {
attr_identity_card_type: '身份证',
attr_passport_type: '护照',
attr_hk_permit_type: '港澳通行证'
},
option: {
}
// iconObj: {}
}
},
computed: {
...mapState('User', {
theme: 'theme'
}),
...mapState('Common', {
iconObj: 'iconObj',
usefulRelationTypeListMap: 'usefulRelationTypeListMap',
usefulRelationTypeList: 'usefulRelationTypeList',
dataTypeObj:'dataTypeObj'
}),
origin () {
return window.location.origin + '/'
}
},
watch: {
chartList: {
handler (val) {
if (!val.length) return
this.myChart && this.myChart.dispose()
this.myChart = null
this.formatData(val)
},
immediate: true, //关键
deep: true
},
theme: {
handler () {
// console.log(this.myChart);
if (this.myChart) {
// console.log(this.option);
// console.log('执行了');
// this.myChart.setOption(this.option)
this.formatData(this.chartList)
}
},
immediate: true
}
},
created () {
// console.log(this.theme);
},
methods: {
// 数据格式化
formatData (list) {
// 存在类别 赋值
this.seriesCategories = this.formatCates(list[0])
const sArr =
list[1]?.map(_c => {
return {
source: _c.src + '', target: _c.dst + '', dataRelationShipName: this.dataTypeObj[_c.data_source], personRelationShipName: _c.relationship, ..._c }
}) ?? []
this.seriesLinks = sArr.filter((element, index, self) => {
return self.findIndex(x => x.vid === element.vid) === index
})
// const typeImgsMapOBJ = { ...typeImgsMap }
const nArr =
list[0]?.map(_c => {
if (_c.type !== 'entity_person') {
// 给name赋值 默认在实体上显示
_c.name = _c.main_prop_val
}
_c.category = this.seriesCategories.findIndex(
ele => ele.name === this.usefulRelationTypeListMap[_c.type]
)
_c.symbolSize = 38
// console.log(_c.type,this.iconObj[_c.type])
_c.symbol = this.iconObj[_c.type]['icon_path'] ? 'image://' + this.origin + this.iconObj[_c.type]['icon_path'] : require(`@/assets/img/atlis-default.png`)
_c.id = _c.vid
return _c
}) ?? []
// 不可有重复name否则会报错
this.seriesData = nArr.filter((element, index, self) => {
return self.findIndex(x => x.vid === element.vid) === index
})
// this.seriesData = nArr
this.$nextTick(() => {
this.initCharts()
})
},
// 处理显示类别为有数据的类别
formatCates (list) {
const nameList = list.map(_c => this.usefulRelationTypeListMap[_c.type])
const uniqueArr = [...new Set(nameList)]
// console.log(uniqueArr)
// 将人员放在数组首项
// const index = uniqueArr.findIndex(_c => _c === '人员')
// if (index !== -1) {
// const personItem = uniqueArr.splice(index, 1)
// uniqueArr.unshift(personItem[0])
// }
return uniqueArr.map(_c => {
return {
name: _c }
})
},
/**
* 设置echarts配置项,重绘画布
*/
initCharts () {
const _this = this
if (!this.myChart) {
this.myChart = echarts.init(document.getElementById(this.id))
this.myChart.off('legendselectchanged') //解决重复触发
// this.myChart.off('click') //解决重复触发
// this.myChart.getZr()?.off('click') //解决重复触发
// this.myChart.on('click', params => {
// console.log(params);
// if (params.dataType === 'node') {
// this.$emit('handleClickNode', params.data)
// } else if (params.dataType === 'edge') {
// this.$emit('handleClickEdge', params.data)
// }
// })
// 双击事件
this.myChart.on('dblClick', params => {
// console.log('双击事件',params)
this.$emit('handleDbClick', params.data)
})
// 点击
this.myChart.on('click', params => {
// if (!params.target) {
// this.$emit('handleClickOut')
// }
// console.log('单击事件',params)
if (params.dataType === 'edge') {
this.$emit('clickEdge', params)
}
})
this.myChart.on('legendselectchanged', e => {
const {
selected } = e
let {
legend } = _this.myChart.getOption()
for(let key in selected) {
legend[0].data.forEach(item => {
if (selected[key]) {
if (item.name === key) {
item.itemStyle.opacity = 1
item.textStyle.opacity = 1
}
} else {
if (item.name === key) {
item.itemStyle.opacity = 0.2
item.textStyle.opacity = 0.2
}
}
})
}
const option = {
..._this.myChart.getOption(), legend }
_this.myChart.setOption(option)
})
this.myChart.on('mousedown', e => {
if (e.dataType === "edge") {
return }
let {
tooltip } = _this.myChart.getOption()
tooltip[0].trigger = 'none'
const option = {
..._this.myChart.getOption(), tooltip }
_this.myChart.setOption(option)
})
this.myChart.on('globalout', () => {
let {
tooltip } = _this.myChart.getOption()
tooltip[0].trigger = 'item'
const option = {
..._this.myChart.getOption(), tooltip }
setTimeout(() => {
_this.myChart.setOption(option)
}, 20)
})
this.myChart.on('mouseup', () => {
let {
tooltip } = _this.myChart.getOption()
tooltip[0].trigger = 'item'
const option = {
..._this.myChart.getOption(), tooltip }
setTimeout(() => {
_this.myChart.setOption(option)
}, 20)
})
}
// 颜色不能写死,需要写变量对应
let colorObj = this.theme === 'light' ? lightTheme : darkTheme
// 指定图表的配置项和数据
this.option = {
backgroundColor: this.bgColor,
// 提示框的配置
tooltip: {
// backgroundColor: 'rgba(40, 50, 71,.9)',
backgroundColor: colorObj['--tooltip-bg-262D44-to-f6f8fd'],
borderWidth: 0,
enterable: true,
position: 'right',
hideDelay: 10,
// transitionDuration:'2',
textStyle: {
//默认值,
color: colorObj['--base-text-color-to-666666'], //默认值各异,
fontSize: 16 //默认值,
},
padding: 10,
formatter: params => {
{
// 关系线的提示
if (params.dataType === 'edge') {
// return params.data.dataRelationShipName
return
}
if (params.data.type === 'entity_person' || params.data.type === 'entity_certificate') {
const imgUrl = params.data.avatar_url
? window.location.origin + '/' + params.data.avatar_url
: this.theme === 'light' ? require('@/assets/img/icon-morenHeader-light.png') : require('@/assets/img/icon-morenHeader.png')
return `
<div style="display:flex;color: ${
colorObj['--base-text-color-to-999999']};">
<img style="height:90px;width:75px;" src="${
imgUrl}"" />
<div style="margin-left:8px;">
<div style="display:flex">
<div style="font-size:14px;width:75px;">姓名:</div>
<div>
${
params.data.name || '--'}
</div>
</div>
<div style="display:flex">
<div style="font-size:14px;width:75px;">性别:</div>
<div>
${
this.getSex(params.data)}
</div>
</div>
<div style="display:flex">
<div style="font-size:14px;width:75px;">民族:</div>
<div>
${
params.data.nation || '--'}
</div>
</div>
<div style="display:flex">
<div style="font-size:14px;width:75px;">出生日期:</div>
<div>
${
this.getBirthday(params.data)}
</div>
</div>
</div>
</div>
<div style="margin-top:0px;color: ${
colorObj['--base-text-color-to-999999']};">
<div>
<div style="display:flex">
<div style="width:75px;font-size:14px;">${
this.getCerType(params.data)}</div>
<div>${
params.data.cer_number || '--'}</div>
</div>
<div>
<div>
<span style="font-size:14px;">户籍地址:</span>
<span>${
params.data.registered_address || '--'}</span>
</div>
</div>
`
} else if (params.data.type === 'entity_mobile_phone') {
return `
<div style="color: ${
colorObj['--base-text-color-to-999999']}">
<span style="font-size:14px;">IMEI:</span>
<span>${
params.data.imei || '--'}</span>
</div>
`
} else if (params.data.type === 'entity_phone_card') {
return `
<div style="color: ${
colorObj['--base-text-color-to-999999']}">
<span style="font-size:14px;">手机号:</span>
<span>${
params.data.main_prop_val || '--'}</span>
</div>
<div style="color: ${
colorObj['--base-text-color-to-999999']}">
<span style="font-size:14px;">IMSI:</span>
<span>${
params.data.imsi || '--'}</span>
</div>
`
} else {
let list = []
for(let key in params.data) {
this.iconObj[params.data.type].fields.forEach(item => {
if (key === item.label_name_en && params.data[key]) {
if (key.indexOf('_image') !== -1) {
list.push({
label: item.label_name_cn,
value: params.data[key],
isImage: true
})
} else {
list.push({
label: item.label_name_cn,
value: params.data[key],
isImage: false
})
}
}
})
}
return `
<ul>
${
list.map(item => {
if (item.isImage) {
return `
<li style="color: ${
colorObj['--base-text-color-to-999999']}">
<span style="font-size:14px;">${
item.label + ':'}</span>
<img style="height:75px;width:100px;" src="${
window.location.origin + '/' + item.value}" />
</li>
`
} else {
return `
<li style="color: ${
colorObj['--base-text-color-to-999999']}">
<span style="font-size:14px;">${
item.label + ':'}</span>
<span>${
item.value || '--'}</span>
</li>
`
}
}).join('')}
</ul>
`
}
}
}
},
// 类目color
color: colors,
// 类目数组
legend: [
{
// data: [],
data: this.chartList[0].map(_c => {
return {
name: this.iconObj[_c.type]['entity_name_cn'],
icon: this.iconObj[_c.type]['icon_path'] ? 'image://' + this.origin + this.iconObj[_c.type]['icon_path'] : require(`@/assets/img/atlis-default.png`),
itemStyle: {
opacity: 1
},
textStyle: {
opacity: 1
}
}
}),
x: 'right',
y: 'bottom',
itemWidth: 24,
itemHeight: 24,
textStyle: {
// color: 'rgba(174, 189, 212,0.9)',
color: colorObj['--base-text-color-to-666666'],
fontSize: 12
}
}
],
series: [
{
type: 'graph', // 类型:关系图
top: '10%', // 图表距离容器顶部的距离
// zoom: 1,
layout: 'force', //图的布局,类型为力导图
legendHoverLink: false, //是否启用图例 hover(悬停) 时的联动高亮。
edgeSymbol: ['circle', 'arrow'],
edgeSymbolSize: [2, 8], // 两端大小
force: {
edgeLength: 300, // 两个节点之间的距离
repulsion: 1000, //节点之间的斥力因子值
friction: 0.2, // 节点的移动速度 取值0~1
},
roam: true, //是否开启鼠标缩放和平移漫游。默认不开启。如果只想要开启缩放或者平移,可以设置成 'scale' 或者 'move'。设置成 true 为都开启
draggable: true, //每个节点的拖拉
// 关系线样式lineStyle
lineStyle: {
show: true,
width: 1,
// color: '#8799BF', //决定边的颜色是与起点相同还是与终点相同 可选'target'
color: colorObj['--base-text-color-to-999999'], //决定边的颜色是与起点相同还是与终点相同 可选'target'
// curveness: 0.1 // 边的曲度,支持从 0 到 1 的值,值越大曲度越大。
},
autoCurveness:true,
//图形上的文本标签,可用于说明图形的一些数据信息
label: {
//标签的字体样式
// color: '#c0d0e7', //字体颜色
color: colorObj['--base-text-color-1'], //字体颜色
fontStyle: 'normal', //文字字体的风格 'normal'标准 'italic'斜体 'oblique' 倾斜
fontWeight: 'bolder', //'normal'标准'bold'粗的'bolder'更粗的'lighter'更细的或100 | 200 | 300 | 400...
fontFamily: 'sans-serif', //文字的字体系列
fontSize: 12, //字体大小
show: true, //显示
position: 'top', //相对于节点标签的位置,默认在节点中间
//回调函数,你期望节点标签上显示什么
formatter: function (params) {
// 对手机号特殊处理,标签上优先取手机号,没有则依次取值
if (params.data.type === 'entity_probe_phone') {
return params.data.phone || params.data.imei || params.data.imsi
} else {
return params.name
}
}
},
edgeLabel: {
position: 'middle', // 标签位置 线的中点
show: true,
fontSize: 12,
color: colorObj['--base-text-color-to-666666'],
formatter: x => {
if (x.data.relationship) {
return x.data.relationship + '(' + x.data.dataRelationShipName + x.data.rank + '次)'
} else {
return (
this.getVertexName(x.data.dst.split('-')[0]) +
'(' +
x.data.dataRelationShipName + x.data.rank +
'次)' || ''
)
}
}
},
emphasis: {
scale: true, //是否开启鼠标悬停节点的显示动画
lineStyle: {
width: 2
},
shadowColor: '#00FAE1',
shadowOffsetX: 0,
shadowOffsetY: 0,
shadowBlur: 40,
focus: 'adjacency'
},
symbolSize: 5, //节点大小
categories: this.seriesCategories,
links: this.seriesLinks,
data: this.seriesData,
cursor: 'pointer',
nodeStyle: {
brushType: 'both',
borderColor: 'rgba(255,215,0,0.4)',
borderWidth: 1
}
}
],
// 动画更新变化时间
animationDurationUpdate: 100, //数据更新动画的时长。[ default: 300 ]
// animationDurationUpdate: 200, //数据更新动画的时长。[ default: 300 ]
animationEasingUpdate: 'quinticInOut' 数据更新动画的缓动效果。[ default: cubicOut ] "quinticInOut"
}
// 使用刚指定的配置项和数据显示图表。
this.myChart.setOption(this.option,true)
let model = this.myChart.getModel().getSeriesByIndex(0).getData()._itemLayouts;
this.$emit('updateData',model)
},
switchHigh (index, name) {
// console.log(index,name)
this.myChart.dispatchAction({
type: 'highlight',
seriesIndex: 0,
dataIndex: index,
name: name
})
},
// 通过身份证获取性别
getSex (data) {
// console.log(data)
// return data.gender
if (data.gender === '' || data.gender == null) {
if (data.cer_type === 'attr_identity_card_type') {
if (parseInt(data.cer_number.substr(16, 1)) % 2 === 1) {
return "男"
} else {
return "女"
}
} else {
return '--'
}
} else {
if (data.gender === 'female' || data.gender === '女') {
return '女'
} else if (data.gender === 'male' || data.gender === '男') {
return '男'
} else {
// return '--'
return data.gender
}
}
},
// 通过身份证号获取出生日期
getBirthday (data) {
if (data.birthday === '' || data.birthday == null) {
if (data.cer_type === 'attr_identity_card_type') {
return data.cer_number.substring(6, 10) + "/" + data.cer_number.substring(10, 12) + "/" + data.cer_number.substring(12, 14)
} else {
return '--'
}
} else {
return data.birthday
}
},
getCerType (data) {
if (data.cer_type === 'attr_hk_permit_type') {
return '港澳通行证:'
} else if (data.cer_type === 'attr_passport_type') {
return '护照:'
} else if (data.cer_type === 'attr_identity_card_type') {
return '身份证:'
} else {
return '未知证件:'
}
},
getVertexName (data) {
return this.iconObj[data]['entity_name_cn']
}
}
}
</script>
<style scoped>
.cusEchart-label {
width: 500px;
}
</style>
好吧 太多了 关键是看这个
switchHigh (index, name) {


  // console.log(index,name)
  this.myChart.dispatchAction({


    type: 'highlight',
    seriesIndex: 0,
    dataIndex: index,
    name: name // 感觉传这个name没什么用 注释都行
  })
},
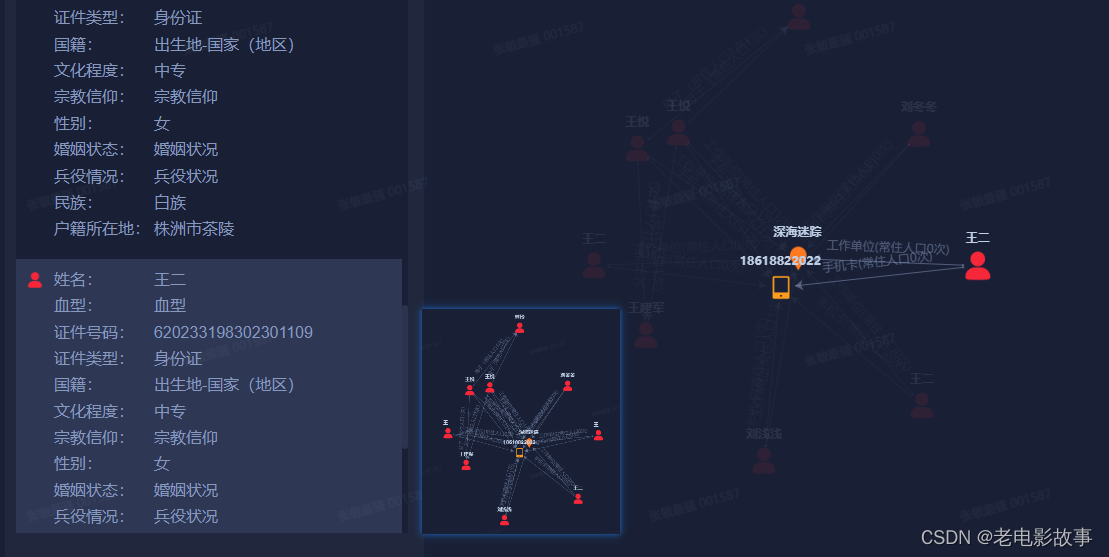
遇到的问题
遇到了什么问题呢 就是 点击对应的实体 但是高亮了别的 如图 点击了 王二 但是却高亮了手机
问题原因
switchHigh 的index对应错了 点击王二 就需要传王二的index
解决方法
因为我右边的列表 是过滤了关于人的实体 手机阿 公司阿 地址阿 都不在左边的列表里面 然后 switchHigh 传的就是左边列表的index 这样就错了 应该传图谱数据的列表对应的index
因为传给图谱的chartList数组的数据里面有人有物 顺序是乱的 但是我把人的全部提取出来给了左边
所以我就把chartList数组处理了下 把人的排在前面 物在后面
 let peopleList =  vertex.filter(item => item.type === 'entity_person')
 let thingList = vertex.filter(item => item.type !== 'entity_person')
 let newVertexList = peopleList.concat(thingList)
 this.chartList = [newVertexList, edge]
解决了
我只是记录这个问题 说明switchHigh 的index来自哪里