matplotlib入门案例
参考:
http://c.biancheng.net/matplotlib/data-visual.html
https://www.bookstack.cn/read/huaxiaozhuan-ai/333f5abdbabf383d.md
总结
本文主要是Matplotlib从入门到精通系列第1篇,本文介绍了Matplotlib的历史,绘图元素的概念以及Matplotlib的多个层级,同时介绍了较好的参考文档置于博客前面,读者可以重点查看参考链接。本系列的目的是可以完整的完成Matplotlib从入门到精通。
Matplotlib历史
MATLAB简介:

MATlAB是美国MathWorks公司出品的商业数学软件,用于数据分析、无线通信、深度学习、量化金融与风险管理、机器人,控制系统等领域。MATLAB在数值计算方面首屈一指,也是使用最广泛的科研绘图软件之一。优点:编程效率高 便于矩阵计算。缺点:循环效率低 封装性不好。
matplotlib简介

Matplotlib 是 Python 的绘图库。 Matplotlib 由 John D. Hunter 在 2002 年开始编写,提供了一个套面向绘图对象编程的 API 接口,能够很轻松地实现各种图像的绘制,并且它可以配合 Python GUI 工具(如 PyQt、Tkinter 等)在应用程序中嵌入图形。同时 Matplotlib 也支持以脚本的形式嵌入到 IPython shell、Jupyter 笔记本、web 应用服务器中使用。它可与 NumPy 一起使用,提供了一种有效的 MatLab 开源替代方案。
初开发的Matplotlib,仅支持绘制2d图形,后来随着版本的不断更新,Matplotlib在二维绘图的基础上,构建了一部分较为实用的3D绘图程序包,通过调用该程序包一些接口可以绘制3D散点图、3D曲面图、3D线框图等

seaborn简介

Seaborn是一种开源的数据可视化工具,它在Matplotlib的基础上进行了更高级的API封装,因此可以进行更复杂的图形设计和输出。Seaborn是Matplotlib的重要补充,可以自主设置在Matplotlib中被默认的各种参数,而且它能高度兼容NumPy与Pandas数据结构以及Scipy与statsmodels等统计模式。
Seaborn是一种开源的数据可视化工具,它在Matplotlib的基础上进行了更高级的API封装,因此可以进行更复杂的图形设计和输出。

Matplotlib特点
官网:https://matplotlib.org/
Matplotlib: Visualization with Python
Matplotlib is a comprehensive library for creating static, animated, and interactive visualizations in Python. Matplotlib makes easy things easy and hard things possible.
Create publication quality plots.
Make interactive figures that can zoom, pan, update.
Customize visual style and layout.
Export to many file formats .
Embed in JupyterLab and Graphical User Interfaces.
Use a rich array of third-party packages built on Matplotlib.
Matplotlib安装
Python 包管理器 pip 安装
pip install matplotlib -i https://pypi.tuna.tsinghua.edu.cn/simple
Linux安装
·sudo apt-get install python-matplotlib
·sudo yum install python-matplotlib
Jupyter安装
!pip install matplotlib -i https://pypi.tuna.tsinghua.edu.cn/simple
Python 编程环境
import matplotlib
matplotlib.__version__
'3.7.0'
绘图元素
核心概念
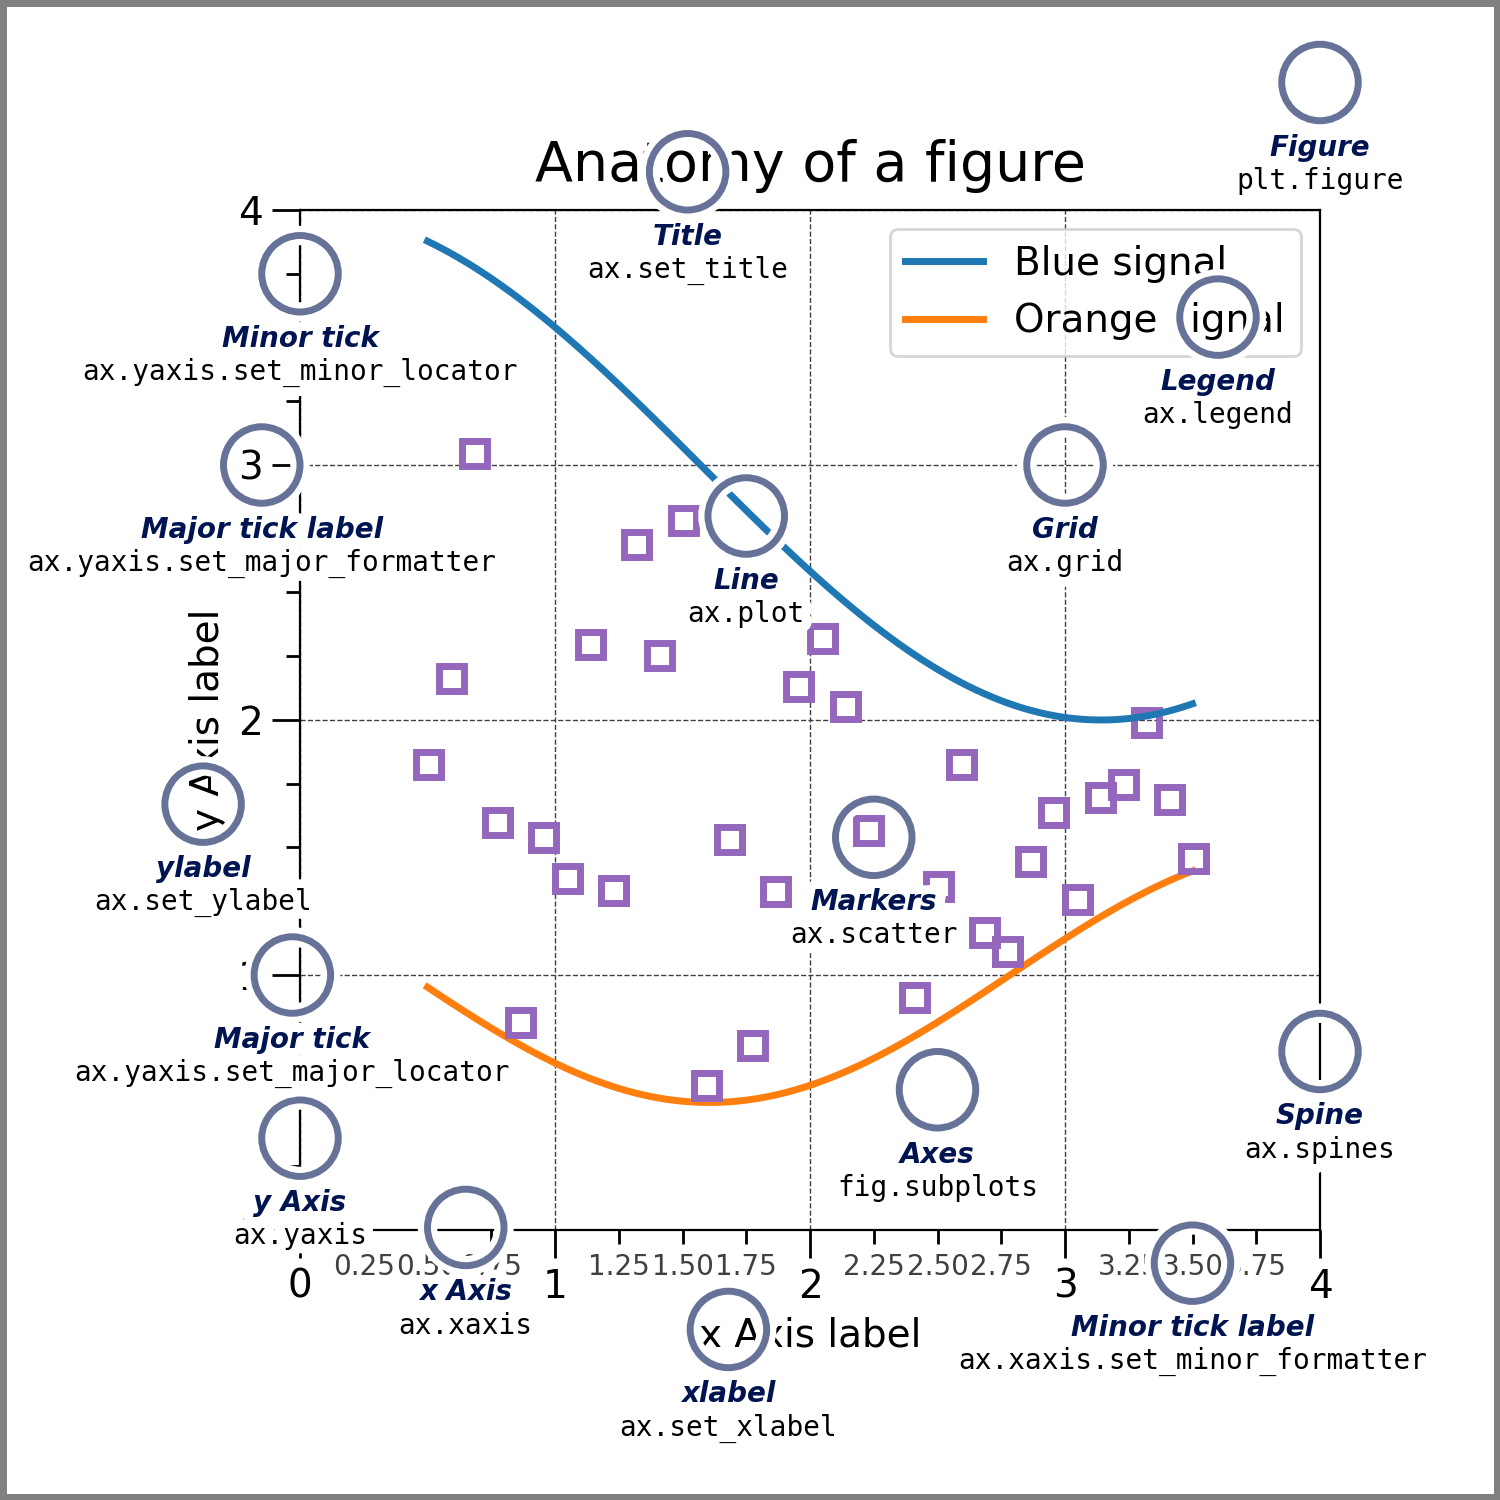
一个完整的matplotlib图像通常会包括以下四个层级,这些层级也被称为容器(container)
Figure:顶层级,用来容纳所有绘图元素
Axes:matplotlib宇宙的核心,容纳了大量元素用来构造一幅幅子图,一个figure可以由一个或多个子图组成
Axis:axes的下属层级,用于处理所有和坐标轴,网格有关的元素
Tick:axis的下属层级,用来处理所有和刻度有关的元素
Figure:指整个图形,您可以把它理解成一张画布,它包括了所有的子元素Axes,一组特殊的Artists(如标题,图例,色彩,轴等),以及嵌套的子图;
The whole figure. The Figure keeps track of all the child Axes, a
group of ‘special’ Artists (titles, figure legends, colorbars, etc),
and even nested subfigures. The easiest way to create a new Figure is with pyplot:
fig = plt.figure()  # an empty figure with no Axes
fig, ax = plt.subplots()  # a figure with a single Axes
fig, axs = plt.subplots(2, 2)  # a figure with a 2x2 grid of Axes
Axes:绘制 2D 图像的实际区域,也称为轴域区,或者绘图区;
An Axes is an Artist attached to a Figure that contains a region for
plotting data, and usually includes two (or three in the case of 3D)
Axis objects (be aware of the difference between Axes and Axis) that
provide ticks and tick labels to provide scales for the data in the
Axes. Each Axes also has a title (set via set_title()), an x-label
(set via set_xlabel()), and a y-label set via set_ylabel()). The Axes
class and its member functions are the primary entry point to working
with the OOP interface, and have most of the plotting methods defined on them (e.g. ax.plot(), shown above, uses the plot method)
Axis:指坐标系中的垂直轴与水平轴,包含轴的长度大小(图中轴长为 7)、轴标签(指 x 轴,y轴)和刻度标签;
These objects set the scale and limits and generate ticks (the marks on the Axis) and ticklabels (strings labeling the ticks). The location of the ticks is determined by a Locator object and the ticklabel strings are formatted by a Formatter. The combination of the correct Locator and Formatter gives very fine control over the tick locations and labels.
Artist:您在画布上看到的所有元素都属于 Artist 对象,比如文本对象(title、xlabel、ylabel)、Line2D 对象(用于绘制2D图像)等。
Basically, everything visible on the Figure is an Artist (even Figure, Axes, and Axis objects). This includes Text objects, Line2D objects, collections objects, Patch objects, etc. When the Figure is rendered, all of the Artists are drawn to the canvas. Most Artists are tied to an Axes; such an Artist cannot be shared by multiple Axes, or moved from one to another.
 下面这幅图是如何设置对应的元素。
绘图接口
matplotlib提供了两种最常用的绘图接口
1.显式创建figure和axes,在上面调用绘图方法,也被称为OO模式(object-oriented style)
2.依赖pyplot自动创建figure和axes,并绘图
OO模式
from matplotlib import pyplot as plt
import matplotlib as mpl
import numpy as np

x = np.linspace(0, 2, 100)

fig, ax = plt.subplots()
ax.plot(x, x, label='linear')
ax.plot(x, x**2, label='quadratic')
ax.plot(x, x**3, label='cubic')
ax.set_xlabel('x label')
ax.set_ylabel('y label')
ax.set_title("Simple Plot")
ax.legend()
plt.show()
输出为:
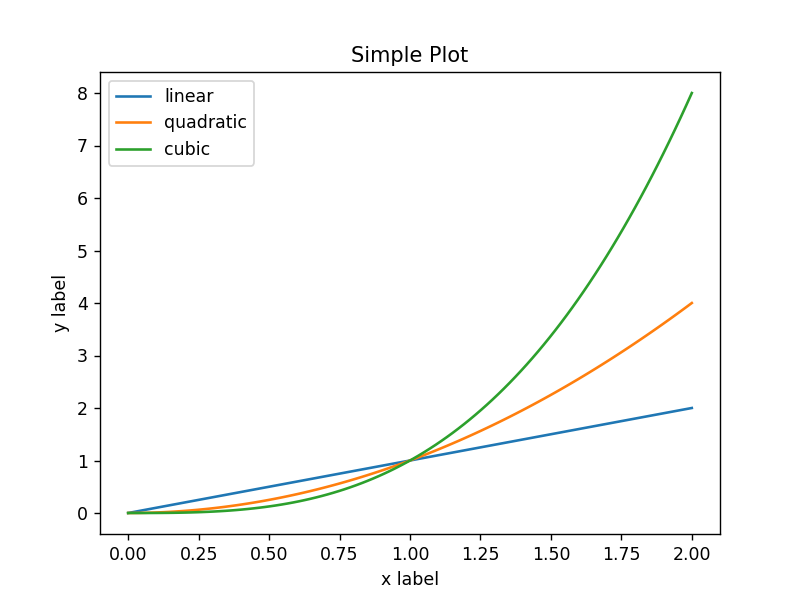
依赖pyplot模式
from matplotlib import pyplot as plt
import matplotlib as mpl
import numpy as np

x = np.linspace(0, 2, 100)

# fig, ax = plt.subplots()
# ax.plot(x, x, label='linear')
# ax.plot(x, x**2, label='quadratic')
# ax.plot(x, x**3, label='cubic')
# ax.set_xlabel('x label')
# ax.set_ylabel('y label')
# ax.set_title("Simple Plot")
# ax.legend()

plt.plot(x, x, label='linear')
plt.plot(x, x**2, label='quadratic')
plt.plot(x, x**3, label='cubic')
plt.xlabel('x label')
plt.ylabel('y label')
plt.title("Simple Plot")
plt.legend()

plt.show()
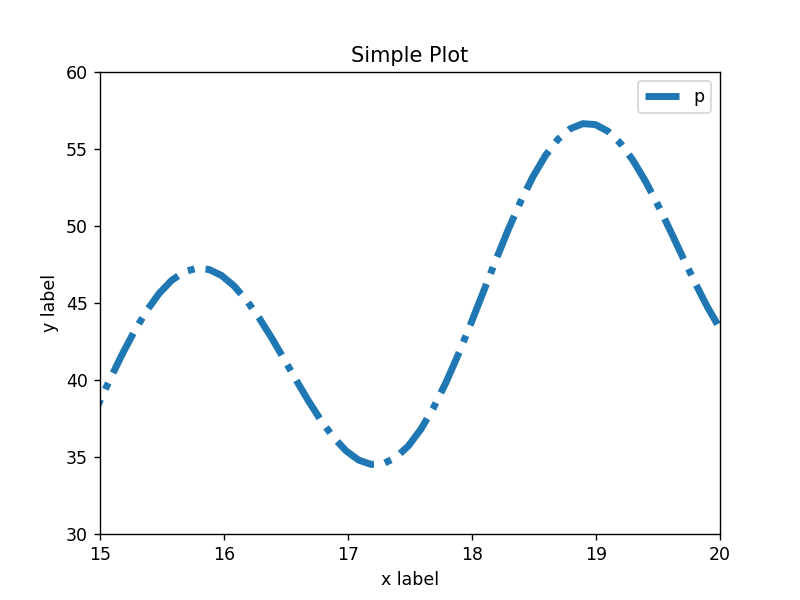
基本流程:
1.导入依赖
from matplotlib import pyplot as plt
import matplotlib as mpl
import numpy as np
2.定义x轴和y轴数据
x = np.linspace(0,20,200)  #等差数列
y =  0.5*np.cos(2*x)*x+2.5*x  #x相关的函数
3.设置绘图样式
# 设置绘图样式,这一步不是必须的,样式也可以在绘制图像是进行设置
mpl.rc('lines', linewidth=4, linestyle='-.')
4.定义布局
# 定义布局, 这一模块的扩展参考第三章进一步学习
fig, ax = plt.subplots()
5.绘制图像
# 绘制图像, 这一模块的扩展参考第二章进一步学习
ax.plot(x, y, label='linear')
6.添加标签文字图例
# step6 添加标签,文字和图例,这一模块的扩展参考第四章进一步学习
ax.set_xlabel('x label')
ax.set_ylabel('y label')
ax.set_title("Simple Plot")
ax.set_xlim(15,20) # x轴的刻度范围
ax.set_ylim(30,60) # y轴的刻度范围
ax.legend(labels='p',loc = 'upper right') ;

plt.show() #
完整代码:
# 1.导入依赖定义x轴和y轴数据
from matplotlib import pyplot as plt
import matplotlib as mpl
import numpy as np

#2.定义x轴和y轴数据
x = np.linspace(0,20,200)  #等差数列
y =  0.5*np.cos(2*x)*x+2.5*x  #x相关的函数

#3.设置绘图样式
# 设置绘图样式,这一步不是必须的,样式也可以在绘制图像是进行设置
mpl.rc('lines', linewidth=4, linestyle='-.')


#4.定义布局
# 定义布局, 这一模块的扩展参考第三章进一步学习
fig, ax = plt.subplots()


#5.绘制图像
# 绘制图像, 这一模块的扩展参考第二章进一步学习
ax.plot(x, y, label='linear')

# 6.添加标签文字图例
# step6 添加标签,文字和图例,这一模块的扩展参考第四章进一步学习
ax.set_xlabel('x label')
ax.set_ylabel('y label')
ax.set_title("Simple Plot")
ax.set_xlim(15,20) # x轴的刻度范围
ax.set_ylim(30,60) # y轴的刻度范围
ax.legend(labels='p',loc = 'upper right')

plt.show() #
输出为: