<!DOCTYPE html>
<html>
<head lang="en">
    <meta charset="UTF-8">
    <title></title>
    <script type="text/javascript" src="echarts.min.js"></script>
</head>
<body>
<div style="height: 410px;min-height: 100px;margin: 0 auto;" id="main"></div>
<script type="text/javascript">
//    创建echarts对象
    var mychart =echarts.init(document.getElementById("main"));
    option = {
    title: {
        text: '平均身高',
        subtext: '纯属虚构'
    },
    tooltip: {
        trigger: 'axis'
    },
    legend: {
        data:['最高','最矮']
    },
    toolbox: {
        show: true,
        feature: {
            dataZoom: {
                yAxisIndex: 'none'
            },
            dataView: {readOnly: false},
            magicType: {type: ['line', 'bar']},
            restore: {},
            saveAsImage: {}
        }
    },
    xAxis:  {
        type: 'category',
        boundaryGap: false,
        data: ['1组','2组','3组','4组','5组','6组','7组']
    },
    yAxis: {
        type: 'value',
        axisLabel: {
            formatter: '{value} °C'
        }
    },
    series: [
        {
            name:'最高身高',
            type:'line',
            data:[11, 11, 15, 13, 12, 13, 10],
            markPoint: {
                data: [
                    {type: 'max', name: '最大值'},
                    {type: 'min', name: '最小值'}
                ]
            },
            markLine: {
                data: [
                    {type: 'average', name: '平均值'}
                ]
            }
        },
        {
            name:'最低身高',
            type:'line',
            data:[1, -2, 2, 5, 3, 2, 0],
            markPoint: {
                data: [
                    {name: '周最低', value: -2, xAxis: 1, yAxis: -1.5}
                ]
            },
            markLine: {
                data: [
                    {type: 'average', name: '平均值'},
                    [{
                        symbol: 'none',
                        x: '90%',
                        yAxis: 'max'
                    }, {
                        symbol: 'circle',
                        label: {
                            normal: {
                                position: 'start',
                                formatter: '最大值'
                            }
                        },
                        type: 'max',
                        name: '最高点'
                    }]
                ]
            }
        }
    ]
};
//    数据未加载前的loading动画
//    mychart.showLoading();
//加载echarts事例
    mychart.setOption(option);
</script>

</body>

</html>
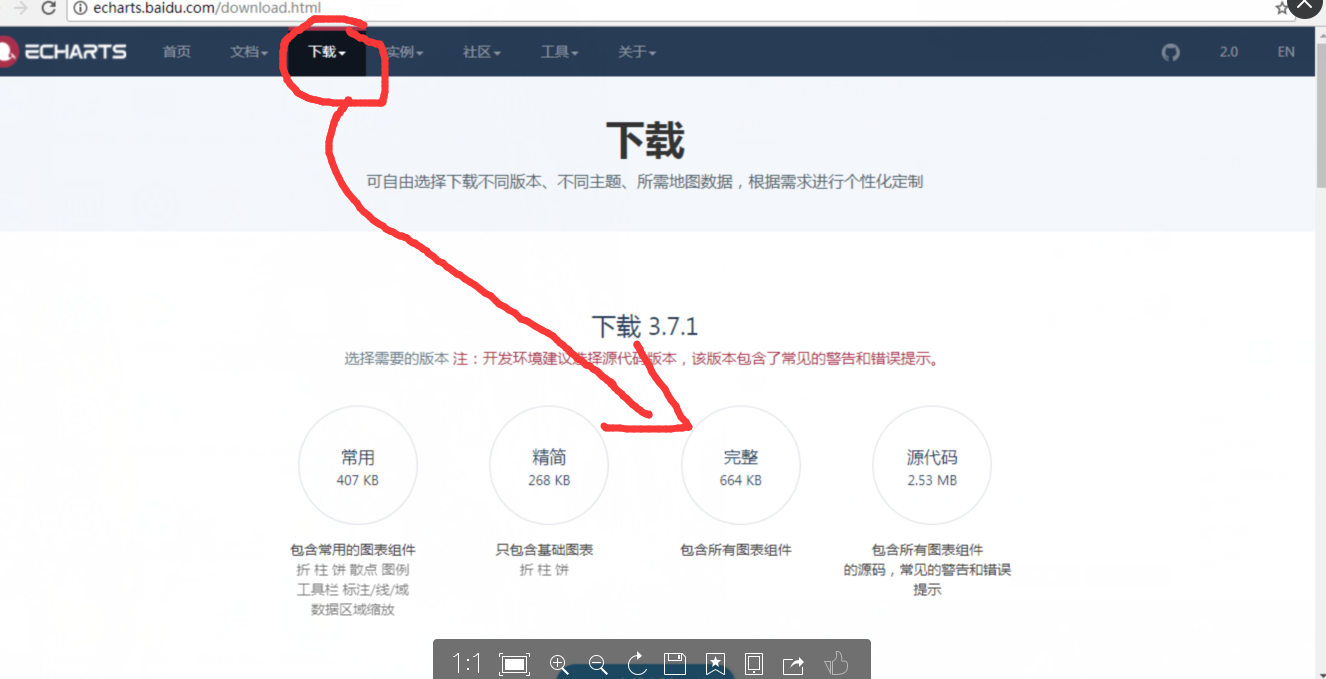
Echarts在官网下载echarts包放入和html一样的工程里注意scr包路径
需要什么图形找到替换option内容就可以了!
其实就是js文件,注意script内容修改