先说一下QLabel简单用法:
QLabel使用html可以将文本设置为不用的大小和颜色
(1)<h1></h1>是 【标题标签】,除了h1还有h2 h3 h4 h5 h6字体大小依次减小,这主要是根据实际情况用的,但不是用来控制字体大小用的。
<h1 align="center"></h1>: align="center"是让h1 标题居中显示,还有 left 、right 让标题显示在左边或右边。
(2)<font color=black>定值1</font>,设置“定值1”字体颜色为黑色
(3)<font color=red>定值2</font>,设置“定值2”字体颜色为黑色
另外,
(4)<font size=12></font>,设置字体大小为12像素,单位也可以是厘米、英寸。
(5)<strong></strong>,设置字体加粗。
(6)<u></u>,设置下划线
label = QLabel("<h1><font color=red>定值2</font><font color=black size=12>定值3</font></h1>");
一、概述
先简单介绍一下,绘制实时数据波形图,我们一般使用到的库有qwt、qcustomplot以及官方的QtCharts模块。
- qwt这个库安装比较麻烦。不过功能比较全使用的人比较多。
- qcustomplot很精简小巧,就一个.h .cpp文件,但是功能也很强大健全。
- QtCharts这个模块以前是收费使用的,现在已经免费了,官方出品。
今天的主角是qcustomplot,使用的是最新的版本:
下载地址:https://www.qcustomplot.com/
QCustomPlot 是一个基于Qt的画图和数据可视化C++控件。QCustomPlot 致力于提供美观的界面,高质量的2D画图、图画和图表,同时为实时数据可视化应用提供良好的解决方案。
获取
下载地址:http://qcustomplot.com/index.php/download,QCustomPlot.tar.gz,目前更新到1.3.1版本。
官网:http://qcustomplot.com/index.php/introduction
论坛:http://qcustomplot.com/index.php/support/forum
在你的应用中使用QCustomPlot 有2种方法:
1、将下载下来的qcustomplot.h和qcustomplot.cpp加入你的工程中。在你要使用qcustomplot的文件中:
#include "qcustomplot.h"官方提供的demo提供了4个例程,这里初入手的特别注意范例plot-examples,其包含了多种效果,修改代码的数字实现不同的demo,如果修改 setupDemo(10);如下图:是Realtime Data Demo。这个就是绘制实时数据的demo。
官方例子
https://www.qcustomplot.com/index.php/demos/realtimedatademo

二、绘图性能改善
QCustomPlot采用了诸如自适应采样和文本对象缓存之类的各种技术,以减少重新绘制所需的时间。但是,某些功能(如复杂的半透明填充和粗线)仍会导致速度显着下降。如果您在应用程序中注意到这一点,这里有一些有关如何提高重复打印性能的提示。
到目前为止,大部分时间都花在了绘图功能上,尤其是在绘制高密度图和其他绘图表时。为了获得最佳性能,请考虑以下几点:
- 特别是在图形,粗线,半透明颜色下/之间使用复杂的填充时:通过QCustomPlot :: setOpenGl启用QCustomPlot的OpenGL硬件加速渲染。有关如何正确启用OpenGL加速的详细信息,请参见此处的文档。OpenGL加速可用于QCustomPlot支持的所有Qt版本,并且分别选择了相应的后端。 对于5.0之前的Qt版本,QCustomPlot自己的OpenGL加速的替代方法是在创建QApplication对象之前提供“ -graphicssystem opengl”作为命令行参数或进行调用。这样可以实现应用程序范围的OpenGL加速。
QApplication::setGraphicsSystem("opengl")
请注意,使用OpenGL加速,最大帧速率可能会受到显示器垂直同步频率的限制(可以在图形卡驱动程序配置中禁用VSync)。因此,对于简单绘图(潜在帧速率远高于每秒60帧),OpenGL加速可能会在数值上低于默认软件渲染器,因为它没有限制在VSync频率上。
- 避免笔宽度大于一的线。这与默认软件渲染器尤其相关,而与OpenGL加速无关。
- 避免复杂的填充,例如,在具有数千个点的图形之间进行通道填充。这与默认软件渲染器尤其相关,而与OpenGL加速无关。
- 如果仅由于非复杂对象(例如,某项)已更改而在图中具有相对静态但复杂的图形时,通常需要调用完整的QCustomPlot :: replot,请考虑将定期更改的对象放置在自己的图层上并对其进行设置模式(QCPLayer :: setMode)到QCPLayer :: lmBuffered。这使QCustomPlot为该层分配了专用的绘制缓冲区,并允许使用QCPLayer :: replot对其进行单独重新绘制,而与包含潜在复杂图和慢图的其他层无关。有关详细信息,请参见相应方法的文档。
- 仅Qt4:使用Qt 4.8或更高版本。与Qt 4.7相比,性能提高了两倍或三倍。但是,QPainter损坏了,并且绘制像散点图这样的像素精确元素的效果不如Qt 4.7好。因此,切换到Qt 4.8时,是性能与绘图质量之间的折衷。QCustomPlot在内部尝试解决此类最严重的故障。
- 要在范围拖动期间提高响应速度,请考虑将QCustomPlot :: setNoAntialiasingOnDrag设置为true。仅在使用默认软件渲染器时才有意义。(OpenGL抗锯齿不能即时切换,这需要对样本缓冲区进行昂贵的重新分配。)
- 仅限于Qt4:在X11(GNU / Linux)上,请避免使用较慢的本机绘图系统,通过提供“ -graphicssystem raster”作为命令行参数或在创建QApplication对象之前调用来使用栅格
QApplication::setGraphicsSystem("raster")。
- 避免使用任何类型的alpha(透明)颜色,尤其是在填充中。
- 避免任何形式的抗锯齿,尤其是在图形行中(请参见QCustomPlot :: setNotAntialiasedElements)。仅在使用默认软件渲染器时才有意义。
- 避免重复设置完整的数据集,例如使用QCPGraph :: setData。如果大多数数据点保持不变,例如在运行的测量中,请改用QCPGraph :: addData。您可以通过QCPGraph :: data访问和操作现有数据。
- 作为最后的选择,请尝试减少任何给定时刻在可见键范围内的数据点数量,例如通过限制最大键范围跨度(请参阅QCPAxis :: rangeChanged信号)。QCustomPlot可以非常有效地优化掉数百万个屏幕外点。
三、简单使用
首先,给个简单的例子:
// 生成数据,画出的是抛物线
QVector<double> x(101), y(101); // initialize with entries 0..100
for (int i=0; i<101; ++i)
{
  x[i] = i/50.0 - 1; // x goes from -1 to 1
  y[i] = x[i]*x[i]; // let's plot a quadratic function
}
// 添加数据曲线(一个图像可以有多个数据曲线)
customPlot->addGraph();


// graph(0);可以获取某个数据曲线(按添加先后排序)
// setData();为数据曲线关联数据
customPlot->graph(0)->setData(x, y);
// 为坐标轴添加标签
customPlot->xAxis->setLabel("x");
customPlot->yAxis->setLabel("y");
// 设置坐标轴的范围,以看到所有数据
customPlot->xAxis->setRange(-1, 1);
customPlot->yAxis->setRange(0, 1);


// 重画图像
customPlot->replot();
QCustomPlot的外观由很多方面特性组成,都可以改变;
QCustomPlot有四个QCPAxis成员变量,分别代表四个坐标轴:xAxis(下)yAxis(左)xAxis2(上)yAxis2(右);
QCPAxis有相应的函数可以设置坐标轴的刻度、间距、范围等;
setTickStep(double step);//设置刻度间距
setTickVector(const QVector<double> &vec);//将坐标轴刻度设置为vec
setAutoTickStep(bool on);//设置是否自动分配刻度间距
setAutoTicks(bool on);//设置是否自动分配刻度
setAutoTickCount(int approximateCount);//设置是否自动分配刻度数量
还有setBasePen、setTickPen、setTickLength、setSubTickLength、setSubTickPen、setTickLabelFont、setLabelFont、setTickLabelPadding、setLabelPadding、setRangeReversed等;
//曲线风格:
QCPGraph::setPen(const QPen &pen);


//曲线画笔:
QCPGraph::setLineStyle(LineStyle ls);


//可以设置颜色、宽度、实虚等
//曲线形状:
QCPGraph::setScatterStyle(QCPScatterStyle &style);


//填充曲线方式:
//曲线形状像*、+、x、o等等
QCPGraph::setBrush(const QBrush &brush);
QCPGraph::setChannelFillGraph(otherGraph);//设置与某之间曲线填充
QCPGraph::setBrush(Qt::NoBrush);//移除填充


//以上会等到专门将QCPGraph和QCPScatterStyle类的时候再细讲网格:
customPlot->yAxis->grid();

setPen、setZeroLinePen、setSubGridVisible等
四、高级画图
//1、多曲线与多风格

customPlot->setLocale(QLocale(QLocale::English, QLocale::UnitedKingdom)); // period as decimal separator and comma as thousand separator
customPlot->legend->setVisible(true);
QFont legendFont = font();  // start out with MainWindow's font..
legendFont.setPointSize(9); // and make a bit smaller for legend
customPlot->legend->setFont(legendFont);
customPlot->legend->setBrush(QBrush(QColor(255,255,255,230)));
// by default, the legend is in the inset layout of the main axis rect. So this is how we access it to change legend placement:
customPlot->axisRect()->insetLayout()->setInsetAlignment(0, Qt::AlignBottom|Qt::AlignRight);

// setup for graph 0: key axis left, value axis bottom
// will contain left maxwell-like function
customPlot->addGraph(customPlot->yAxis, customPlot->xAxis);
customPlot->graph(0)->setPen(QPen(QColor(255, 100, 0)));
customPlot->graph(0)->setBrush(QBrush(QPixmap("./dali.png"))); // fill with texture of specified png-image
customPlot->graph(0)->setLineStyle(QCPGraph::lsLine);
customPlot->graph(0)->setScatterStyle(QCPScatterStyle(QCPScatterStyle::ssDisc, 5));
customPlot->graph(0)->setName("Left maxwell function");

// setup for graph 1: key axis bottom, value axis left (those are the default axes)
// will contain bottom maxwell-like function
customPlot->addGraph();
customPlot->graph(1)->setPen(QPen(Qt::red));
customPlot->graph(1)->setBrush(QBrush(QPixmap("./dali.png"))); // same fill as we used for graph 0
customPlot->graph(1)->setLineStyle(QCPGraph::lsStepCenter);
customPlot->graph(1)->setScatterStyle(QCPScatterStyle(QCPScatterStyle::ssCircle, Qt::red, Qt::white, 7));
customPlot->graph(1)->setErrorType(QCPGraph::etValue);
customPlot->graph(1)->setName("Bottom maxwell function");

// setup for graph 2: key axis top, value axis right
// will contain high frequency sine with low frequency beating:
customPlot->addGraph(customPlot->xAxis2, customPlot->yAxis2);
customPlot->graph(2)->setPen(QPen(Qt::blue));
customPlot->graph(2)->setName("High frequency sine");

// setup for graph 3: same axes as graph 2
// will contain low frequency beating envelope of graph 2
customPlot->addGraph(customPlot->xAxis2, customPlot->yAxis2);
QPen blueDotPen;
blueDotPen.setColor(QColor(30, 40, 255, 150));
blueDotPen.setStyle(Qt::DotLine);
blueDotPen.setWidthF(4);
customPlot->graph(3)->setPen(blueDotPen);
customPlot->graph(3)->setName("Sine envelope");

// setup for graph 4: key axis right, value axis top
// will contain parabolically distributed data points with some random perturbance
customPlot->addGraph(customPlot->yAxis2, customPlot->xAxis2);
customPlot->graph(4)->setPen(QColor(50, 50, 50, 255));
customPlot->graph(4)->setLineStyle(QCPGraph::lsNone);
customPlot->graph(4)->setScatterStyle(QCPScatterStyle(QCPScatterStyle::ssCircle, 4));
customPlot->graph(4)->setName("Some random data around\na quadratic function");

// generate data, just playing with numbers, not much to learn here:
QVector<double> x0(25), y0(25);
QVector<double> x1(15), y1(15), y1err(15);
QVector<double> x2(250), y2(250);
QVector<double> x3(250), y3(250);
QVector<double> x4(250), y4(250);
for (int i=0; i<25; ++i) // data for graph 0
{
  x0[i] = 3*i/25.0;
  y0[i] = exp(-x0[i]*x0[i]*0.8)*(x0[i]*x0[i]+x0[i]);
}
for (int i=0; i<15; ++i) // data for graph 1
{
  x1[i] = 3*i/15.0;;
  y1[i] = exp(-x1[i]*x1[i])*(x1[i]*x1[i])*2.6;
  y1err[i] = y1[i]*0.25;
}
for (int i=0; i<250; ++i) // data for graphs 2, 3 and 4
{
  x2[i] = i/250.0*3*M_PI;
  x3[i] = x2[i];
  x4[i] = i/250.0*100-50;
  y2[i] = sin(x2[i]*12)*cos(x2[i])*10;
  y3[i] = cos(x3[i])*10;
  y4[i] = 0.01*x4[i]*x4[i] + 1.5*(rand()/(double)RAND_MAX-0.5) + 1.5*M_PI;
}

// pass data points to graphs:
customPlot->graph(0)->setData(x0, y0);
customPlot->graph(1)->setDataValueError(x1, y1, y1err);
customPlot->graph(2)->setData(x2, y2);
customPlot->graph(3)->setData(x3, y3);
customPlot->graph(4)->setData(x4, y4);
// activate top and right axes, which are invisible by default:
customPlot->xAxis2->setVisible(true);
customPlot->yAxis2->setVisible(true);
// set ranges appropriate to show data:
customPlot->xAxis->setRange(0, 2.7);
customPlot->yAxis->setRange(0, 2.6);
customPlot->xAxis2->setRange(0, 3.0*M_PI);
customPlot->yAxis2->setRange(-70, 35);
// set pi ticks on top axis:
QVector<double> piTicks;
QVector<QString> piLabels;
piTicks << 0  << 0.5*M_PI << M_PI << 1.5*M_PI << 2*M_PI << 2.5*M_PI << 3*M_PI;
piLabels << "0" << QString::fromUtf8("½π") << QString::fromUtf8("π") << QString::fromUtf8("1½π") << QString::fromUtf8("2π") << QString::fromUtf8("2½π") << QString::fromUtf8("3π");
customPlot->xAxis2->setAutoTicks(false);
customPlot->xAxis2->setAutoTickLabels(false);
customPlot->xAxis2->setTickVector(piTicks);
customPlot->xAxis2->setTickVectorLabels(piLabels);
// add title layout element:
customPlot->plotLayout()->insertRow(0);
customPlot->plotLayout()->addElement(0, 0, new QCPPlotTitle(customPlot, "Way too many graphs in one plot"));
// set labels:
customPlot->xAxis->setLabel("Bottom axis with outward ticks");
customPlot->yAxis->setLabel("Left axis label");
customPlot->xAxis2->setLabel("Top axis label");
customPlot->yAxis2->setLabel("Right axis label");
// make ticks on bottom axis go outward:
customPlot->xAxis->setTickLength(0, 5);
customPlot->xAxis->setSubTickLength(0, 3);
// make ticks on right axis go inward and outward:
customPlot->yAxis2->setTickLength(3, 3);
customPlot->yAxis2->setSubTickLength(1, 1);
//2、日期和时间数据曲线

// set locale to english, so we get english month names:
  customPlot->setLocale(QLocale(QLocale::English, QLocale::UnitedKingdom));
  // seconds of current time, we'll use it as starting point in time for data:
  double now = QDateTime::currentDateTime().toTime_t();
  srand(8); // set the random seed, so we always get the same random data
  // create multiple graphs:
  for (int gi=0; gi<5; ++gi)
  {
    customPlot->addGraph();
    QPen pen;
    pen.setColor(QColor(0, 0, 255, 200));
    customPlot->graph()->setLineStyle(QCPGraph::lsLine);
    customPlot->graph()->setPen(pen);
    customPlot->graph()->setBrush(QBrush(QColor(255/4.0*gi,160,50,150)));
    // generate random walk data:
    QVector<double> time(250), value(250);
    for (int i=0; i<250; ++i)
    {
      time[i] = now + 24*3600*i;
      if (i == 0)
        value[i] = (i/50.0+1)*(rand()/(double)RAND_MAX-0.5);
      else
        value[i] = fabs(value[i-1])*(1+0.02/4.0*(4-gi)) + (i/50.0+1)*(rand()/(double)RAND_MAX-0.5);
    }
    customPlot->graph()->setData(time, value);
  }
  // configure bottom axis to show date and time instead of number:
  customPlot->xAxis->setTickLabelType(QCPAxis::ltDateTime);
  customPlot->xAxis->setDateTimeFormat("MMMM\nyyyy");
  // set a more compact font size for bottom and left axis tick labels:
  customPlot->xAxis->setTickLabelFont(QFont(QFont().family(), 8));
  customPlot->yAxis->setTickLabelFont(QFont(QFont().family(), 8));
  // set a fixed tick-step to one tick per month:
  customPlot->xAxis->setAutoTickStep(false);
  customPlot->xAxis->setTickStep(2628000); // one month in seconds
  customPlot->xAxis->setSubTickCount(3);
  // apply manual tick and tick label for left axis:
  customPlot->yAxis->setAutoTicks(false);
  customPlot->yAxis->setAutoTickLabels(false);
  customPlot->yAxis->setTickVector(QVector<double>() << 5 << 55);
  customPlot->yAxis->setTickVectorLabels(QVector<QString>() << "Not so\nhigh" << "Very\nhigh");
  // set axis labels:
  customPlot->xAxis->setLabel("Date");
  customPlot->yAxis->setLabel("Random wobbly lines value");
  // make top and right axes visible but without ticks and labels:
  customPlot->xAxis2->setVisible(true);
  customPlot->yAxis2->setVisible(true);
  customPlot->xAxis2->setTicks(false);
  customPlot->yAxis2->setTicks(false);
  customPlot->xAxis2->setTickLabels(false);
  customPlot->yAxis2->setTickLabels(false);
  // set axis ranges to show all data:
  customPlot->xAxis->setRange(now, now+24*3600*249);
  customPlot->yAxis->setRange(0, 60);
  // show legend:
  customPlot->legend->setVisible(true);
3、曲线、柱形图、统计图...
//到目前为止,我们为图像添加曲线都是使用

QCustomPlot::addGraph();
QCustomPlot::graph();

//其实,除了QCPGraph ,QCustomPlot 还提供了多个画图类:

QCPCurve:与QCPGraph 类似,差别在于它是用于展示参数化曲线,可以有循环。

QCPBars:柱形图,如果有多个QCPBars ,可以依次重叠。

QCPStatisticalBox、QCPColorMap、QCPFinancial
与QCPGraph 不同的是,这些画图类在添加到QCustomPlot 的时候需要使用new创建一个实例,而不能直接
addPlottable


//简单例子如下:
QCPBars *myBars = new QCPBars(customPlot->xAxis, customPlot->yAxis);
customPlot->addPlottable(myBars);
// now we can modify properties of myBars:
myBars->setName("Bars Series 1");
QVector<double> keyData;
QVector<double> valueData;
keyData << 1 << 2 << 3;
valueData << 2 << 4 << 8;
myBars->setData(keyData, valueData);
customPlot->rescaleAxes();
customPlot->replot();
五、绘图自适应
//改变坐标范围
QCustomPlot *customplot; customplot->setInteraction(QCP::iRangeDrag,true);


//使控件能够拖拉。
customplot->axisRect()->setRangeDrag(Qt::Vertical);// Qt::Horizontal


//使控件只能在某一方向上拖拉,默认是水平和垂直都支持。
customplot->setInteraction(QCP::iRangeZoom,true);


//使控件能够伸缩。
customplot->axisRect()->setRangeZoomAxes(QCPAxis *  horizontal, QCPAxis *  vertical);


//设置伸缩的坐标轴。
customplot->axisRect()->setRangeZoom();


//设置伸缩的方向。默认水平和垂直都可以。
customplot->axisRect()->setRangeZoomFactor();


//设置伸缩比例,可设置成一样的,也可分别对水平和垂直进行设置。

//选择图元
customplot->setInteraction(QCP::iSelectPlottables,true);
将图元设置成可选择的。
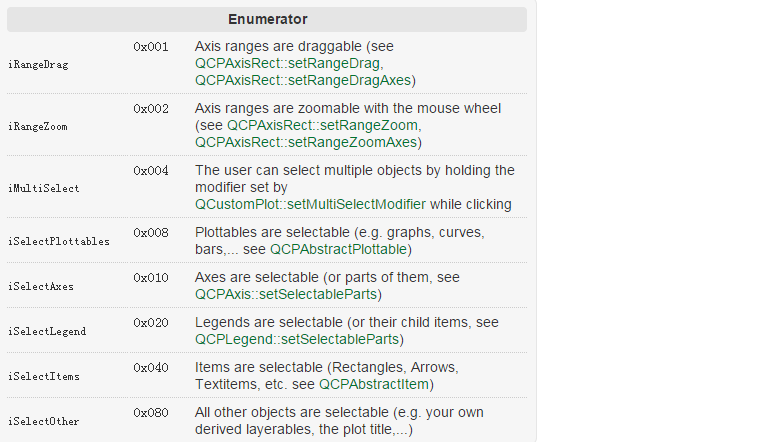
//在setInteraction函数中可开启的有上图这些。
customplot->graph()->setSelected(bool);


//可通过setSelected设置图元能否被选中。
customplot->deselectAll();


//取消所有选中。
//被选中的图元的属性可通过以下设置:
QCPGraph::setSelectedPen,
QCPGraph::setSelectedBrush, QCPAxis::setSelectedLabelFont, QCPAxis::setSelectedBasePen, QCPItemText::setSelectedColor


//QCPAxis 由刻度、数值、标签组成,每部分都可以单独选中,因此通过:
customplot->xAxis->setSelectableParts();


//参数可以是
QCPAxis::spNone, QCPAxis::spAxis, QCPAxis::spTickLabels, and QCPAxis::spAxisLabel
//的并集


//QCustomPlot 支持低级的响应信号,如:
QCustomPlot::mouseDoubleClick, mousePress, mouseMove, mouseRelease, and mouseWheel


//以及高级的,如:
QCustomPlot::plottableClick, plottableDoubleClick, itemClick, itemDoubleClick, axisClick, axisDoubleClick, legendClick, legendDoubleClick, titleClick, and titleDoubleClick
六、基本图形元件
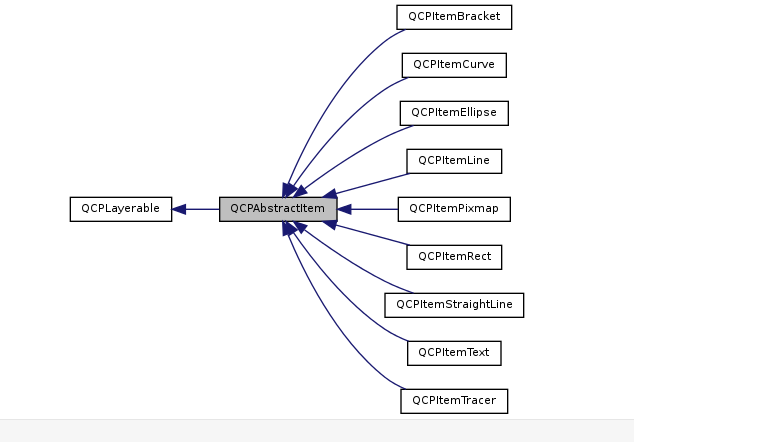
1、QCustomPlot提供文字、箭头、连线、图片等图形元件,以满足用户需要。它们都是继承于QCPAbstractItem这个基类。
继承关系如下:
//看官网上的例子:
// add the text label at the top:
QCPItemText *textLabel = new QCPItemText(customPlot);
customPlot->addItem(textLabel);
textLabel->setPositionAlignment(Qt::AlignTop|Qt::AlignHCenter);
textLabel->position->setType(QCPItemPosition::ptAxisRectRatio);
textLabel->position->setCoords(0.5, 0); // place position at center/top of axis rect
textLabel->setText("Text Item Demo");
textLabel->setFont(QFont(font().family(), 16)); // make font a bit larger
textLabel->setPen(QPen(Qt::black)); // show black border around text

// add the arrow:
QCPItemLine *arrow = new QCPItemLine(customPlot);
customPlot->addItem(arrow);
arrow->start->setParentAnchor(textLabel->bottom);
arrow->end->setCoords(4, 1.6); // point to (4, 1.6) in x-y-plot coordinates
arrow->setHead(QCPLineEnding::esSpikeArrow);
代码比较简单,同时可以看到,但我们拖拉或者缩放图像的时候,箭头会一直固定在(4, 1.6)位置。可以查阅QCPAbstractItem 和QCPItemPosition 获取更多信息。
2、设置元件在整个QCustomPlot可见:
setClipToAxisRect(false);
或者可以设置所在的矩形区域:
void QCPAbstractItem::setClipAxisRect ( QCPAxisRect * rect);
通常情况下,两个函数是一起使用的。
七、使用OpenGl
qcustomplot支持opengl绘制,然后我们开启qcustomplot的opengl。不过需要开启QT的opengl模块,同时需要安装glut库,由于GLUT的作者已经很久没更新了(最后更新于2001年!)所以其他人另外做了一个接口兼容GLUT的freeglut库,开源而且一直在维护中。freeglut是glut的超集,支持glut所有的api,跨平台(MS-Win,Linux,Mac OS均支持),并且有长期维护,十分可靠。所以我们继续修改代码让其支持opengl能够利用显卡加速的功能。需要支持opengl需要进行如下修改:
(一)准备引入opengl
在.pro 文件中添加 QT += opengl
DEFINES += QCUSTOMPLOT_USE_OPENGL 模块支持。
(二)配置相关库
添加qt中freeglut库的支持,根据自己是使用msvc还是mingw选择不同的配置方式。
Qt包含了opengl模块支持opengl绘制,但是不包含glut工具库,如果要使用glut库,该怎么做呢?下面来简述一下Qt下怎么安装glut库。OpenGL只是一个标准,它的实现一般自带在操作系统里,只要确保显卡驱动足够新就可以使用。如果需要在程序里直接使用OpenGL,会有很多非常恶心的预备工作要做,而且可能还要专门为平台的差异写一些代码。要跳过这些工作,可以用一个utility库,直接使用它提供的函数,就不用操心那些细节了。这样的库新一点的有GLEW,因为开源所以安装相对方便(大不了丢进去一起编译),但各种教程和书里常见的是闭源的GLUT。由于GLUT的作者已经很久没更新了(最后更新于2001年!)。
所以其他人另外做了一个接口兼容GLUT的freeglut库,开源而且一直在维护中。freeglut是glut的超集,支持glut所有的api,跨平台(MS-Win,Linux,Mac OS均支持),并且有长期维护,十分可靠。
1.下载
Linux 下安装
Linux 下一般使用开源的 freeglut,安装相对于 windows 比较方便,比如 Ubuntu 下安装只要一行命令:
$ sudo apt-get install build-essential freeglut3 freeglut3-dev binutils-gold
Windows 下安装
1)需要glut库的请下载 glut-3.7.6-bin.zip (GLUT for Win32 dll, lib and header file )(已经十几年没更新过了所以就是这个版本了!)
下载地址:https://user.xmission.com/~nate/glut.html
2)freeglut库里面有两个版本,都包含32和64位的,根据Qt的配置自己选择:
下载地址:http://www.transmissionzero.co.uk/software/freeglut-devel/
Visual Studio:freeglut 3.0.0 MSVC Package
MinGW :freeglut 3.0.0 MinGW Package
2.环境配置:
msvc环境配置:(64位版本):
1) .解压后将freeglut文件中的bin文件下的x64文件下的freeglut.dll,拷贝至QT的安装路径D:\Qt\Qt5.9.4\5.9.4\msvc2017_64\bin目录下;
2) .解压后将freeglut文件中的include文件下的GL文件,拷贝至QT的安装路径D:\Qt\Qt5.9.4\5.9.4\msvc2017_64\include目录下;
3) .解压后将freeglut文件中的lib文件下的x64文件下的freeglut.lib,安装路径D:\Qt\Qt5.9.4\5.9.4\msvc2017_64\lib目录下;
MinGW环境配置(32位版本):
1) .解压后将freeglut文件中的bin文件下的freeglut.dll,拷贝至QT的安装路径D:\Qt\Qt5.9.4\5.9.4\mingw53_32\bin目录下;
2) .解压后将freeglut文件中的include文件下的GL文件,拷贝至QT的安装路径D:\Qt\Qt5.9.4\5.9.4\mingw53_32\include目录下;
3) .解压后将freeglut文件中的lib文件下的libfreeglut.a、libfreeglut_static.a文件,拷贝至QT的安装路径D:\Qt\Qt5.9.4\5.9.4\mingw53_32\lib目录下;
当然也可以相对路径,根据库所在的目录配置。
3.项目工程配置
切换到自己的程序中,在 **.pro 文件中添加:
QT += opengl
MSVC版本:
#第一种就是直接加据对路径
LIBS += D:/Qt/Qt5.12.6/5.12.6/msvc2017_64/lib/freeglut.lib D:/Windows/Kits/10/Lib/10.0.17763.0/um/x64/OpenGL32.Lib
#第二种就是直接加库文件,这个的前提是你的库文件必须在系统目录或者工程编译生成目录build-untitled-Desktop_Qt_5_12_6_MSVC2017_64bit-Debug下
LIBS += freeglut.lib OpenGL32.Lib
#第三种就是多个库在同一个文件夹下的时候,连接使用
LIBS += -LD:/Qt/Qt5.12.6/5.12.6/msvc2017_64/lib -lfreeglut -lOpenGL32
#第四种就是相对路径./表示生成目录build-untitled-Desktop_Qt_5_12_6_MSVC2017_64bit-Debug
LIBS += -L./ -lfreeglut -lOpenGL32
MinGW版本:
LIBS += -LD:/Qt/Qt5.12.6/5.12.6/mingw73_32/lib -llibfreeglut -lopengl32
LIBS模板:
-
#$$OUT_PWD表示编译生成的那个目录,$$PWD表示.pro文件的那个目录
-
#win32:CONFIG(release, debug|release): LIBS += -L$$OUT_PWD/../../../projects/mylib/release/ -lmylib
-
#else:win32:CONFIG(debug, debug|release): LIBS += -L$$OUT_PWD/../../../projects/mylib/debug/ -lmylib
-
#else:unix: LIBS += -L$$OUT_PWD/../../../projects/mylib/ -lmylib
还需要加入OpenGL32.lib库。
4.开始使用
在*****.cpp中加入#include <GL/glut.h>,这样就可以使用glut中的函数了。
5.使用前初始化
记得调用初始化函数后,才能使用glut的库。
glutInit(&argc, argv);
6. 使用实例
下面来看一个简单的例子:
#include <windows.h>
#include <GL/glut.h>
void init(void)
{
  glClearColor(1.0, 1.0, 1.0, 0.0);
  glMatrixMode(GL_PROJECTION);
  gluOrtho2D(0.0, 200.0, 0.0, 160.0);
}
void lineSegment(void)
{
  glClear(GL_COLOR_BUFFER_BIT);
  glColor3f(1.0, 0.0, 0.0);
  glBegin(GL_LINES);
  glVertex2i (180, 15);
  glVertex2i (10, 145);
  glEnd();
  glFlush();
}

int main(int argc, char **argv)
{
  glutInit(&argc, argv);
  glutInitDisplayMode(GLUT_SINGLE | GLUT_RGB);
  glutInitWindowPosition(50, 100);
  glutInitWindowSize(400, 300);
  glutCreateWindow("Example OpenGL Program");
  init();
  glutDisplayFunc(lineSegment);
  glutMainLoop();
}
(三)设置开启OpenGL模式
完成上述配置后,在工程代码中XxwCustomPlot构造函数中,调用setOpenGl(true);
开启qcustomplot的opengl模式。下面qDebug是打印当前qcustomplot模式是不是opengl模式。显示true则表示是opengl模式。
m_pCustomPlot->setOpenGl(true);
qDebug() <<"Is start opengl?=" << m_pCustomPlot->openGl();
开启后我们再看一下效果,可以看到GPU引擎已经开启,同时使用率为20%左右,而上面没开启之前则任务栏GPU列无任何显示:CPU使用率已经下降到20%左右。应为其他数据逻辑是使用CPU在处理的。