官网图例https://www.qcustomplot.com/index.php/demos/simpledemo
QCustomPlot* customPlot = ui->customPlot_6;
// 添加两个graph
customPlot->addGraph();
customPlot->graph(0)->setPen(QPen(Qt::blue)); // 第一条曲线颜色
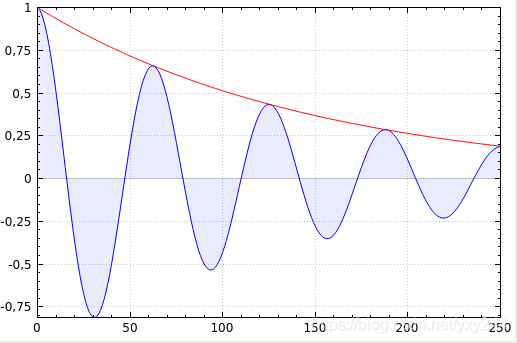
customPlot->graph(0)->setBrush(QBrush(QColor(0, 0, 255, 20))); // 第一条曲线和0轴围成区域填充的颜色
customPlot->addGraph();
customPlot->graph(1)->setPen(QPen(Qt::red)); // 第二条曲线颜色
// 生成数据
QVector<double> x(251), y0(251), y1(251);
for (int i=0; i<251; ++i)
{
x[i] = i;
y0[i] = qExp(-i/150.0)*qCos(i/10.0); // 指数衰减的cos
y1[i] = qExp(-i/150.0); // 衰减指数
}
// 配置右侧和顶部轴显示刻度,但不显示标签:
customPlot->xAxis2->setVisible(true);
customPlot->xAxis2->setTickLabels(false);
customPlot->yAxis2->setVisible(true);
customPlot->yAxis2->setTickLabels(false);
// 让左边和下边轴与上边和右边同步改变范围
connect(customPlot->xAxis, SIGNAL(rangeChanged(QCPRange)), customPlot->xAxis2, SLOT(setRange(QCPRange)));
connect(customPlot->yAxis, SIGNAL(rangeChanged(QCPRange)), customPlot->yAxis2, SLOT(setRange(QCPRange)));
// 设置数据点
customPlot->graph(0)->setData(x, y0);
customPlot->graph(1)->setData(x, y1);
// 让范围自行缩放,使图0完全适合于可见区域:
customPlot->graph(0)->rescaleAxes();
// 图1也是一样自动调整范围,但只是放大范围(如果图1小于图0):
customPlot->graph(1)->rescaleAxes(true);
// 允许用户用鼠标拖动轴范围,用鼠标滚轮缩放,点击选择图形:
customPlot->setInteractions(QCP::iRangeDrag | QCP::iRangeZoom | QCP::iSelectPlottables);
customPlot->replot();
(1)上下轴,左右轴范围同步
利用rangeChanged信号传递轴范围QCPRange,范围改变时将xAxis的范围传给xAxis2,yAxis也是,就能实现轴范围同步了。
connect(customPlot->xAxis, SIGNAL(rangeChanged(QCPRange)), customPlot->xAxis2, SLOT(setRange(QCPRange)));
connect(customPlot->yAxis, SIGNAL(rangeChanged(QCPRange)), customPlot->yAxis2, SLOT(setRange(QCPRange)));
(2)自动调整范围,使数据全部可见。
调用rescaleAxes (bool onlyEnlarge = false)重新调整与此绘图表关联的键和值轴,以显示所有的数据
onlyEnlarge 默认false,表示范围可以缩小放大,如果为true表示只能放大,而不会缩小范围。
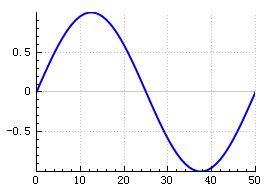
例如曲线:
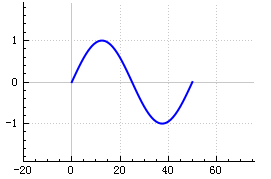
调用 customPlot->graph(0)->rescaleAxes();后范围被缩小了,曲线正好占满整个区域,但是调用customPlot->graph(0)->rescaleAxes(true)就不会有变化,因为区域不会缩小。
利用这点可以通过多次调用rescaleaxis来完整地显示多个graph的数据。让graph(0)自动缩放rescaleAxes(),在graph(0)范围的基础上rescaleAxes(true)只会扩大范围或不变而不缩小,这样最终能够显示graph(n)所有的数据
// 让范围自行缩放,使图0完全适合于可见区域:
customPlot->graph(0)->rescaleAxes();
// 图1也是一样自动调整范围,但只是放大或不变范围
customPlot->graph(1)->rescaleAxes(true);
// 图2也是一样自动调整范围,但只是放大或不变范围
customPlot->graph(2)->rescaleAxes(true);
// 图3也是一样自动调整范围,但只是放大或不变范围
customPlot->graph(2)->rescaleAxes(true);
。。。