若该文为原创文章,未经允许不得转载
原博主博客地址:https://blog.csdn.net/qq21497936
原博主博客导航:https://blog.csdn.net/qq21497936/article/details/102478062
本文章博客地址:http://blog.csdn.net/qq21497936/article/details/77847820
各位读者,知识无穷而人力有穷,要么改需求,要么找专业人士,要么自己研究
目录
QCustomPlot v2.0.1 定制文本下标Demo(2019年8月27日补充)
Qt开发专栏:三方库开发技术(点击传送门)
Qt之QCustomPlot范例
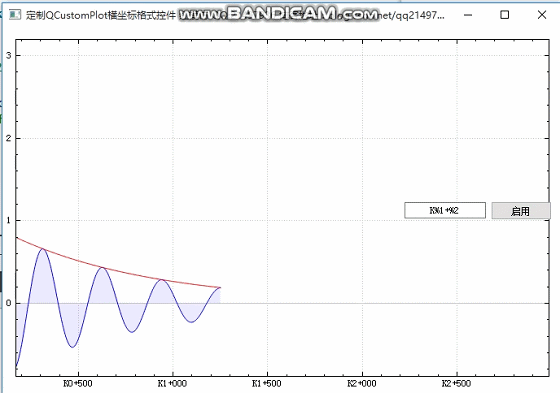
效果

Demo下载地址
http://download.csdn.net/download/qq21497936/9964235
QCustomPlot v2.0.1 定制文本下标Demo(2019年8月27日补充)
(注意:QCustomPlot源码是不支持下标文本的。)
前言
本文使用QCustomPlot做一个QCustomPlot范例,实现一些基本的操作。
QCustomPlot介绍
QCustomPlot是一个小型的qt画图标类,效果可以,易用,只需要在项目中加入头文件qcustomplot.h和qcustomplot.cpp文件,然后使一个widget提升为QCustomPlot类,即可使用。
QCustomPlot官网:http://www.qcustomplot.com/
QCustomPlot下载地址:http://www.qcustomplot.com/index.php/download
QCustomPlot帮助文件
QCustomPlot源码包中,带有qt帮助文件,将其添加进qt帮助文件,添加过程如下图:


添加完后,即可在qt帮助文件中查看QCustomPlot类相关信息。
本人对于QCustomPlot理解
QCustomPlot是一个二维图表,我们姑且认为其有坐标轴图层和若干其他图层。
坐标轴-图层
坐标轴图形是横轴和纵轴的图层,可设置各种属性,下表是本Demo使用到的属性设置
//下标的格式:数字或者时钟
   ui->customPlot->xAxis->setTickLabelType(QCPAxis::ltNumber);
   //设置时钟下标格式
//   ui->customPlot->xAxis->setDateTimeFormat("hh:mm:ss");
   ui->customPlot->xAxis->setRange(0,8);
   //是否允许自动下标
   ui->customPlot->xAxis->setAutoTickStep(false);
   //手动设置下标,要先禁止自动下标,隔多少间距显示下标
   ui->customPlot->xAxis->setTickStep(1);
   //设置steps之间的间隔杠
   ui->customPlot->xAxis->setAutoSubTicks(false);
   ui->customPlot->xAxis->setSubTickCount(9);//9+1
//   ui->customPlot->axisRect()->setupFullAxesBox();
   //设置横轴标签
   ui->customPlot->xAxis->setLabel("时间(单位s)");
   //设置纵轴范围
   ui->customPlot->yAxis->setRange(-1,1);
   //设置纵轴标签仅使用1个字会报换行符错误后面加个空格
   ui->customPlot->yAxis->setLabel("大小");
   ui->customPlot->yAxis->setAutoTickStep(false);
   ui->customPlot->yAxis->setTickStep(0.2);
   ui->customPlot->yAxis->setAutoSubTicks(false);
   ui->customPlot->yAxis->setSubTickCount(1);//1+1
若干其他-图层
使用其他图层之前,必须使用函数addGraph()先添加图层,添加的图层从序列号0开始计层数,使用函数graph()获取指定图层的指针,获取的图层类似于一张图画;
使用图层指针可以设置画笔setPen()-决定线条的颜色,设置画刷setBrush()-决定其点连成的线到X轴的颜色,实现两条线之间局域用画刷填充,我们需要设置主从图层,从主图层的点画向从图层的点,此时从图层的画刷设置为透明(缺省为透明,若未修改可不设置),然后设置主图层的画刷颜色为我们需要填充的颜色,并使用函数setChannelFillGraph()从使用主图层的画刷画向从图层,从而填充两者点之间的区域。
在图层上画点,使用addData()函数,图层会将每相邻点之间自动用线调连接起来,当点的数据超出显示范围之后,最好使用removeDataBefore()删除范围外的数据,不然内存将一直增加,QCustomPlot不会自己删除。
关键画点效果代码
voidMainWindow::realtimeDataSlot()
{
   //每次刷新点的坐标,并且刷新qt图标的界面
   double key = (double)(_elapsedTimer.elapsed() + _begin) / 1000;
   //10ms更新一个点
   if(key - _lastPointKey > 0.01)
{
        //sin(key*1.6+cos(key*1.7)*2)*10+sin(key*1.2+0.56)*20+26;
       double value0 = qSin(key);
        //sin(key*1.3+cos(key*1.2)*1.2)*7+sin(key*0.9+0.26)*24+26;
       double value1 = qCos(key);
       if(_start && !_pause)
       {
           if(ui->customPlot->graph(0)->visible()&&ui->customPlot->graph(1)->visible())
               ui->customPlot->graph(0)->setBrush(QBrush(Qt::yellow));
           else
               ui->customPlot->graph(0)->setBrush(QBrush(Qt::transparent));
           //画线
           ui->customPlot->graph(0)->addData(key,value0);
           ui->customPlot->graph(1)->addData(key,value1);
           //画点
           ui->customPlot->graph(2)->clearData();
           ui->customPlot->graph(2)->addData(key,value0);
           //蓝色图层是否可见
           if(ui->customPlot->graph(0)->visible())
           {
               //统一是x的格式,末尾为0也显示
               QString zzz=QString("%1").arg(key);
               for(int index = zzz.size() - zzz.lastIndexOf("."); index < 4; index++)
               {
                   zzz += "0";
               }
               ui->label_maleX->setText(QString("%1").arg(zzz));
//在msvc2010编译上会出现错误:9个QString::arg匹配和 mid右侧不是联合
//             QString strValue0=QString("%1").arg(value0,4,10,QChar('0')).mid(0,6);
               QString strValue0=QString("%1").arg(value0).mid(0,6);
               strValue0 =
                       strValue0.startsWith("-")? strValue0.mid(0,6):strValue0.mid(0,5);
               ui->label_maleY->setText(strValue0);
           }else
           {
               ui->label_maleX->setText("");
               ui->label_maleY->setText("");
           }
           ui->customPlot->graph(3)->clearData();
           ui->customPlot->graph(3)->addData(key,value1);
           //红色图层是否可见
           if(ui->customPlot->graph(1)->visible())
           {
               //统一是x的格式,末尾为0也显示
               QString zzz = QString("%1").arg(key);
               for(int index = zzz.size() - zzz.lastIndexOf("."); index < 4; index++)
               {
                   zzz += "0";
               }
               ui->label_femaleX->setText(QString("%1").arg(zzz));
      //在msvc2010编译上会出现错误:9个QString::arg匹配和 mid右侧不是联合
//               QString strValue1 = QString("%1").arg(value1,4,10,'0').mid(0,6);
               QString strValue1 = QString("%1").arg(value1).mid(0,6);
               strValue1 = strValue1.startsWith("-") ?strValue1.mid(0,6):strValue1.mid(0,5);
               ui->label_femaleY->setText(strValue1);
           }else
           {
               ui->label_femaleX->setText("");
               ui->label_femaleY->setText("");
           }
           //移除图标已逝去的点,避免其占用内存
           ui->customPlot->graph(0)->removeDataBefore(key-8);
           ui->customPlot->graph(1)->removeDataBefore(key-8);
           //rescalevalue(vertical)axistofitthecurrentdata:
           //根据该图像最高点和最低点,缩放Y周
//           ui->customPlot->graph(0)->rescaleValueAxis();
//根据该图像最高点和最低点,缩放Y周以最后一个为主,所以这里只加入边界,true
//           ui->customPlot->graph(1)->rescaleValueAxis(true);
           _lastPointKey=key;
       }
   }
   //当显示的X轴超过8的时候,X坐标范围开始移动
   if(key > 8.0)
   {
       ui->customPlot->xAxis->setRange(key+0.01,8,Qt::AlignRight);
   }
   ui->customPlot->replot();

   //计算每秒的帧数
   static double lastFpsKey;
   static int frameCount;
   ++frameCount;
   //取2秒的平衡均值
   if(key-lastFpsKey > 2)
   {
       //设置状态栏显示FPS
       ui->statusBar->showMessage(
             QString("%1FPS")
             .arg(frameCount/(key-lastFpsKey), 0, 'f', 0));
       lastFpsKey = key;
       frameCount = 0;
   }
}
QCustomPlot官方范例
QCustomPlot提供了4个例程,这里初入手的特别注意范例plot-examples,其包含了多种效果,修改代码的数字实现不同的demo,如何修改如下图:

原博主博客地址:https://blog.csdn.net/qq21497936
原博主博客导航:https://blog.csdn.net/qq21497936/article/details/102478062
本文章博客地址:http://blog.csdn.net/qq21497936/article/details/77847820