reportlab 用法——饼图:
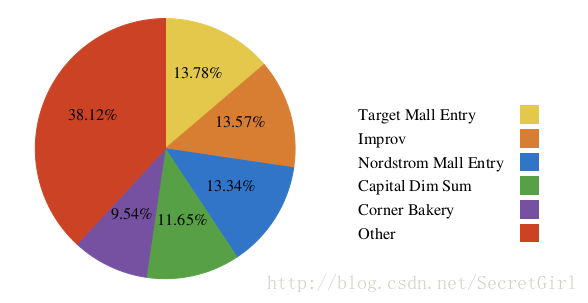
带图例的饼图画法
Pie chart
from reportlab.graphics.charts.piecharts import Pie
from reportlab.graphics.charts.legends import Legend
my_colors = [   HexColor(0xe3c84c),
        HexColor(0xd87e33),
        HexColor(0x3075c7),
        HexColor(0x58a045),
        HexColor(0x7751a1),
        HexColor(0xcc4224)
        ]
d = Drawing(200,100)
pc = Pie()
pc.x = 65
pc.y = 65
pc.width = 800
pc.height = 800
pc.data = pie_data
pc.labels = pie_label
##legends
lg = Legend()
lg.x = 1060
lg.y = 600
lg.dx = 60
lg.dy = 60
lg.deltax = 650
lg.deltay = 15
lg.dxTextSpace = 50
lg.columnMaximum = 6
lg.fontSize = 60
lg.colorNamePairs = zip(my_colors,pie_legend)
lg.alignment = 'left'
lg.fontSize = 50
lg.strokeColor = colors.white #legend边框颜色

pc.slices.strokeWidth=0.5
pc.slices.fontSize = 50

pc.slices[0].labelRadius = 0.6
pc.slices[1].labelRadius = 0.6
pc.slices[2].labelRadius = 0.5
pc.slices[3].labelRadius = 0.6
pc.slices[4].labelRadius = 0.6
pc.slices[5].labelRadius = 0.6

for i in range(0,6):
    pc.slices[i].fillColor = my_colors[i]
    pc.slices[i].strokeColor = my_colors[i]
    #pc.slices[i].labelRadius = 1.75
d.add(lg)
d.add(pc)
d.drawOn(c,475,1900)