因为cityscapes数据集上的标签是由json格式组成,因此需要对json格式进行读取,然后发现cityscapes数据集上的类别信息在json中的“object”下的“label”中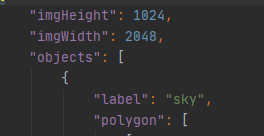
博主这里只统计了19个类别的分布,并且省略了背景,如果需要34类别,自行在相应地方添加即可
将base_path中的train改为test、val则统计相对应数据集的分布
所以最终代码为
"""
数据集分析
"""
import json
import os
from matplotlib import pyplot as plt
def main():
base_path = "gtFine/train/"
filelist = os.listdir(base_path)
filelist.sort()
c0_count, c1_count, c2_count, c3_count, c4_count, c5_count, c6_count, c7_count, c8_count, c9_count, c10_count, c11_count, c12_count, c13_count, c14_count, c15_count, c16_count, c17_count, c18_count, c19_count = 0, 0, 0, 0, 0, 0, 0, 0, 0, 0, 0, 0, 0, 0, 0, 0, 0, 0, 0, 0
for names in filelist:
filelists = os.listdir(base_path+"/"+"{}".format(names)+"/")
for name in filelists:
filename = os.path.splitext(name)[0]
filename_suffix = os.path.splitext(name)[1]
if filename_suffix == ".json":
fullname = base_path + "{}".format(names)+ "/" + filename + filename_suffix
dataJson = json.load(open("{}".format(fullname), encoding='UTF-8'))
label_name = dataJson["objects"]
c0, c1, c2, c3, c4, c5, c6, c7, c8, c9, c10, c11, c12, c13, c14, c15, c16, c17, c18, c19 = 0, 0, 0, 0, 0, 0, 0, 0, 0, 0, 0, 0, 0, 0, 0, 0, 0, 0, 0, 0
for _ in label_name:
c0 = c0 + 1 if _["label"] == "road" else c0
c1 = c1 + 1 if _["label"] == "sidewalk" else c1
c2 = c2 + 1 if _["label"] == "building" else c2
c3 = c3 + 1 if _["label"] == "wall" else c3
c4 = c4 + 1 if _["label"] == "fence" else c4
c5 = c5 + 1 if _["label"] == "pole" else c5
c6 = c6 + 1 if _["label"] == "traffic light" else c6
c7 = c7 + 1 if _["label"] == "traffic sign" else c7
c8 = c8 + 1 if _["label"] == "vegetation" else c8
c9 = c9 + 1 if _["label"] == "terrain" else c9
c10 = c10 + 1 if _["label"] == "sky" else c10
c11 = c11 + 1 if _["label"] == "person" else c11
c12 = c12 + 1 if _["label"] == "rider" else c12
c13 = c13 + 1 if _["label"] == "car" else c13
c14 = c14 + 1 if _["label"] == "truck" else c14
c15 = c15 + 1 if _["label"] == "bus" else c15
c16 = c16 + 1 if _["label"] == "train" else c16
c17 = c17 + 1 if _["label"] == "motorcycle" else c17
c18 = c18 + 1 if _["label"] == "bicycle" else c18
c0_count = c0_count + c0
c1_count = c1_count + c1
c2_count = c2_count + c2
c3_count = c3_count + c3
c4_count = c4_count + c4
c5_count = c5_count + c5
c6_count = c6_count + c6
c7_count = c7_count + c7
c8_count = c8_count + c8
c9_count = c9_count + c9
c10_count = c10_count + c10
c11_count = c11_count + c11
c12_count = c12_count + c12
c13_count = c13_count + c13
c14_count = c14_count + c14
c15_count = c15_count + c15
c16_count = c16_count + c16
c17_count = c17_count + c17
c18_count = c18_count + c18
else:
pass
class_names = ['road', 'sidewalk', 'building', 'wall', 'fence', 'pole',
'traffic light', 'traffic sign', 'vegetation', 'terrain',
'sky', 'person', 'rider', 'car', 'truck', 'bus', 'train',
'motorcycle', 'bicycle']
class_num = [c0_count,
c1_count,
c2_count,
c3_count,
c4_count,
c5_count,
c6_count,
c7_count,
c8_count,
c9_count,
c10_count,
c11_count,
c12_count,
c13_count,
c14_count,
c15_count,
c16_count,
c17_count,
c18_count]
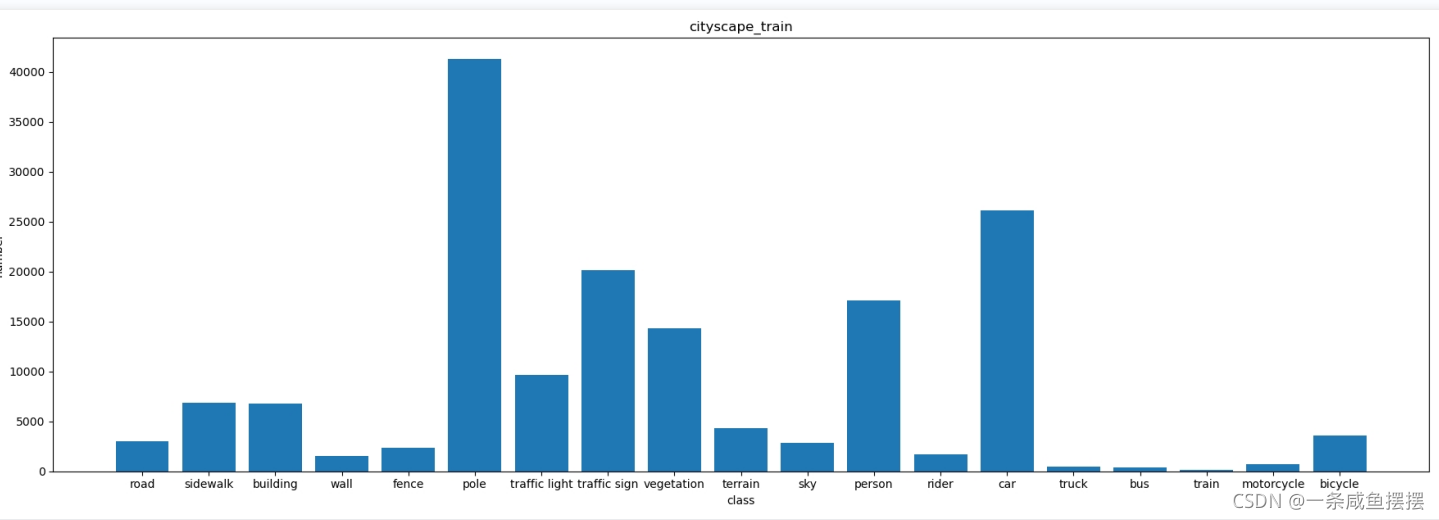
plt.title("cityscape_train"), plt.ylabel("number"), plt.xlabel("class"), plt.bar(class_names, class_num)
plt.show()
if __name__ == '__main__':
main()
最终输出结果: