前言
继续学习ROS2,最近把navigation2的路径规划部分学习了一遍,但是还没有进行测试,于是先把这个部分先空出来后面再总结。先写一个与避障有关系的如何自己发点云数据。
在nav2里面有一个非常重要的部分就是costmap部分,他决定了你的地图和障碍物信息,在costmap,costmap又分成了静态层,膨胀层,测距层,障碍层和体素(三位像素)层,英文原名分别是static layer, inflation layer, range layer, obstacle layer, and voxel layer
而障碍层和体素层订阅LaserScan话题和PointCloud2,就可以在costmap上生成障碍物信息,我想自己手写一个自定义点云数据来发布,这样可以自己定义障碍物在哪个地方,实现一些基本的测试。
环境
RO2 humble
Ubuntu22.04
navigation2
修改记录:
2023.2.24:补充了point_cloud2.create_cloud的函数说明
实现
点云数据类型包含了以下数据类型
uint32 height: 点云数据的高度,即点云数据有多少行。uint32 width: 点云数据的宽度,即点云数据有多少列。sensor_msgs/PointField[] fields: 一个数组,包含点云数据中每个点的属性信息,如x、y、z坐标、颜色信息等。sensor_msgs/PointField[] fields是一个数组,它包含了点云数据中每个点的属性信息。每个 PointField 表示一个点的属性,比如 x、y、z 坐标,颜色信息等。- PointField 包含以下字段:
string name: 属性的名称。
uint32 offset: 属性在点云数据中的偏移量,以字节为单位。
uint8 datatype: 属性的数据类型,如浮点数、整数等。
uint32 count属性的数量,如 RGB 颜色信息有 3 个值。
bool is_bigendian: 标识点云数据的字节序,是否为大端字节序。- 字节序指的是一个多字节数据在内存中存储的顺序。在计算机中,有两种常用的字节序:大端字节序和小端字节序。在大端字节序中,数据的高位字节存储在低地址处,而在小端字节序中,数据的低位字节存储在低地址处
uint32 point_step: 每个点占用的字节数,包括每个属性的字节数和对齐字节。uint32 row_step: 一行点云数据占用的字节数,等于width * point_step。uint8[] data: 点云数据的二进制表示,每个点按照fields中定义的顺序存储。
根据官方给出的示例代码,我们能够改出我们想要的点云数据代码
官方例程
# Copyright 2020 Evan Flynn
#
# Licensed under the Apache License, Version 2.0 (the "License");
# you may not use this file except in compliance with the License.
# You may obtain a copy of the License at
#
#     http://www.apache.org/licenses/LICENSE-2.0
#
# Unless required by applicable law or agreed to in writing, software
# distributed under the License is distributed on an "AS IS" BASIS,
# WITHOUT WARRANTIES OR CONDITIONS OF ANY KIND, either express or implied.
# See the License for the specific language governing permissions and
# limitations under the License.

import numpy as np

import rclpy
from rclpy.node import Node
from sensor_msgs.msg import PointCloud2
from sensor_msgs.msg import PointField
from sensor_msgs_py import point_cloud2
from std_msgs.msg import Header


class PointCloudPublisher(Node):

    rate = 30
    moving = True
    width = 100
    height = 100

    header = Header()
    header.frame_id = 'map'

    dtype = PointField.FLOAT32
    point_step = 16
    fields = [PointField(name='x', offset=0, datatype=dtype, count=1),
              PointField(name='y', offset=4, datatype=dtype, count=1),
              PointField(name='z', offset=8, datatype=dtype, count=1),
              PointField(name='intensity', offset=12, datatype=dtype, count=1)]

    def __init__(self):
        super().__init__('pc_publisher')
        self.publisher_ = self.create_publisher(PointCloud2, 'test_cloud', 10)
        timer_period = 1 / self.rate
        self.timer = self.create_timer(timer_period, self.timer_callback)
        self.counter = 0

    def timer_callback(self):
        self.header.stamp = self.get_clock().now().to_msg()
        x, y = np.meshgrid(np.linspace(-2, 2, self.width), np.linspace(-2, 2, self.height))
        z = 0.5 * np.sin(2*x-self.counter/10.0) * np.sin(2*y)
        points = np.array([x, y, z, z]).reshape(4, -1).T
        pc2_msg = point_cloud2.create_cloud(self.header, self.fields, points)
        self.publisher_.publish(pc2_msg)

        if self.moving:
            self.counter += 1


def main(args=None):
    rclpy.init(args=args)
    pc_publisher = PointCloudPublisher()
    rclpy.spin(pc_publisher)
    pc_publisher.destroy_node()
    rclpy.shutdown()


if __name__ == '__main__':
    main()
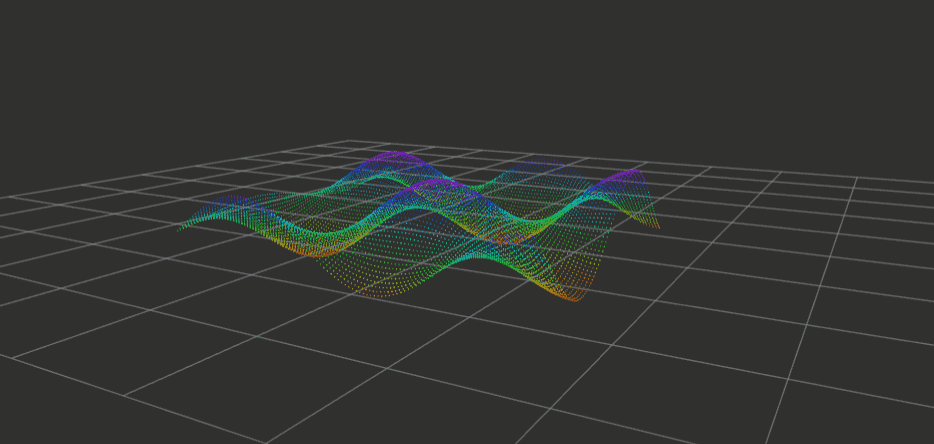
效果如下
解释
官方的代码其实看起来很容易理解的,他的话题每隔1/30s发布一次,即1/30s更新一次点云数据点,在初始化对象的时候,他先初始化其fields数据格式,并设置好点云数据的大小,偏移量,数据类型。
点云的数据头就用通用的self.header.stamp = self.get_clock().now().to_msg()得到即可
最关键的其实就是他点云数据的生成。
首先你要先设定你的xyz数据格式,他为了实现一个面波动的效果,因此不是特别容易理解,但最本质的原理其实就是要把你的点的坐标表示出来即可。
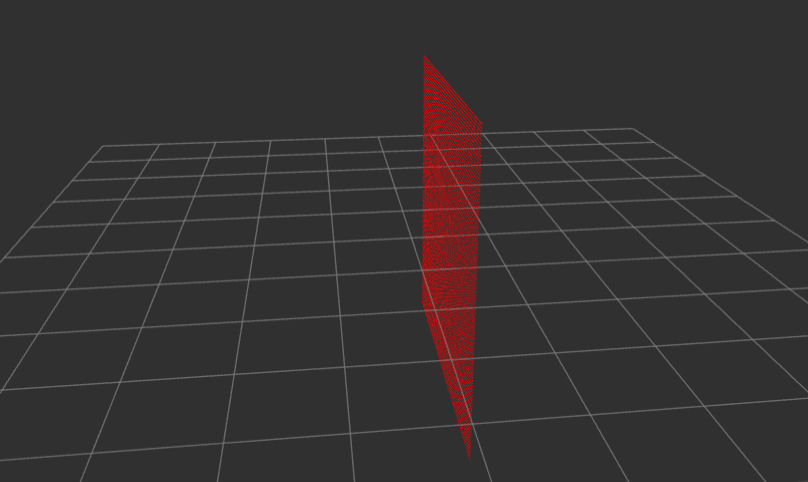
因此改写一个平面移动的点云数据也会显得比较简单,只需要改写最关键的xyz点的坐标即可
# 在-2到2之间按照均匀步长生成width和height个点
y, z = np.meshgrid(np.linspace(-2, 2, self.width),np.linspace(-2, 2, self.height))
# 按照正弦的速率来回移动
x = 0.5 * np.sin(np.ones((100, 100))-self.counter/10.0)
points = np.array([x, y, z, np.ones((100, 100))*255]).reshape(4, -1).T
贴几个讲这两个函数的代码
Numpy库:meshgrid() 函数
numpy之linspace()函数使用详解
效果如下:
这样,我们就可以让costmap中的体素层和障碍层订阅到障碍物信息,并让其在map上动态显示出来了。
补充:
这里把最关键的函数point_cloud2.create_cloud的参数补充一下,便于改成自己需要的样子
point_cloud2.create_cloud() 函数是sensor_msgs.msg.PointCloud2消息的一个帮助函数,它将一系列点的x、y、z坐标和其他属性打包到点云消息中。该函数接受以下参数:
header: 点云消息的头信息。
fields: 一个列表,其中包含PointField对象,描述要在点云中包含的每个属性的名称、数据类型、偏移量和数量。
points: 一个包含所有点的数组。每个点都是一个元组,包含x、y、z坐标和其他属性的值。
points例子如下:
前3个值表示 x、y 和 z 坐标
后3个值表示红、绿、蓝三个颜色通道的值。这个例子中的颜色值使用RGB颜色空间表示。
points = [(0.0, 0.0, 0.0, 255, 0, 0),
          (1.0, 1.0, 1.0, 0, 255, 0),
          (-1.0, -1.0, -1.0, 0, 0, 255)]