echarts图表y轴数据设置为固定值,等间距,如何自定义echarts图表y轴数据

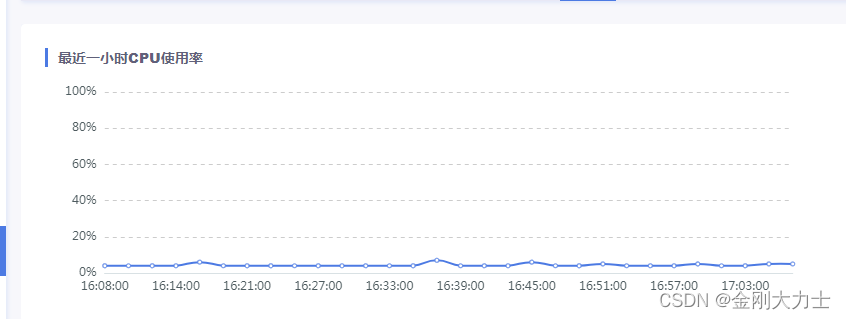
如图 将Y轴 设置为固定的0% 20% ----100%  话不多说直接上代码

                yAxis: {
                    type: 'value',
                    max: 100,//最大值
                    min: 0,//最小值
                    interval:20,//间隔
                    axisLine:{
                        show: false,
                        lineStyle:{
                            color:'#d9e1e4'
                        },
                    },
                    axisLabel:{
                        color:'#4e5b5f',
                        formatter: function (val) {//百分比显示
                            return val + '%';
                        }
                    },
                    axisTick:{
                        show:false,
                    },
                    splitLine:{
                        lineStyle:{
                            type:'dashed'
                        }
                    }

                },

猜你喜欢

转载自blog.csdn.net/qq_42177730/article/details/126608399