0 前言
StaMPS-Visualizer :由thho开发的用于可视化由StaMPS / MTI处理的DInSAR结果。
github地址:StaMPS-Visualizer
使用StaMPS_Visualizer需要配置好StaMPS,并安装好R和Rstudio
1 StaMPS_Visualizer 展示基线图
StaMPS_Visualizer 可以展示PS基线和SBAS基线
1.1 从SNAP中导出PS基线和SBAS基线数据
-
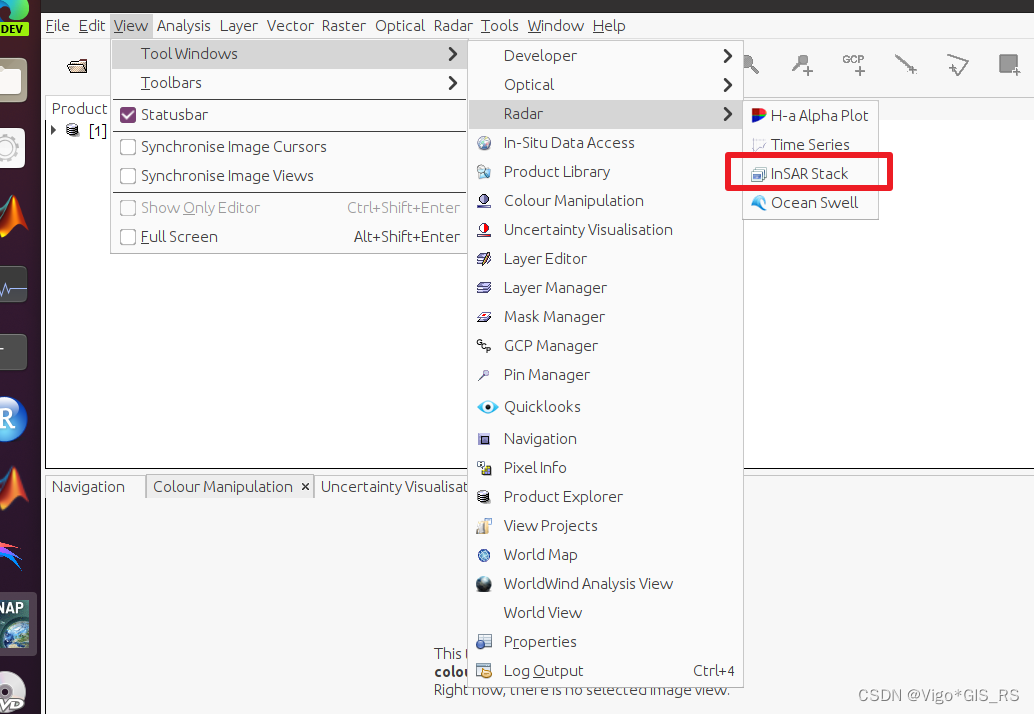
打开SNAP,导入stack数据,
View –> Tool Windows –> Radar –> InSAR Stack
-
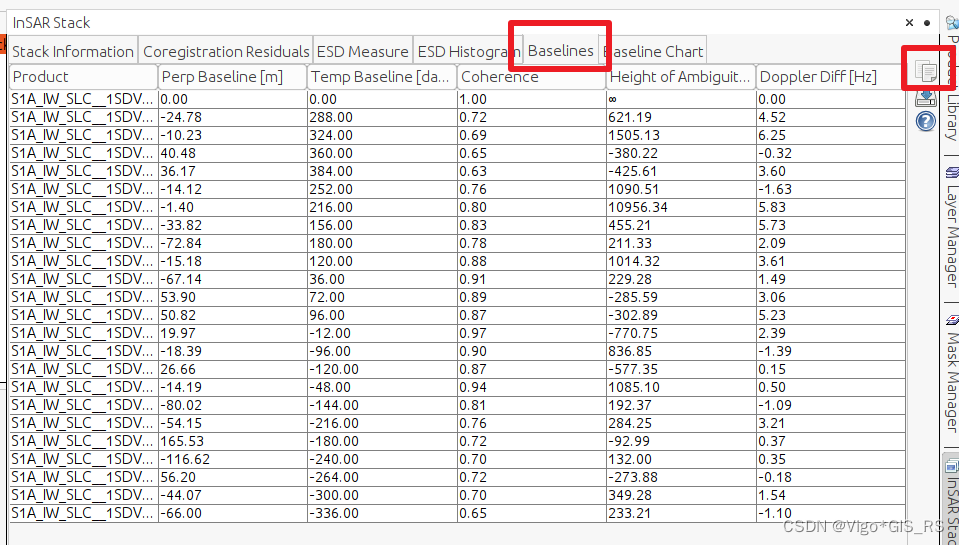
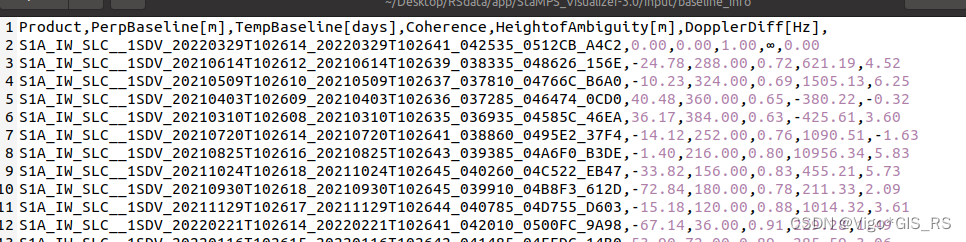
选择Baseline ,点击右边上面的copy,在文字编辑器中编辑,第一行cohere为1,其他的都是0
-
csv里面不要有空格
-
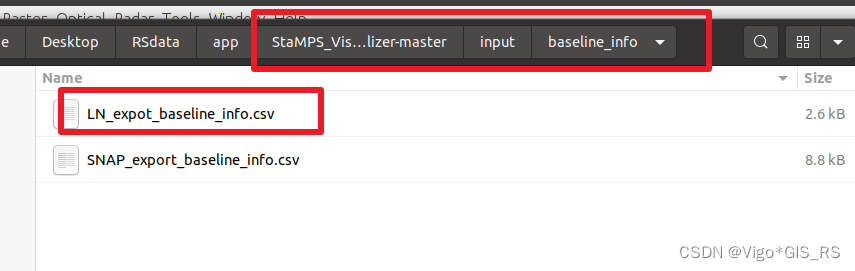
另存为
.csv格式,放在/StaMPS_Visualizer-master/input/baseline_info文件夹下面
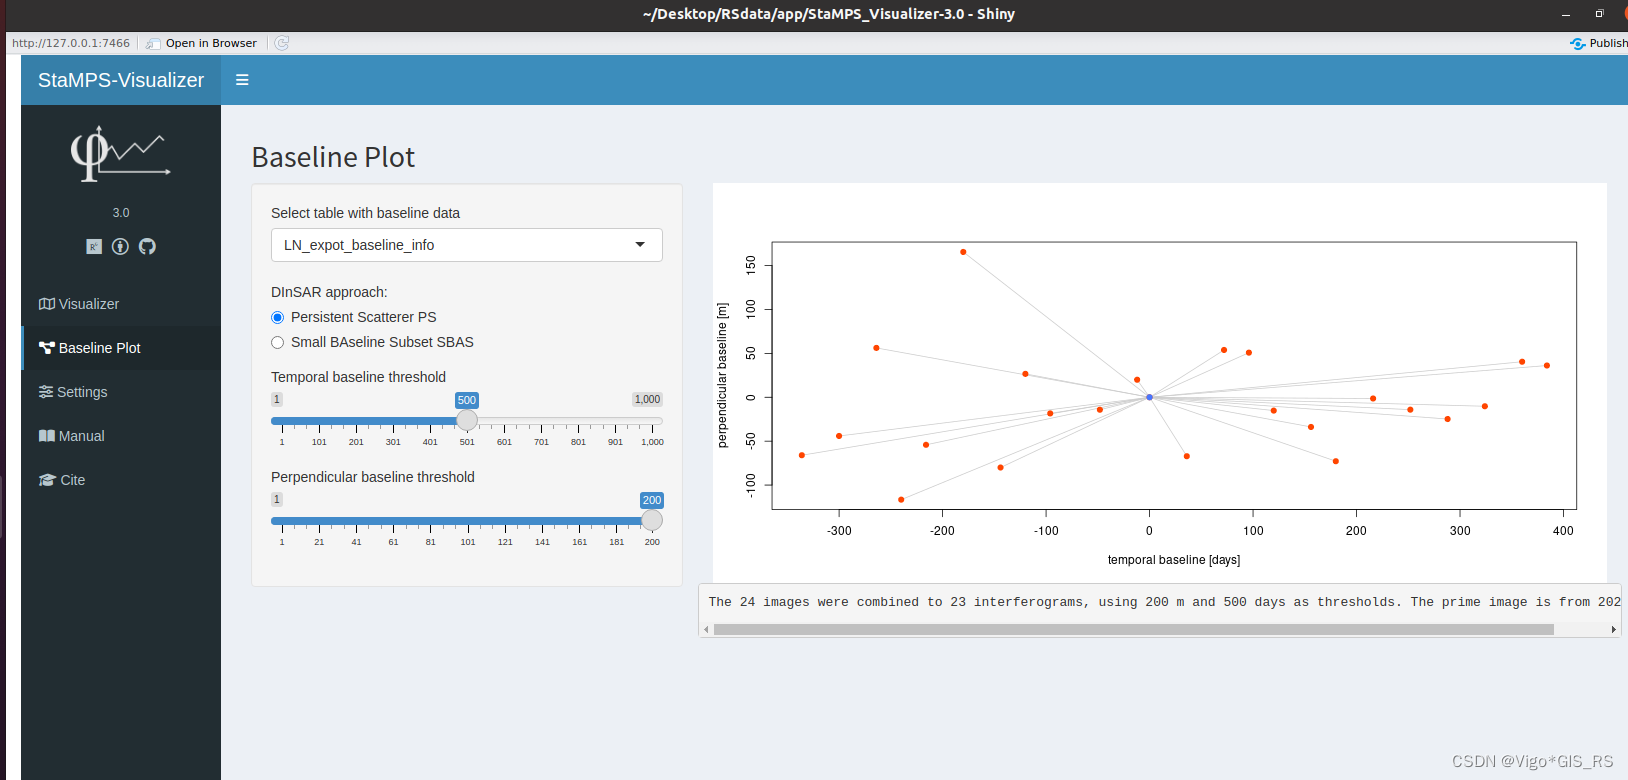
1.2 展示基线连接图
-
包括PS基线和SBAS基线
-
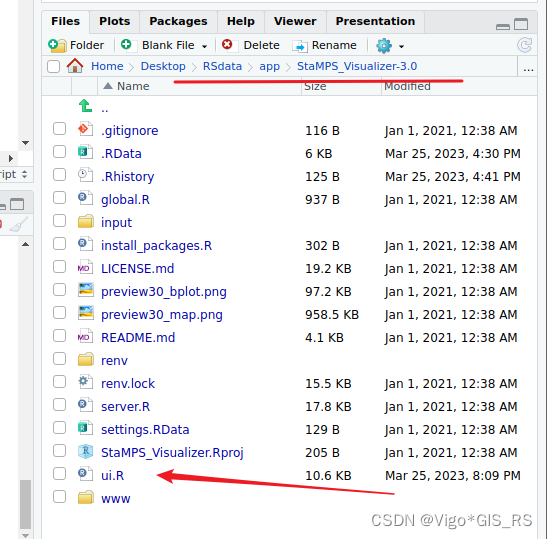
打开ui.R
-
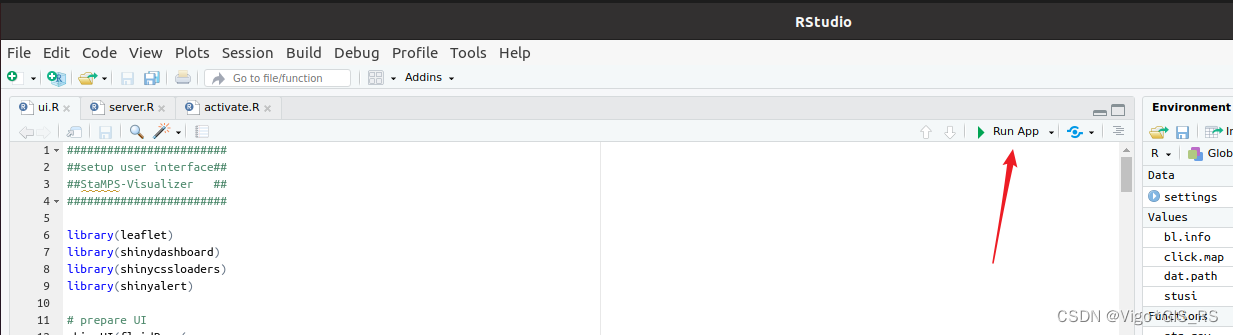
点击
Run App
-
可以选择数据源,展示PS和SBAS基线,调整时空基线长度,时间基线单位为天day,空间为米m

-
也可以在浏览器中打开Open in Browser

2 StaMPS_Visualizer 展示检测点形变数据
2.1 制图并导出csv
在matlab中使用ps_plot制图,具体命令如下
from https://thho.shinyapps.io/StaMPS_Visualizer/#exportbl
% the 'v-doa' parameter is an example you can change it to your needs
ps_plot('v-doa', 'ts');

% a new window will open
% in the new window select a radius and location of the radius center to select the PS to export

load parms.mat;

% the 'v-doa' parameter is an example you can change it to your needs
% but be sure that you use the same paramters as above in the ps_plot()!
ps_plot('v-doa', -1);

load ps_plot_v-doa.mat;
lon2_str = cellstr(num2str(lon2));
lat2_str = cellstr(num2str(lat2));
lonlat2_str = strcat(lon2_str, lat2_str);

lonlat_str = strcat(cellstr(num2str(lonlat(:,1))), cellstr(num2str(lonlat(:,2))));
ind = ismember(lonlat_str, lonlat2_str);

disp = ph_disp(ind);
disp_ts = ph_mm(ind,:);
export_res = [lonlat(ind,1) lonlat(ind,2) disp disp_ts];

metarow = [ref_centre_lonlat NaN transpose(day)-1];
k = 0;
export_res = [export_res(1:k,:); metarow; export_res(k+1:end,:)];
export_res = table(export_res);

% you can specify the location and name of the .csv export by renaming the second parameter
writetable(export_res,'stamps_tsexport.csv')
2.2 导入csv并展示
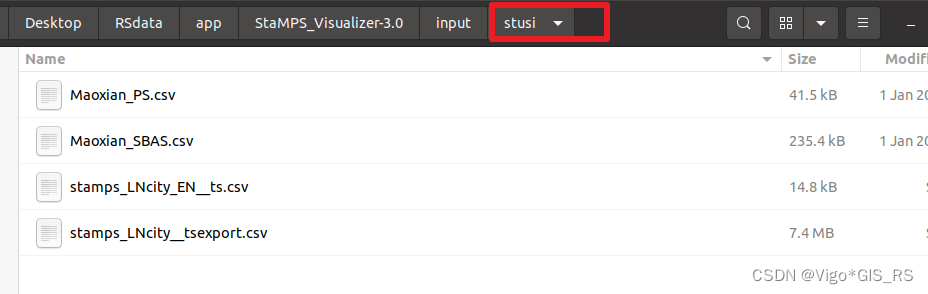
- 将上一步导出的csv数据放在input-stusi文件夹中
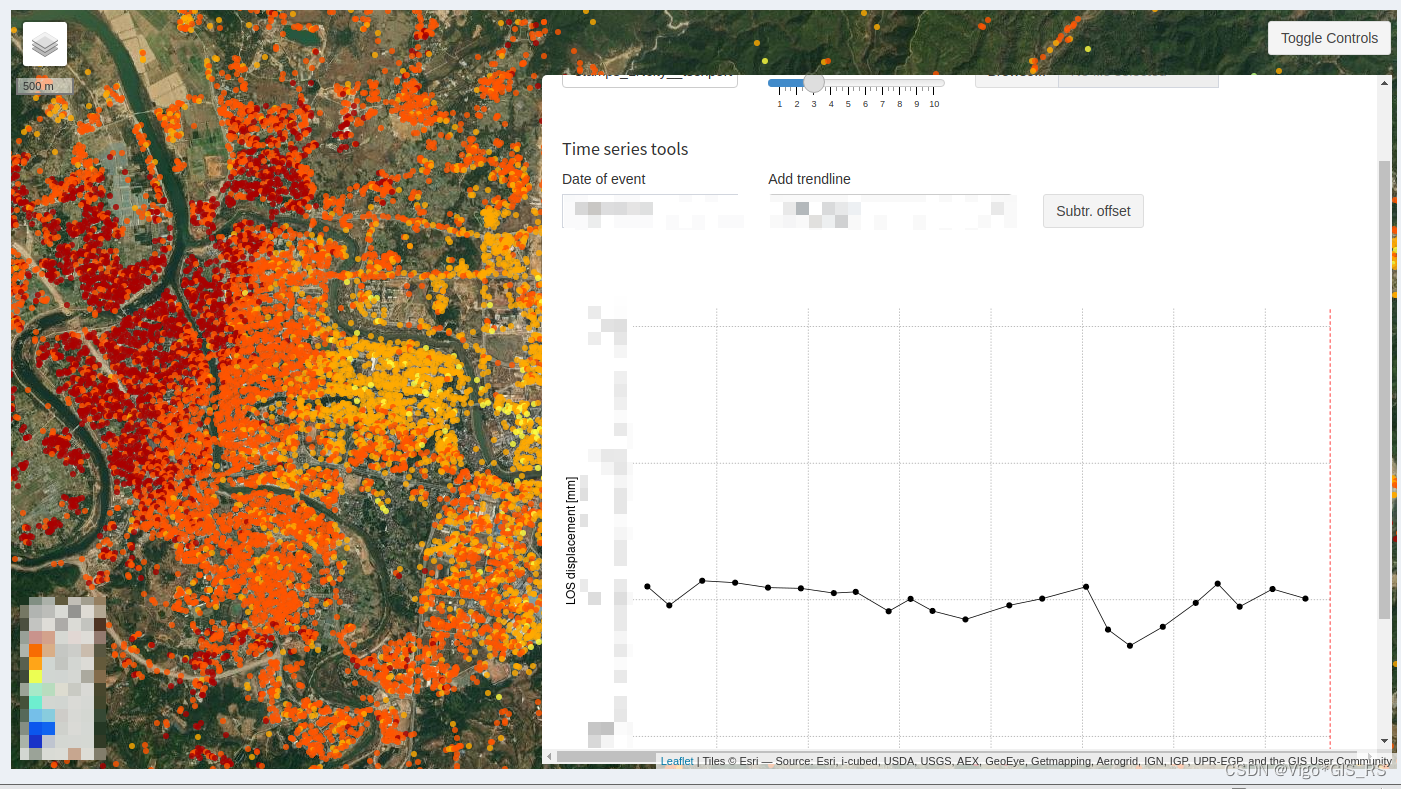
- 在Rstudio中运行ui.R,打开toggle controls即可看到各个PS点的形变信息
3 发布形变检测信息
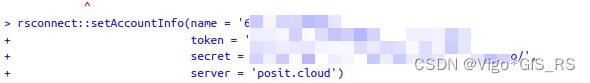
注册一个posit.cloud账号,在Rstudio中输入上述网址中的token
点击shiny应用右上角的publish,publish application
如果网络条件好的话,就可以直接发布了,我的网络条件有点差,没发布成功。
感谢阅读!