大家应该都很清楚,做量化投资回测是很重要的,因为,我们做回测就是根据历史数据来验证交易策略的可行性和有效性的过程。那我们如何通过baostock去进行回测呢?
说到底,做回测是希望可以用回测后的表现来评估未来实盘表现。我们假设如果回测结果好,实盘结果也不会太差,也就是说我们假设回测时的市场历史表现会在未来重演。假设我们现在有100种策略,我们可以通过做回测来筛选5种表现好的策略实盘,从而节约选择的机会成本。如果要用到baostock去进行回测,那大家可能会用到下面这段代码:
#!/usr/local/bin/python
# -*- coding: utf8 -*-
"""
Author:Lin Ouy
Date: 2022-11-30
量化-数据爬取-证券宝www.baostock.com

baostock是一个免费、开源的证券数据平台(无需注册)
提供大量准确、完整的证券历史行情数据、上市公司财务数据等。
通过python API获取证券数据信息,满足量化交易投资者、数量金融爱好者、计量经济从业者数据需求。
返回的数据格式:pandas DataFrame类型,以便于用pandas/NumPy/Matplotlib进行数据分析和可视化。
同时支持通过BaoStock的数据存储功能,将数据全部保存到本地后进行分析。
支持语言:目前版本BaoStock.com目前只支持Python3.5及以上(暂不支持python 2.x)。

使用国内源安装:
pip install baostock -i https://pypi.tuna.tsinghua.edu.cn/simple/ --trusted-host pypi.tuna.tsinghua.edu.cn
"""
import os
import datetime
import numpy as np
import pandas as pd
import baostock as bs
from pathlib import Path
from dateutil import parser
from datetime import timedelta


class BaoStockData:

    def __init__(self, code, fields, start_date, end_date, frequency="5", adjustflag="2"):
        self.code = code
        self.fields = fields
        self.start_date = start_date
        self.end_date = end_date
        self.frequency = frequency
        self.adjustflag = adjustflag

        BASE_DIR = Path(__file__).resolve().parent
        bar_path = f"results/{self.code}_5m_{datetime.date.today()}.csv"
        tick_path = f"results/{self.code}_ticks_{datetime.date.today()}.csv"
        bar_path_excel = f"results/{self.code}_5m_{datetime.date.today()}.xlsx"

        self.bar_path = os.path.join(BASE_DIR, bar_path)
        self.bar_path_excel = os.path.join(BASE_DIR, bar_path_excel)
        self.tick_path = os.path.join(BASE_DIR, tick_path)

    def get_data_from_baostock(self):
        # === 登陆系统 ===
        lg = bs.login()
        # 显示登陆返回信息
        print('login respond error_code:' + lg.error_code)
        print('login respond  error_msg:' + lg.error_msg)

        # === 获取沪深A股历史K线数据 ===
        # 详细指标参数,参见“历史行情指标参数”章节;“分钟线”参数与“日线”参数不同。“分钟线”不包含指数。
        # 分钟线指标:date,time,code,open,high,low,close,volume,amount,adjustflag
        # 周月线指标:date,code,open,high,low,close,volume,amount,adjustflag,turn,pctChg
        """
        参数含义:
        code:股票代码,sh或sz.+6位数字代码,或者指数代码,如:sh.601398。sh:上海;sz:深圳。此参数不可为空;
        fields:指示简称,支持多指标输入,以半角逗号分隔,填写内容作为返回类型的列。详细指标列表见历史行情指标参数章节,日线与分钟线参数不同。此参数不可为空;
        start:开始日期(包含),格式“YYYY-MM-DD”,为空时取2015-01-01;
        end:结束日期(包含),格式“YYYY-MM-DD”,为空时取最近一个交易日;
        frequency:数据类型,默认为d,日k线;d=日k线、w=周、m=月、5=5分钟、15=15分钟、30=30分钟、60=60分钟k线数据,不区分大小写;指数没有分钟线数据;周线每周最后一个交易日才可以获取,月线每月最后一个交易日才可以获取。
        adjustflag:复权类型,默认不复权:3;1:后复权;2:前复权。已支持分钟线、日线、周线、月线前后复权。 BaoStock提供的是涨跌幅复权算法复权因子,具体介绍见:复权因子简介或者BaoStock复权因子简介。
        """

        if self.code.startswith("6"):  # 600036
            m = "sh"
        elif self.code.startswith("0"):  # 000858
            m = "sz"
        else:
            m = ""

        params = {
            "code": f"{m}.{self.code}",
            "fields": self.fields,
            "start_date": self.start_date,  # '2022-07-01',
            "end_date": self.end_date,  # '2022-12-31',
            "frequency": self.frequency,  # d
            "adjustflag": self.adjustflag
        }
        rs = bs.query_history_k_data_plus(**params)
        print('query_history_k_data_plus respond error_code:' + rs.error_code)
        print('query_history_k_data_plus respond  error_msg:' + rs.error_msg)

        # === 打印结果集 ===
        data_list = []
        while (rs.error_code == '0') & rs.next():
            # 获取一条记录,将记录合并在一起
            data_list.append(rs.get_row_data())
        result = pd.DataFrame(data_list, columns=rs.fields)

        # ===
        result['time'] = [t[:-3] for t in result['time']]
        result['time'] = pd.to_datetime(result['time'])
        result.rename(columns={"time": "datetime"}, inplace=True)

        need_cols = ["datetime", "open", "high", "low", "close", "volume", "amount"]
        result = result.loc[:, need_cols]
        result.set_index("datetime", drop=True, inplace=True)

        # === 结果集输出到csv文件 ===
        result.to_csv(self.bar_path, index=True)
        result.to_excel(self.bar_path_excel, index=True)
        print(result)

        # === 登出系统 ===
        bs.logout()

    def get_ticks_for_backtesting(self):
        """
        get ticks for backtesting
        :tick_path: 生成的回测数据路径
        :param2 bar_path: 历史数据的tick路径
        :return:list, such as [(datetime, last_price), (datetime, last_price)]
        """

        if os.path.exists(self.tick_path):  # 如果已存在回测数据,直接读取回测数据ticks
            ticks = pd.read_csv(
                self.tick_path,
                parse_dates=['datetime'],
                index_col='datetime')

            tick_list = []
            for index, row in ticks.iterrows():
                tick_list.append((index, row[0]))
            ticks = tick_list

        else:
            bar_5m = pd.read_csv(self.bar_path)  # 使用pandas读取csv数据
            ticks = []

            for index, row in bar_5m.iterrows():  # 根据不同的开盘价设置步长
                if row['open'] < 30:
                    step = 0.01
                elif row['open'] < 60:
                    step = 0.03
                elif row['open'] < 90:
                    step = 0.05
                else:
                    step = 0.1
                # in case of np.arrange(30, 30.11, 0.02), (open, high, step)
                # we will not have 30.11 as the highest price,
                # we might not catch high when step is more than 0.01
                # that is why me need: arr = np.append(arr, row['high']) and
                #   arr = np.append(arr, row['low'])
                arr = np.arange(row['open'], row['high'], step)  # 按步长生成从open到high的数据
                arr = np.append(arr, row['high'])  # 这个是为了弥补步长的不对等会漏掉high
                arr = np.append(arr, np.arange(row['open'] - step, row['low'], -step))  # 按步长生成从open到low的数据
                arr = np.append(arr, row['low'])  # 这个是为了弥补步长的不对等会漏掉low
                arr = np.append(arr, row['close'])

                i = 0
                dt = parser.parse(row['datetime']) - timedelta(minutes=5)
                for item in arr:
                    ticks.append((dt + timedelta(seconds=0.1 * i), item))  # 将数据时间模拟到0.1秒递进
                    i += 1
            tick_df = pd.DataFrame(ticks, columns=['datetime', 'price'])
            tick_df.to_csv(self.tick_path, index=False)  # 保存到csv回测数据中
        return ticks

    def main(self):

        self.get_data_from_baostock()  # bar
        ticks = self.get_ticks_for_backtesting()  # ticket
        return ticks


if __name__ == '__main__':
    code1 = "600035"
    # code2 = "000858"
    fields_5 = "date,time,code,open,high,low,close,volume,amount,adjustflag"
    fields_d = "date,code,open,high,low,close,preclose,volume,amount,adjustflag,turn,tradestatus,pctChg,isST"
    bsd = BaoStockData(code1, fields_5, '2022-07-01', '2022-12-31')
bsd.main()其实量化工具不单只要baostock,还有掘金、米筐等等其他工具也能用,不过这些量化平台是有局限性的,那就是交易频率不能太高,如果想要提高交易频率,还是要用到量化接口
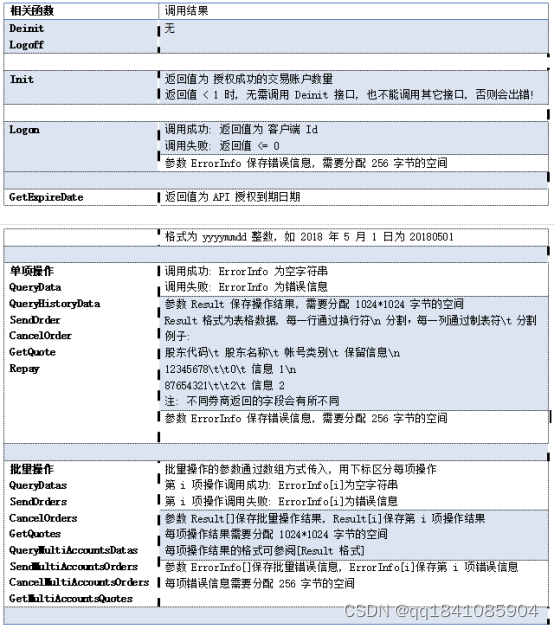
这类型的量化接口是截止接入券商软件的,所以安全性也有保障,而且交易频率可以做得比较高,不过也不是无截止的,毕竟频率太高可能会被券商盯上的,导致封ip的,如果想要获取交易接口,可以在https://gitee.com/metatradeapi看看。