πDay快乐!
3.14 π Day 到了,本期给出一些非常炫酷的pi的可化并给出完整 MATLAB 代码。

首先,我们要获得pi的前n位小数,需要编写如下代码(为了防止不精准会多取几位尾数,用的时候再进行一次取前多少位的操作):
function Pi=getPi(n)
if nargin<1,n=3;end
Pi=char(vpa(sym(pi),n+10));
Pi=abs(Pi)-48;
Pi=Pi(3:end-4);
end
有了这个获取pi小数位的函数,我们的可视化之旅正式启动从简单到复杂一步步来(请尽量使用比较新的版本运行代码,至少17b之后版本)
1 饼图

就是统计一下前1500位小数各个数字所占比例:
% 获取pi前1500位小数
Pi=getPi(1500);
% 统计各个数字出现次数
numNum=find([diff(sort(Pi)),1]);
numNum=[numNum(1),diff(numNum)];
% 配色列表
CM=[20,164,199;43,187,170;53,165,81;189,190,28;248,167,22;
    232,74,27;244,57,99;240,118,177;168,109,195;78,125,187]./255;
% 绘图并修饰
pieHdl=pie(numNum);
set(gcf,'Color',[1,1,1],'Position',[200,100,620,620]);
for i=1:2:20
    pieHdl(i).EdgeColor=[1,1,1];
    pieHdl(i).LineWidth=1;
    pieHdl(i).FaceColor=CM((i+1)/2,:);
end
for i=2:2:20
    pieHdl(i).Color=CM(i/2,:);
    pieHdl(i).FontWeight='bold';
    pieHdl(i).FontSize=14;
end
% 绘制图例并修饰
lgdHdl=legend(num2cell('0123456789'));
lgdHdl.FontWeight='bold';
lgdHdl.FontSize=11;
lgdHdl.TextColor=[.5,.5,.5];
lgdHdl.Location='southoutside';
lgdHdl.Box='off';
lgdHdl.NumColumns=10;
lgdHdl.ItemTokenSize=[20,15];
title("VISUALIZING  \pi 'Pi' Chart | 1500 digits",'FontSize',18,...
    'FontName','Times New Roman','Color',[.5,.5,.5])
2 折线图

计算每种数字所占比例的变化:
% 获取pi前1500位小数
Pi=getPi(1500);
% 计算比例变化
Ratio=cumsum(Pi==(0:9)',2);
Ratio=Ratio./sum(Ratio);
D=1:length(Ratio);
% 配色列表
CM=[20,164,199;43,187,170;53,165,81;189,190,28;248,167,22;
    232,74,27;244,57,99;240,118,177;168,109,195;78,125,187]./255;
hold on
% 循环绘图
for i=1:10
    plot(D(20:end),Ratio(i,20:end),'Color',[CM(i,:),.6],'LineWidth',1.8)
end
% 坐标区域修饰
ax=gca;box on;grid on
ax.YLim=[0,.2];
ax.YTick=0:.05:.2;
ax.XTick=0:200:1400;
ax.YTickLabel={

    '0%','5%','10%','15%','20%'};
ax.XMinorTick='on';
ax.YMinorTick='on';
ax.LineWidth=.8;
ax.GridLineStyle='-.';
ax.FontName='Cambria';
ax.FontSize=11;
ax.XLabel.String='Decimals';
ax.YLabel.String='Proportion';
ax.XLabel.FontSize=13;
ax.YLabel.FontSize=13;
% 绘制图例并修饰
lgdHdl=legend(num2cell('0123456789'));
lgdHdl.NumColumns=5;
lgdHdl.FontWeight='bold';
lgdHdl.FontSize=11;
lgdHdl.TextColor=[.5,.5,.5];
3 堆叠填充图

计算每种数字所占比例的变化:
% 获取pi前500位小数
Pi=getPi(500);
% 计算比例变化
Ratio=cumsum(Pi==(0:9)',2);
Ratio=Ratio./sum(Ratio);
% 配色列表
CM=[231,98,84;239,138,71;247,170,88;255,208,111;255,230,183;
    170,220,224;114,188,213;82,143,173;55,103,149;30,70,110]./255;
% 绘制堆叠面积图
hold on
areaHdl=area(Ratio');
for i=1:10
    areaHdl(i).FaceColor=CM(i,:);
    areaHdl(i).FaceAlpha=.9;
end
% 图窗和坐标区域修饰
set(gcf,'Position',[200,100,720,420]);
ax=gca;
ax.YLim=[0,1];
ax.XMinorTick='on';
ax.YMinorTick='on';
ax.LineWidth=.8;
ax.FontName='Cambria';
ax.FontSize=11;
ax.TickDir='out';
ax.XLabel.String='Decimals';
ax.YLabel.String='Proportion';
ax.XLabel.FontSize=13;
ax.YLabel.FontSize=13;
ax.Title.String='Area Chart of Proportion — 500 digits';
ax.Title.FontSize=14;
% 绘制图例并修饰
lgdHdl=legend(num2cell('0123456789'));
lgdHdl.NumColumns=5;
lgdHdl.FontSize=11;
lgdHdl.Location='southeast';
4 连接堆叠柱状图

还是计算每种数字所占比例的变化:
% 获取pi前100位小数
Pi=getPi(100);
% 计算比例变化
Ratio=cumsum(Pi==(0:9)',2);
Ratio=Ratio./sum(Ratio);

X=Ratio(:,10:10:80)';
barHdl=bar(X,'stacked','BarWidth',.2);

CM=[231,98,84;239,138,71;247,170,88;255,208,111;255,230,183;
    170,220,224;114,188,213;82,143,173;55,103,149;30,70,110]./255;
for i=1:10
    barHdl(i).FaceColor=CM(i,:);
end
% 以下是生成连接的部分
hold on;axis tight
yEndPoints=reshape([barHdl.YEndPoints]',length(barHdl(1).YData),[])';
zeros(1,length(barHdl(1).YData));
yEndPoints=[zeros(1,length(barHdl(1).YData));yEndPoints];
barWidth=barHdl(1).BarWidth;
for i=1:length(barHdl)
    for j=1:length(barHdl(1).YData)-1
        y1=min(yEndPoints(i,j),yEndPoints(i+1,j));
        y2=max(yEndPoints(i,j),yEndPoints(i+1,j));
        if y1*y2<0
            ty=yEndPoints(find(yEndPoints(i+1,j)*yEndPoints(1:i,j)>=0,1,'last'),j);
            y1=min(ty,yEndPoints(i+1,j));
            y2=max(ty,yEndPoints(i+1,j));
        end
        y3=min(yEndPoints(i,j+1),yEndPoints(i+1,j+1));
        y4=max(yEndPoints(i,j+1),yEndPoints(i+1,j+1));
        if y3*y4<0
            ty=yEndPoints(find(yEndPoints(i+1,j+1)*yEndPoints(1:i,j+1)>=0,1,'last'),j+1);
            y3=min(ty,yEndPoints(i+1,j+1));
            y4=max(ty,yEndPoints(i+1,j+1));
        end
        fill([j+.5.*barWidth,j+1-.5.*barWidth,j+1-.5.*barWidth,j+.5.*barWidth],...
            [y1,y3,y4,y2],barHdl(i).FaceColor,'FaceAlpha',.4,'EdgeColor','none');
    end
end
% 图窗和坐标区域修饰
set(gcf,'Position',[200,100,720,420]);
ax=gca;box off
ax.YLim=[0,1];
ax.XMinorTick='on';
ax.YMinorTick='on';
ax.LineWidth=.8;
ax.FontName='Cambria';
ax.FontSize=11;
ax.TickDir='out';
ax.XTickLabel={

    '10','20','30','40','50','60','70','80'};
ax.XLabel.String='Decimals';
ax.YLabel.String='Proportion';
ax.XLabel.FontSize=13;
ax.YLabel.FontSize=13;
ax.Title.String='Area Chart of Proportion — 10-80 digits';
ax.Title.FontSize=14;
% 绘制图例并修饰
lgdHdl=legend(barHdl,num2cell('0123456789'));
lgdHdl.NumColumns=5;
lgdHdl.FontSize=11;
lgdHdl.Location='southeast';
5 有向弦图
需要用到这篇的工具函数:https://blog.csdn.net/slandarer/article/details/127992509

统计前后相挨着数字组数量,就比如某两位小数组合14比较多,那么由1指向4的箭头就会更宽一点:
% 构建连接矩阵
dataMat=zeros(10,10);
Pi=getPi(1001);
for i=1:1000
    dataMat(Pi(i)+1,Pi(i+1)+1)=dataMat(Pi(i)+1,Pi(i+1)+1)+1;
end

BCC=biChordChart(dataMat,'Arrow','on','Label',num2cell('0123456789'));
BCC=BCC.draw();

% 添加刻度
BCC.tickState('on')

% 修改字体,字号及颜色
BCC.setFont('FontName','Cambria','FontSize',17)

set(gcf,'Position',[200,100,820,820]);
6 引力模拟图

把每位小数想象为一个小球,其质量为 ( 1 + n ) K (1+n)^K (1+n)K,就比如如果 K = 0.1 K=0.1 K=0.1,那么0号小球重量为1,9号小球重量为1.2589,小球初始速度为0,受到其他球吸引力,引力遵循平方反比定律,同时如果小球离得足够近会撞在一起并变成数值 m o d ( n 1 + n 2 , 10 ) mod(n_1+n_2,10) mod(n1+n2,10),即相加后取模,速度方向按比例叠加,重量重新计算。
调节一下 K K K值:
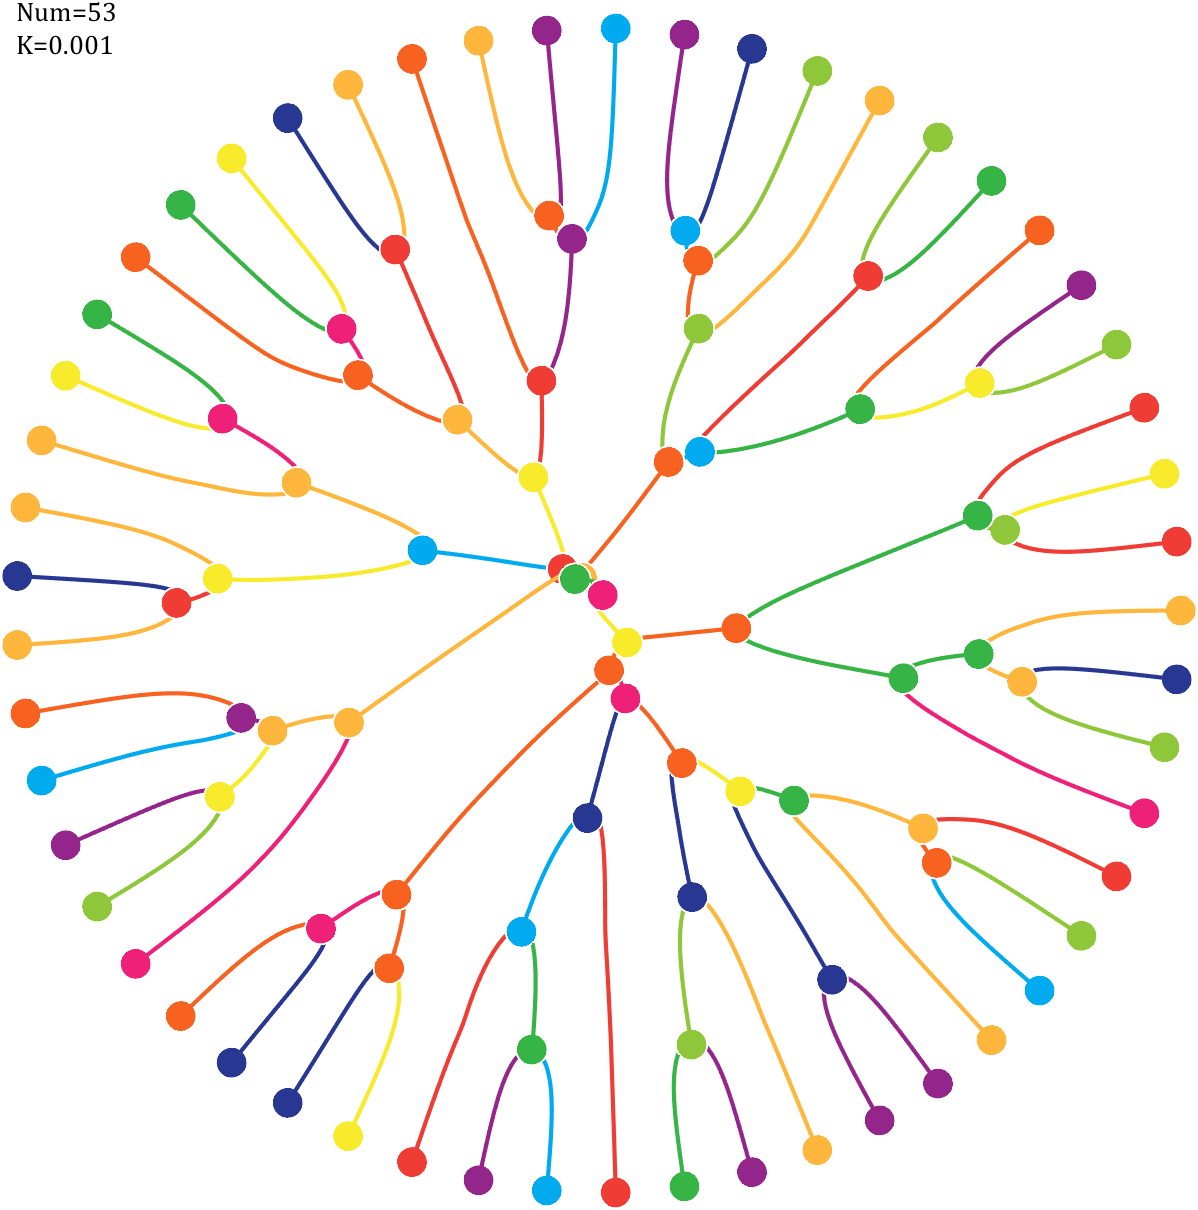


有三体那味了:
调节一下取的小数位数:


仅仅是模拟,取得时间间隔可能不够小,可能会有bug:
Pi=[3,getPi(71)];K=.18;
% 基础配置
CM=[239,32,120;239,60,52;247,98,32;255,182,60;247,235,44;
    142,199,57;55,180,70;0,170,239;40,56,146;147,37,139]./255;
T=linspace(0,2*pi,length(Pi)+1)';
T=T(1:end-1);
ct=linspace(0,2*pi,100);
cx=cos(ct).*.027;
cy=sin(ct).*.027;
% 初始数据
Pi=Pi(:);
N=Pi;
X=cos(T);Y=sin(T);
VX=T.*0;VY=T.*0;
PX=X;PY=Y;
% 未碰撞时初始质量
getM=@(x)(x+1).^K;
M=getM(N);
% 绘制初始圆圈
hold on
for i=1:length(N)
    fill(cx+X(i),cy+Y(i),CM(N(i)+1,:),'EdgeColor','w','LineWidth',1)
end
for k=1:800
    % 计算加速度
    Rn2=1./squareform(pdist([X,Y])).^2;
    Rn2(eye(length(X))==1)=0;
    MRn2=Rn2.*(M');
    AX=X'-X;AY=Y'-Y;
    normXY=sqrt(AX.^2+AY.^2);
    AX=AX./normXY;AX(eye(length(X))==1)=0;
    AY=AY./normXY;AY(eye(length(X))==1)=0;
    AX=sum(AX.*MRn2,2)./150000;
    AY=sum(AY.*MRn2,2)./150000;
    % 计算速度及新位置
    VX=VX+AX;X=X+VX;PX=[PX,X];
    VY=VY+AY;Y=Y+VY;PY=[PY,Y];
    % 检测是否有碰撞
    R=squareform(pdist([X,Y]));
    R(triu(ones(length(X)))==1)=inf;
    [row,col]=find(R<=0.04);
    if length(X)==1
        break;
    end
    if ~isempty(row)
        % 碰撞的点合为一体
        XC=(X(row)+X(col))./2;YC=(Y(row)+Y(col))./2;
        VXC=(VX(row).*M(row)+VX(col).*M(col))./(M(row)+M(col));
        VYC=(VY(row).*M(row)+VY(col).*M(col))./(M(row)+M(col));
        PC=nan(length(row),size(PX,2));
        NC=mod(N(row)+N(col),10);
        % 删除碰撞点并绘图
        uniNum=unique([row;col]);
        X(uniNum)=[];VX(uniNum)=[];
        Y(uniNum)=[];VY(uniNum)=[];
        for i=1:length(uniNum)
            plot(PX(uniNum(i),:),PY(uniNum(i),:),'LineWidth',2,'Color',CM(N(uniNum(i))+1,:))
        end
        PX(uniNum,:)=[];PY(uniNum,:)=[];N(uniNum,:)=[];
        % 绘制圆形
        for i=1:length(XC)
            fill(cx+XC(i),cy+YC(i),CM(NC(i)+1,:),'EdgeColor','w','LineWidth',1)
        end
        % 补充合体点
        X=[X;XC];Y=[Y;YC];VX=[VX;VXC];VY=[VY;VYC];
        PX=[PX;PC];PY=[PY;PC];N=[N;NC];M=getM(N);
    end
end
for i=1:size(PX,1)
    plot(PX(i,:),PY(i,:),'LineWidth',2,'Color',CM(N(i)+1,:))
end
text(-1,1,{

    ['Num=',num2str(length(Pi))];['K=',num2str(K)]},'FontSize',13,'FontName','Cambria')
% 图窗及坐标区域修饰
set(gcf,'Position',[200,100,820,820]);
ax=gca;
ax.Position=[0,0,1,1];
ax.DataAspectRatio=[1,1,1];
ax.XLim=[-1.1,1.1];
ax.YLim=[-1.1,1.1];
ax.XTick=[];
ax.YTick=[];
ax.XColor='none';
ax.YColor='none';
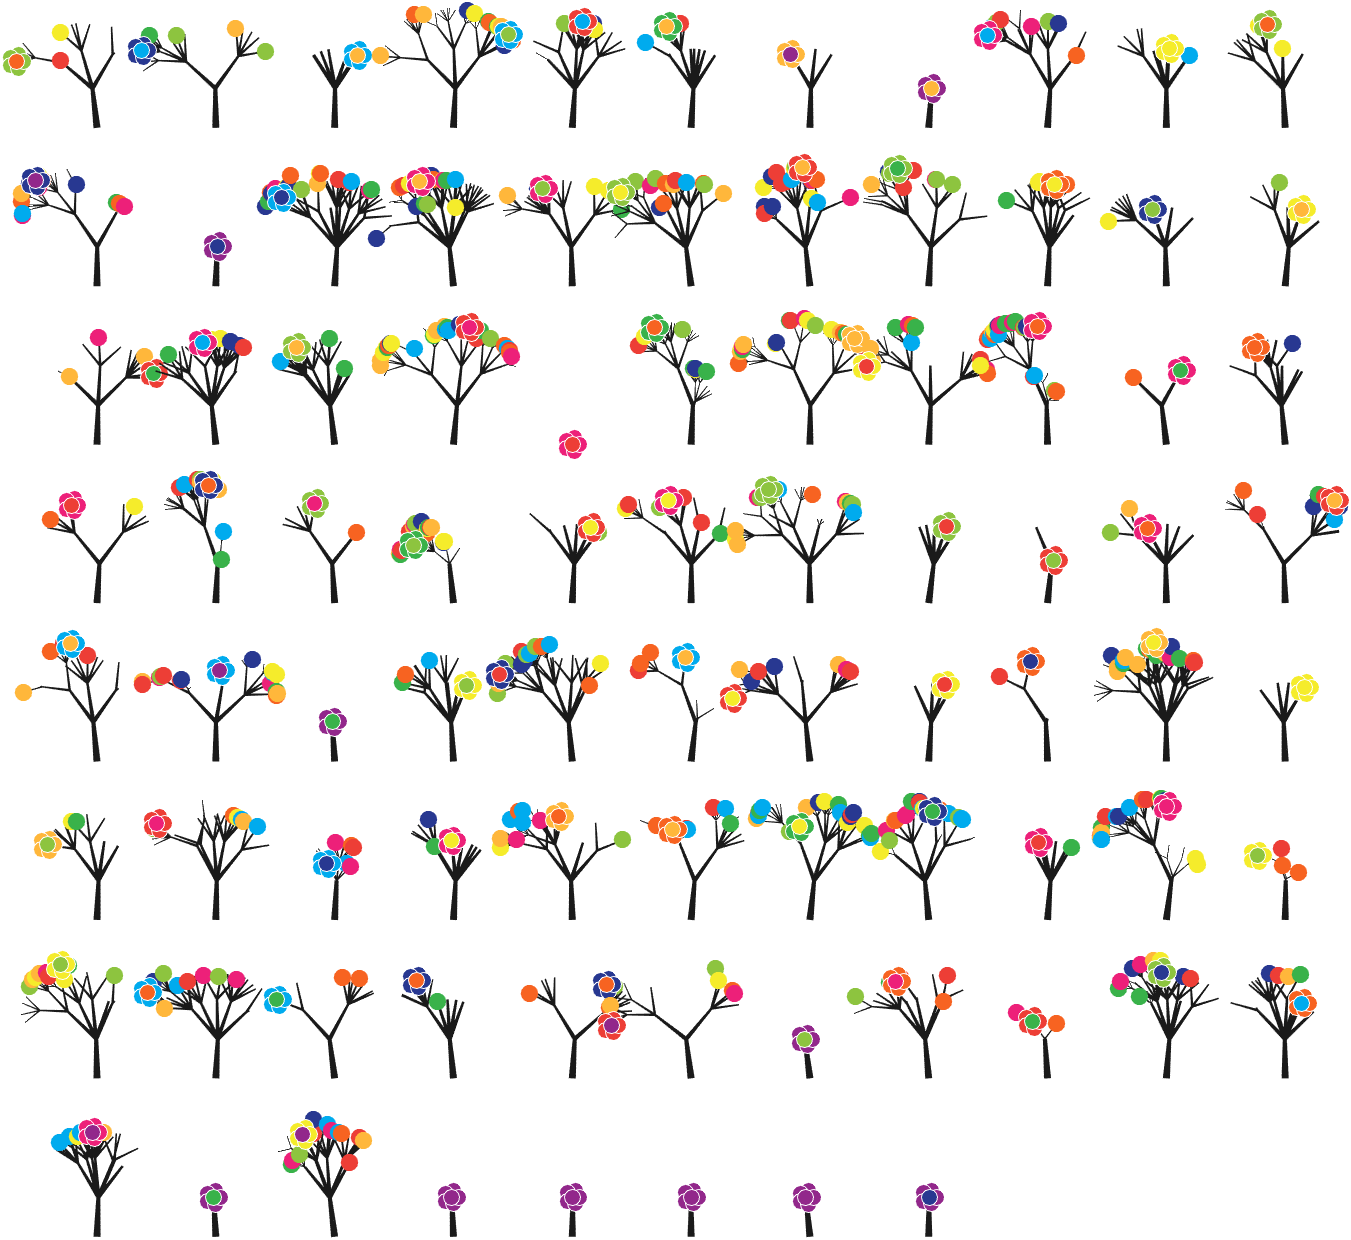
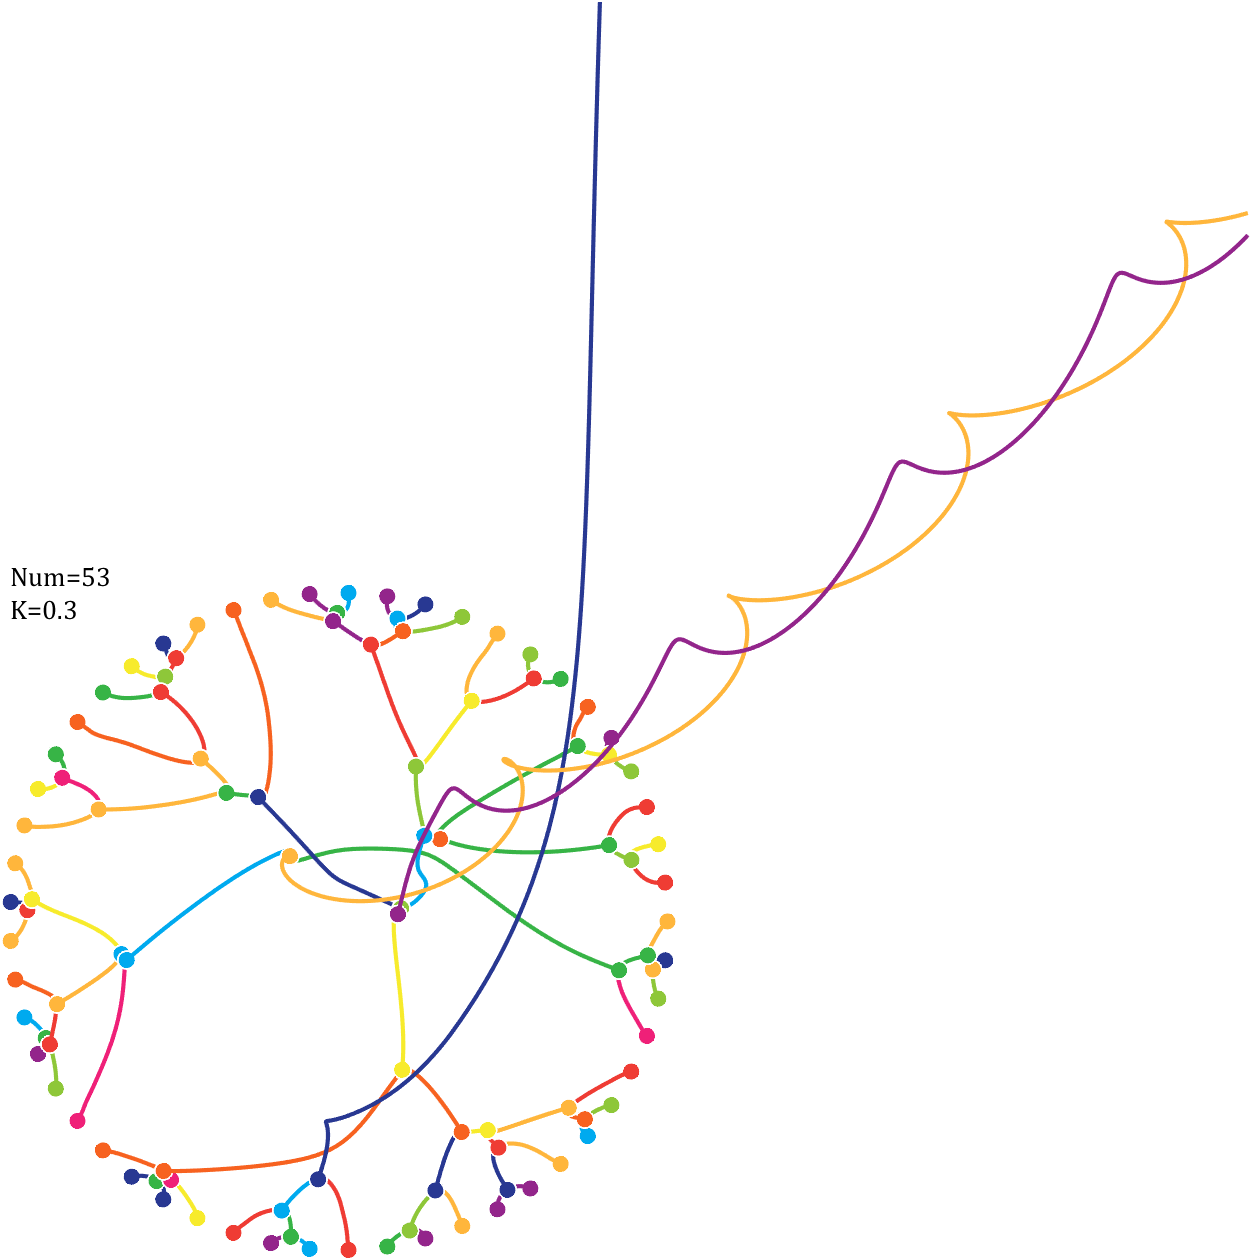
7 森林图

大体讲解一下,就是遇到数字9一停,把中间那段数字用来生长为树枝,数字几就长几个树杈,然后数字按照颜色再长成圆形的叶子,从左到右排列,之后遇到9就开一朵花,开花的颜色由9前面和后面数字决定,最后有一连串小花是因为小数点后762-767有连着6个9。
具体讲解懒得翻译了直接给一下原文,该可视化方法出自:
http://mkweb.bcgsc.ca/pi/piday2021
The digits of π
are shown as a forest. Each tree in the forest represents the digits of π
up to the next 9. The first 10 trees are “grown” from the digit sets 314159, 2653589, 79, 3238462643383279, 50288419, 7169, 39, 9, 3751058209, and 749.
BRANCHES
The first digit of a tree controls how many branches grow from the trunk of the tree. For example, the first tree’s first digit is 3, so you see 3 branches growing from the trunk.
The next digit’s branches grow from the end of a branch of the previous digit in left-to-right order. This process continues until all the tree’s digits have been used up.

Each tree grows from a set of consecutive digits sampled from the digits of π up to the next 9. The first tree, shown here, grows from 314159. Each of the digits determine how many branches grow at each fork in the tree — the branches here are colored by their corresponding digit to illustrate this. Leaves encode the digits in a left-to-right order. The digit 9 spawns a flower on one of the branches of the previous digit.
The branching exception is 0, which terminates the current branch — 0 branches grow!
LEAVES AND FLOWERS
The tree’s digits themselves are drawn as circular leaves, color-coded by the digit.
The leaf exception is 9, which causes one of the branches of the previous digit to sprout a flower! The petals of the flower are colored by the digit before the 9 and the center is colored by the digit after the 9, which is on the next tree. This is how the forest propagates.

The colors of a flower are determined by the first digit of the next tree and the penultimate digit of the current tree. If the current tree only has one digit, then that digit is used.
Leaves are placed at the tips of branches in a left-to-right order — you can “easily” read them off. Additionally, the leaves are distributed within the tree (without disturbing their left-to-right order) to spread them out as much as possible and avoid overlap. This order is deterministic.
The leaf placement exception are the branch set that sprouted the flower. These are not used to grow leaves — the flower needs space!
我写的代码分为两部分,第一部分是绘制一个树的代码:
function PiTree(X,pos,D)
lw=2;
theta=pi/2+(rand(1)-.5).*pi./12;
% 树叶及花朵颜色
CM=[237,32,121;237,62,54;247,99,33;255,183,59;245,236,43;
    141,196,63;57,178,74;0,171,238;40,56,145;146,39,139]./255;
hold on
if all(X(1:end-2)==0)
    endSet=[pos,pos,theta];
else
    kplot(pos(1)+[0,cos(theta)],pos(2)+[0,sin(theta)],lw./.6)
    endSet=[pos,pos+[cos(theta),sin(theta)],theta];
    % 计算层级
    Layer=0;
    for i=1:length(X)
        Layer=[Layer,ones(1,X(i)).*i];
    end
    % 计算树枝
    if D
    for i=1:length(X)-2
        if X(i)==0 % 若数值为0则不长树枝
            newSet=endSet(1,:);
        elseif X(i)==1 % 若数值为1则一长一短两个树枝
            tTheta=endSet(1,5);
            tTheta=linspace(tTheta+pi/8,tTheta-pi/8,2)'+(rand([2,1])-.5).*pi./8;
            newSet=repmat(endSet(1,3:4),[X(i),1]);
            newSet=[newSet.*[1;1],newSet+[cos(tTheta),sin(tTheta)].*.7^Layer(i).*[1;.1],tTheta];
        else % 其他情况数值为几长几个树枝
            tTheta=endSet(1,5);
            tTheta=linspace(tTheta+pi/5,tTheta-pi/5,X(i))'+(rand([X(i),1])-.5).*pi./8;
            newSet=repmat(endSet(1,3:4),[X(i),1]);
            newSet=[newSet,newSet+[cos(tTheta),sin(tTheta)].*.7^Layer(i),tTheta];
        end
        % 绘制树枝
        for j=1:size(newSet,1)
            kplot(newSet(j,[1,3]),newSet(j,[2,4]),lw.*.6^Layer(i))
        end
        endSet=[endSet;newSet];
        endSet(1,:)=[];
    end
    end
end
% 计算叶子和花朵位置
FLSet=endSet(:,3:4);
[~,FLInd]=sort(FLSet(:,1));
FLSet=FLSet(FLInd,:);
[~,tempInd]=sort(rand([1,size(FLSet,1)]));
tempInd=sort(tempInd(1:length(X)-2));
flowerInd=tempInd(randi([1,length(X)-2],[1,1]));
leafInd=tempInd(tempInd~=flowerInd);

% 绘制树叶
for i=1:length(leafInd)
    scatter(FLSet(leafInd(i),1),FLSet(leafInd(i),2),70,'filled','CData',CM(X(i)+1,:))
end
% 绘制花朵
for i=1:5
%     if ~D
%         tC=CM(X(end)+1,:);
%     else
%         tC=CM(X(end-2)+1,:);
%     end
    scatter(FLSet(flowerInd,1)+cos(pi*2*i/5).*.18,FLSet(flowerInd,2)+sin(pi*2*i/5).*.18,60,...
        'filled','CData',CM(X(end-2)+1,:),'MarkerEdgeColor',[1,1,1])
end
scatter(FLSet(flowerInd,1),FLSet(flowerInd,2),60,'filled','CData',CM(X(end)+1,:),'MarkerEdgeColor',[1,1,1])
drawnow;%axis tight
% =========================================================================
    function kplot(XX,YY,LW,varargin)
        LW=linspace(LW,LW*.6,10);%+rand(1,20).*LW./10;
        XX=linspace(XX(1),XX(2),11)';
        XX=[XX(1:end-1),XX(2:end)];
        YY=linspace(YY(1),YY(2),11)';
        YY=[YY(1:end-1),YY(2:end)];
        for ii=1:10
            plot(XX(ii,:),YY(ii,:),'LineWidth',LW(ii),'Color',[.1,.1,.1])
        end
    end
end
循环绘图代码:
Pi=[3,getPi(800)];
pos9=[0,find(Pi==9)];

set(gcf,'Position',[200,50,900,900],'Color',[1,1,1]);
ax=gca;hold on
ax.Position=[0,0,1,1];
ax.DataAspectRatio=[1,1,1];
ax.XLim=[.5,36];
ax.XTick=[];
ax.YTick=[];
ax.XColor='none';
ax.YColor='none';
for j=1:8
    for i=1:11
        n=i+(j-1)*11;
        if n<=85
            tPi=Pi((pos9(n)+1):pos9(n+1)+1);
            if length(tPi)>2
                PiTree(tPi,[0+i*3,0-j*4],true);
            else
                PiTree([Pi(pos9(n)),tPi],[0+i*3,0-j*4],false);
            end
        end
    end
end
8 随机游走

就是每位小数往不同方向走,很好理解:
n=1200;
% 获取pi前n位小数
Pi=getPi(n);

CM=[239,65,75;230,115,48;229,158,57;232,136,85;239,199,97;
           144,180,116;78,166,136;81,140,136;90,118,142;43,121,159]./255;
hold on
endPoint=[0,0];
t=linspace(0,2*pi,100);
T=linspace(0,2*pi,11)+pi/2;
fill(endPoint(1)+cos(t).*.5,endPoint(2)+sin(t).*.5,CM(Pi(1)+1,:),'EdgeColor','none')
for i=1:n
    theta=T(Pi(i)+1);
    plot(endPoint(1)+[0,cos(theta)],endPoint(2)+[0,sin(theta)],'Color',[CM(Pi(i)+1,:),.8],'LineWidth',1.2);
    endPoint=endPoint+[cos(theta),sin(theta)];
end
fill(endPoint(1)+cos(t).*.5,endPoint(2)+sin(t).*.5,CM(Pi(n)+1,:),'EdgeColor','none')

% 图窗和坐标区域修饰
set(gcf,'Position',[200,100,820,820]);
ax=gca;
ax.XTick=[];
ax.YTick=[];
ax.Color=[0,0,0];
ax.DataAspectRatio=[1,1,1];
ax.XLim=[-30,5];
ax.YLim=[-5,40];
% 绘制图例
endPoint=[1,35];
for i=1:10
    theta=T(i);
    plot(endPoint(1)+[0,cos(theta).*2],endPoint(2)+[0,sin(theta).*2],'Color',[CM(i,:),.8],'LineWidth',3);
    text(endPoint(1)+cos(theta).*2.7,endPoint(2)+sin(theta).*2.7,num2str(i-1),'Color',[1,1,1].*.7,...
        'FontSize',12,'FontWeight','bold','FontName','Cambria','HorizontalAlignment','center')
end
text(-15,35,'Random walk of \pi digits','Color',[1,1,1],'FontName','Cambria',...
    'HorizontalAlignment','center','FontSize',25,'FontAngle','italic')
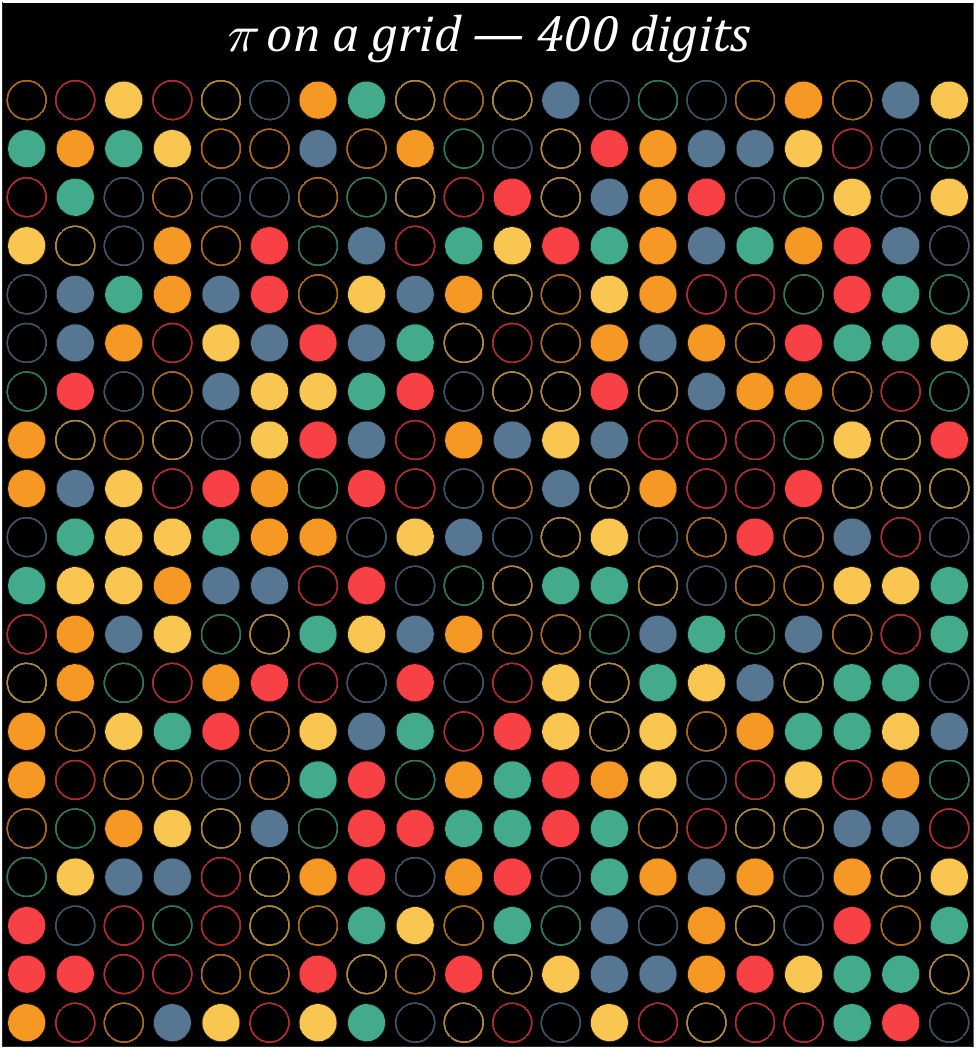
9 网格图

就是把数字一个一个用圆形画上去并赋予不同颜色,这里偶数是实心的奇数是空心的:
Pi=[3,getPi(399)];
% 配色数据
CM=[248,65,69;246,152,36;249,198,81;67,170,139;87,118,146]./255;
% 绘制圆圈
hold on
t=linspace(0,2*pi,100);
x=cos(t).*.8.*.5;
y=sin(t).*.8.*.5;
for i=1:400
    [col,row]=ind2sub([20,20],i);
    if mod(Pi(i),2)==0
        fill(x+col,y+row,CM(round((Pi(i)+1)/2),:),'LineWidth',1,'EdgeAlpha',.8)
    else
        fill(x+col,y+row,[0,0,0],'EdgeColor',CM(round((Pi(i)+1)/2),:),'LineWidth',1,'EdgeAlpha',.7)
    end
end
text(10.5,-.4,'\pi on a grid — 400 digits','Color',[1,1,1],'FontName','Cambria',...
    'HorizontalAlignment','center','FontSize',25,'FontAngle','italic')
% 图窗和坐标区域修饰
set(gcf,'Position',[200,100,820,820]);
ax=gca;
ax.YDir='reverse';
ax.XLim=[.5,20.5];
ax.YLim=[-1,20.5];
ax.XTick=[];
ax.YTick=[];
ax.Color=[0,0,0];
ax.DataAspectRatio=[1,1,1];
10 比例网格图

还是把数字以圆圈形式摆出来,不过不同的是六个数字一组,看每种数字占比,最后那个纯紫色圆圈就是我们熟悉762-767位点后小数的6个9。
Pi=[3,getPi(767)];
% 762-767
% 配色数据
CM=[239,32,120;239,60,52;247,98,32;255,182,60;247,235,44;
    142,199,57;55,180,70;0,170,239;40,56,146;147,37,139]./255;
% 绘制圆圈
hold on
t=linspace(0,2*pi,100);
x=cos(t).*.9.*.5;
y=sin(t).*.9.*.5;
for i=1:6:length(Pi)
    n=round((i-1)/6+1);
    [col,row]=ind2sub([10,13],n);
    tNum=Pi(i:i+5);
    numNum=find([diff(sort(tNum)),1]);
    numNum=[numNum(1),diff(numNum)];
    cumNum=cumsum(numNum);
    uniNum=unique(tNum);
    for j=length(cumNum):-1:1
        fill(x./6.*cumNum(j)+col,y./6.*cumNum(j)+row,CM(uniNum(j)+1,:),'EdgeColor','none')
    end
end
% 绘制图例
for i=1:10
   fill(x./4+5.5+(i-5.5)*.32,y./4+14.5,CM(i,:),'EdgeColor','none')
   text(5.5+(i-5.5)*.32,14.9,num2str(i-1),'Color',[1,1,1],'FontSize',...
       9,'FontName','Cambria','HorizontalAlignment','center')
end
text(5.5,-.2,'FEYNMAN POINT of \pi','Color',[1,1,1],'FontName','Cambria',...
    'HorizontalAlignment','center','FontSize',25,'FontAngle','italic')
% 图窗和坐标区域修饰
set(gcf,'Position',[200,100,600,820]);
ax=gca;
ax.YDir='reverse';
ax.Position=[0,0,1,1];
ax.XLim=[.3,10.7];
ax.YLim=[-1,15.5];
ax.XTick=[];
ax.YTick=[];
ax.Color=[0,0,0];
ax.DataAspectRatio=[1,1,1];
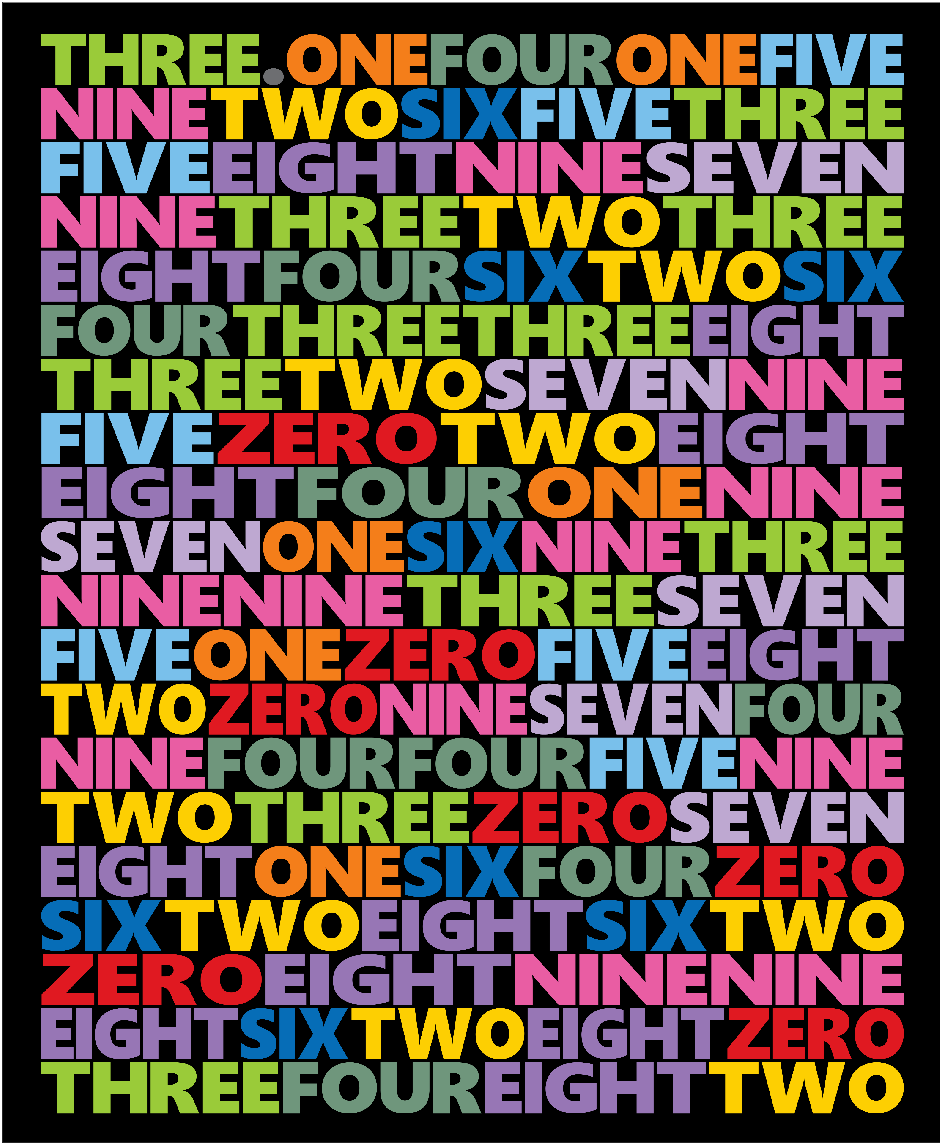
11 文字图

首先要写段代码生成每个字母的图片:
function getLogo
if ~exist('image','dir')
    mkdir('image\')
end
logoSet=['.',char(65:90)];
for i=1:27
    figure();
    ax=gca;
    ax.XLim=[-1,1];
    ax.YLim=[-1,1];
    ax.XColor='none';
    ax.YColor='none';
    ax.DataAspectRatio=[1,1,1];
    logo=logoSet(i);
    hold on
    text(0,0,logo,'HorizontalAlignment','center','FontSize',320,'FontName','Segoe UI Black')
    exportgraphics(ax,['image\',logo,'.png'])
    close
end
dotPic=imread('image\..png');
newDotPic=uint8(ones([400,size(dotPic,2),3]).*255);
newDotPic(end-size(dotPic,1)+1:end,:,1)=dotPic(:,:,1);
newDotPic(end-size(dotPic,1)+1:end,:,2)=dotPic(:,:,2);
newDotPic(end-size(dotPic,1)+1:end,:,3)=dotPic(:,:,3);
imwrite(newDotPic,'image\..png')

S=20;
for i=1:27
    logo=logoSet(i);
    tPic=imread(['image\',logo,'.png']);
    sz=size(tPic,[1,2]);
    sz=round(sz./sz(1).*400);
    tPic=imresize(tPic,sz);
    tBox=uint8(255.*ones(size(tPic,[1,2])+S));
    tBox(S+1:S+size(tPic,1),S+1:S+size(tPic,2))=tPic(:,:,1);
    imwrite(cat(3,tBox,tBox,tBox),['image\',logo,'.png'])
end
end

之后生成效果图片:
Pi=[3,-1,getPi(150)];

CM=[109,110,113;224,25,33;244,126,26;253,207,2;154,203,57;111,150,124;
    121,192,235;6,109,183;190,168,209;151,118,181;233,93,163]./255;
ST={

    '.','ZERO','ONE','TWO','THREE','FOUR','FIVE','SIX','SEVEN','EIGHT','NINE'};

n=1;
hold on
% 循环绘制字母
for i=1:20%:10
    STList='';
    NMList=[];
    PicListR=uint8(zeros(400,0));
    PicListG=uint8(zeros(400,0));
    PicListB=uint8(zeros(400,0));
    % PicListA=uint8(zeros(400,0));
    for j=1:6
        STList=[STList,ST{

    Pi(n)+2}];
        NMList=[NMList,ones(size(ST{

    Pi(n)+2})).*(Pi(n)+2)];
        n=n+1;
        if length(STList)>15&&length(STList)+length(ST{

    Pi(n)+2})>20
            break;
        end
    end
    for k=1:length(STList)
        tPic=imread(['image\',STList(k),'.png']);
        % PicListA=[PicListA,tPic(:,:,1)];
        PicListR=[PicListR,(255-tPic(:,:,1)).*CM(NMList(k),1)];
        PicListG=[PicListG,(255-tPic(:,:,2)).*CM(NMList(k),2)];
        PicListB=[PicListB,(255-tPic(:,:,3)).*CM(NMList(k),3)];
    end
    PicList=cat(3,PicListR,PicListG,PicListB);
    image([-1200,1200],[0,150]-(i-1)*150,flipud(PicList))
end
% 图窗及坐标区域修饰
set(gcf,'Position',[200,100,600,820]);
ax=gca;
ax.DataAspectRatio=[1,1,1];
ax.XLim=[-1300,1300];
ax.Position=[0,0,1,1];
ax.XTick=[];
ax.YTick=[];
ax.Color=[0,0,0];
ax.YLim=[-19*150-80,230];

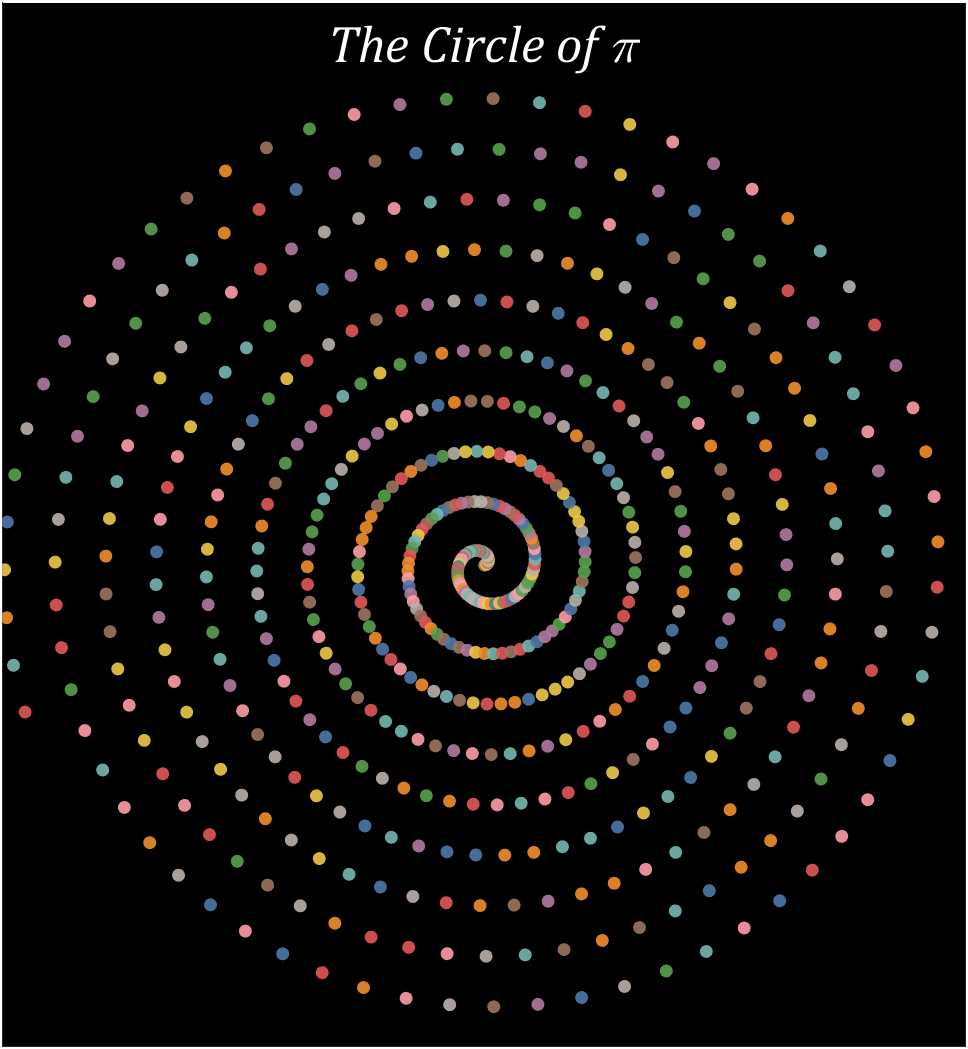
12 螺线图
Pi=getPi(600);
% 配色列表
CM=[78,121,167;242,142,43;225,87,89;118,183,178;89,161,79;
    237,201,72;176,122,161;255,157,167;156,117,95;186,176,172]./255;
% 绘制圆圈
hold on
t=linspace(0,2*pi,100);
x=cos(t).*.8;
y=sin(t).*.8;
for i=1:600
    X=i.*cos(i./10)./10;
    Y=i.*sin(i./10)./10;
    fill(X+x,Y+y,CM(Pi(i)+1,:),'EdgeColor','none','FaceAlpha',.9)
end
text(0,65,'The Circle of \pi','Color',[1,1,1],'FontName','Cambria',...
    'HorizontalAlignment','center','FontSize',25,'FontAngle','italic')
% 图窗和坐标区域修饰
set(gcf,'Position',[200,100,820,820]);
ax=gca;
ax.XLim=[-60,60];
ax.YLim=[-60,70];
ax.XTick=[];
ax.YTick=[];
ax.Color=[0,0,0];
ax.DataAspectRatio=[1,1,1];
13 阿基米德螺线图

另一种螺线:
a=1;b=.227;

Pi=getPi(500);
% 配色列表
CM=[78,121,167;242,142,43;225,87,89;118,183,178;89,161,79;
    237,201,72;176,122,161;255,157,167;156,117,95;186,176,172]./255;
% 绘制圆圈
hold on
T=0;R=1;
t=linspace(0,2*pi,100);
x=cos(t).*.7;
y=sin(t).*.7;
for i=1:500
    X=R.*cos(T);Y=R.*sin(T);
    fill(X+x,Y+y,CM(Pi(i)+1,:),'EdgeColor','none','FaceAlpha',.9)
    T=T+1./R.*1.4;
    R=a+b*T;
end
text(17.25,22,{

    'The Archimedes spiral of \pi';'—— 500 digits'},...
    'Color',[1,1,1],'FontName','Cambria',...
    'HorizontalAlignment','right','FontSize',25,'FontAngle','italic')
% 图窗和坐标区域修饰
set(gcf,'Position',[200,100,820,820]);
ax=gca;
ax.XLim=[-19,18.5];
ax.YLim=[-20,25];
ax.XTick=[];
ax.YTick=[];
ax.Color=[0,0,0];
ax.DataAspectRatio=[1,1,1];
14 比例阿基米德螺线图
密恐慎看!!
密恐慎看!!
密恐慎看!!


四个数为一组,还是看比例:
Pi=[3,getPi(1199)];
% 配色数据
CM=[239,32,120;239,60,52;247,98,32;255,182,60;247,235,44;
    142,199,57;55,180,70;0,170,239;40,56,146;147,37,139]./255;
% CM=slanCM(184,10);
% 绘制圆圈
hold on
T=0;R=1;
t=linspace(0,2*pi,100);
x=cos(t).*.7;
y=sin(t).*.7;
for i=1:4:length(Pi)
    X=R.*cos(T);Y=R.*sin(T);
    tNum=Pi(i:i+3);
    numNum=find([diff(sort(tNum)),1]);
    numNum=[numNum(1),diff(numNum)];
    cumNum=cumsum(numNum);
    uniNum=unique(tNum);
    for j=length(cumNum):-1:1
        fill(x./4.*cumNum(j)+X,y./4.*cumNum(j)+Y,CM(uniNum(j)+1,:),'EdgeColor','none')
    end
    T=T+1./R.*1.4;
    R=a+b*T;
end
text(14,16.5,{

    'The ratio of four numbers from \pi';'—— 1200 digits'},...
    'Color',[1,1,1],'FontName','Cambria',...
    'HorizontalAlignment','right','FontSize',23,'FontAngle','italic')
% 图窗和坐标区域修饰
set(gcf,'Position',[200,100,820,820]);
ax=gca;
ax.XLim=[-15,15.5];
ax.YLim=[-15,19];
ax.XTick=[];
ax.YTick=[];
ax.Color=[0,0,0];
ax.DataAspectRatio=[1,1,1];
15 网络图

还是用来展示数字前后相挨的情况:
% 构建连接矩阵
corrMat=zeros(10,10);
Pi=getPi(401);
for i=1:400
    corrMat(Pi(i)+1,Pi(i+1)+1)=corrMat(Pi(i)+1,Pi(i+1)+1)+1;
end
% 配色列表
colorList=[0.3725    0.2745    0.5647
    0.1137    0.4118    0.5882
    0.2196    0.6510    0.6471
    0.0588    0.5216    0.3294
    0.4510    0.6863    0.2824
    0.9294    0.6784    0.0314
    0.8824    0.4863    0.0196
    0.8000    0.3137    0.2431
    0.5804    0.2039    0.4314
    0.4353    0.2510    0.4392];
t=linspace(0,2*pi,11);t=t(1:10)';
posXY=[cos(t),sin(t)];

maxWidth=max(corrMat(corrMat>0));
minWidth=min(corrMat(corrMat>0));
ttList=linspace(0,1,3)';
% 循环绘图
hold on
for i=1:size(corrMat,1)
    for j=i+1:size(corrMat,2)
        if corrMat(i,j)>0
            tW=(corrMat(i,j)-minWidth)./(maxWidth-minWidth);
            colorData=(1-ttList).*colorList(i,:)+ttList.*colorList(j,:);
            CData(:,:,1)=colorData(:,1);
            CData(:,:,2)=colorData(:,2);
            CData(:,:,3)=colorData(:,3);
            % 绘制连线
            fill(linspace(posXY(i,1),posXY(j,1),3),...
                 linspace(posXY(i,2),posXY(j,2),3),[0,0,0],'LineWidth',tW.*12+1,...
                 'CData',CData,'EdgeColor','interp','EdgeAlpha',.7,'FaceAlpha',.7)
        end
    end
    % 绘制圆点
    scatter(posXY(i,1),posXY(i,2),200,'filled','LineWidth',1.2,...
        'MarkerFaceColor',colorList(i,:),'MarkerEdgeColor',[.7,.7,.7]);
    text(posXY(i,1).*1.13,posXY(i,2).*1.13,num2str(i-1),'Color',[1,1,1].*.7,...
        'FontSize',30,'FontWeight','bold','FontName','Cambria','HorizontalAlignment','center')
end
text(0,1.3,'Numerical adjacency of \pi — 400 digits','Color',[1,1,1],'FontName','Cambria',...
    'HorizontalAlignment','center','FontSize',25,'FontAngle','italic')
% 图窗和坐标区域修饰
set(gcf,'Position',[200,100,820,820]);
ax=gca;
ax.XLim=[-1.2,1.2];
ax.YLim=[-1.21,1.5];
ax.XTick=[];
ax.YTick=[];
ax.Color=[0,0,0];
ax.DataAspectRatio=[1,1,1];
16 弦图
需要用到这篇的工具函数:https://blog.csdn.net/slandarer/article/details/127181332
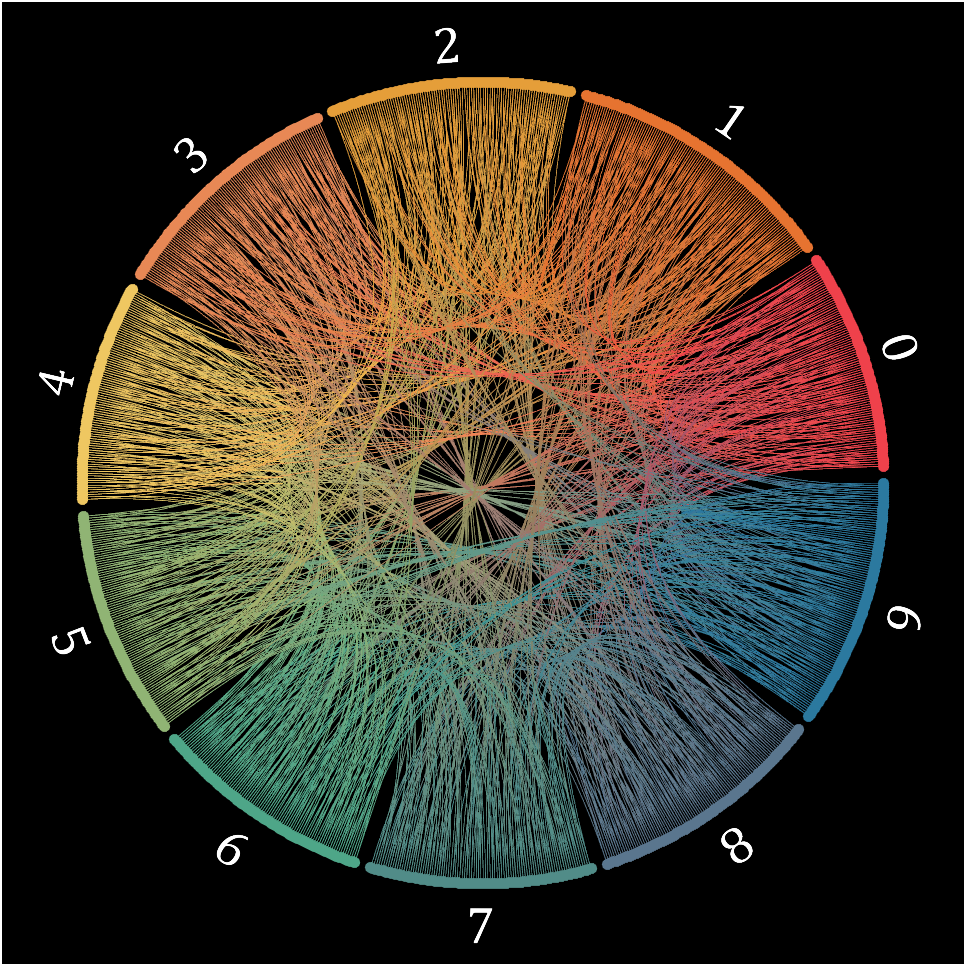
Class=getPi(1001)+1;
Data=diag(ones(1,1000),-1);

className={

    '0','1','2','3','4','5','6','7','8','9'};
colorOrder=[239,65,75;230,115,48;229,158,57;232,136,85;239,199,97;
           144,180,116;78,166,136;81,140,136;90,118,142;43,121,159]./255;


CC=circosChart(Data,Class,'ClassName',className,'ColorOrder',colorOrder);
CC=CC.draw();

ax=gca;
ax.Color=[0,0,0];
CC.setClassLabel('Color',[1,1,1],'FontSize',25,'FontName','Cambria')
CC.setLine('LineWidth',.7)
完
有几段代码属耗头发,希望大家多多点赞哇,若想要直接下载此处提供网盘链接:
链接:https://pan.baidu.com/s/1MBJHN571iIvbwyGzcL-3TQ?pwd=slan
提取码:slan
或前往以下Gitee仓库,
https://gitee.com/slandarer/happy-pi-day
或前往以下fileexchange项目下载:
Zhaoxu Liu / slandarer (2023). Happy Pi Day (https://www.mathworks.com/matlabcentral/fileexchange/126210-happy-pi-day), MATLAB Central File Exchange. 检索来源 2023/3/13.
再次祝大家πDay快乐!