文章目录
分布式链路追踪出现的背景
- 单一的springboot项目
以前的业务需求为单一的一个逻辑。 - 多个微服务组成的SpringCloud项目
一个业务牵扯到很多的微小服务组成。
在Springcloud做分布式开发,通常会在某个处理量大的微服务做高可用处理。
但是出现错误信息时,定位出错点会是一个很麻烦的问题。
某个微服务做了集群化部署,其中某个出问题,需要很大的劳力和时间去排查问题根源。
这只是常见问题之一,网上给出的大型微服务架构系统出现的问题有如下几种:
- 如何串联调用链,快速定位问题。
- 如何弄清微服务之间的依赖关系。
- 如何进行各种服务接口的性能分析。
- 如何跟踪业务流的处理顺序。
Sleuth 流程概述
查看 Sleuth 官方文档,会看到如下的流程图所示:
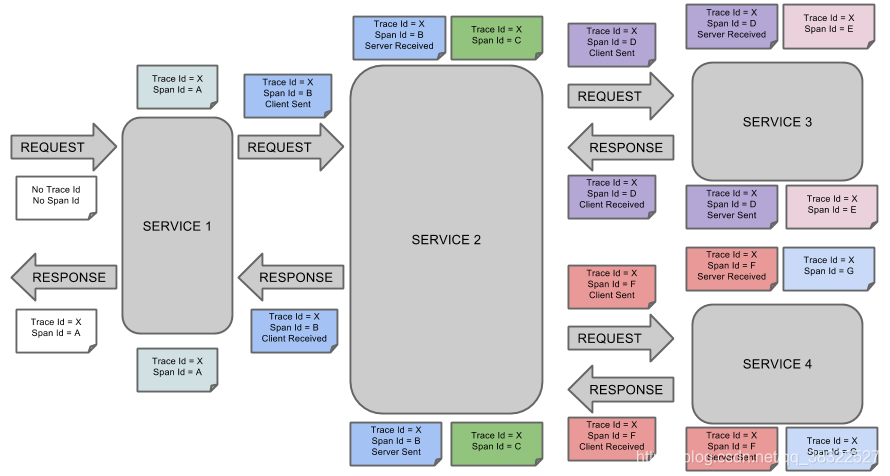
初次看到这个流程图,很懵逼。上面有很多的参数信息,但分别都表示什么意思?
Trance Id (请求唯一标识):
1、图示中的流程,一直显示 Trance id = x。
2、表示每个请求,都会有一个唯一的标识。
3、请求处理流程:
Client–>servicce 1 -->service 2 -->service 3 -->service 4 --> service 2 --> service 1 -->client 。
4、在一个请求 request 到各项微服务,以至最后response时,Trance id 均保持不变。
5、Trance Id 是一整个链路的唯一id。
Span Id (一个跨度):
Span 是一个跨度的唯一id。
Span Id = A 就是 Service 1的跨度id;
Span Id = B 就是 Service 2 的跨度id;
…
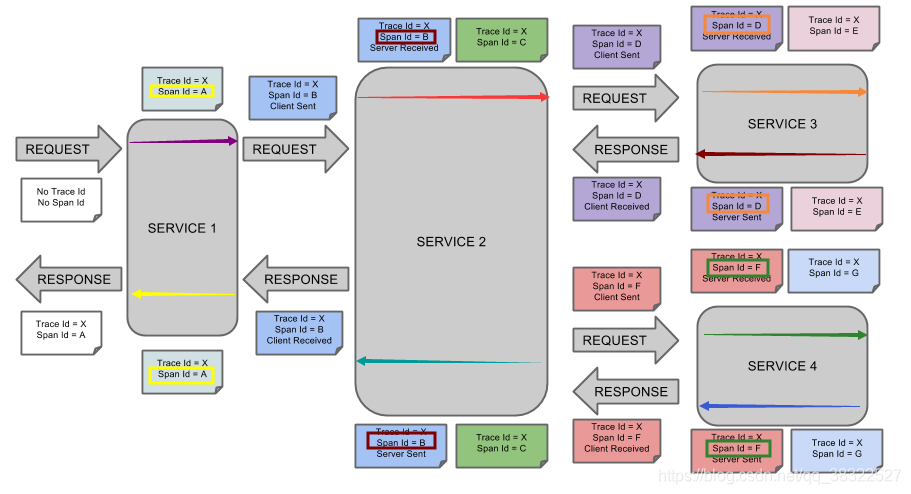
流程图的名词解释
| 术语 | 学名 | 描述 |
|---|---|---|
| span | 基本工作单元。(跨度) | span用一个64位的id唯一标识。除ID外,span还包含其他数据,例如描述、时间戳事件、键值对的注解(标签), spanID、span父 ID等。 span被启动和停止时,记录了时间信息。初始化 span被称为"rootspan",该 span的 id和 trace的 ID相等。 |
| trace | 跟踪 | 64位的 ID唯一标识,每个请求线程编号不同,且每个包含的span都共享这个trace id |
| CS | Client sent客户端发送 | 客户端发起一个请求,该 annotation描述了span的开始。 |
| SR | server Received服务器端接收 | 服务器端获得请求并准备处理它。如果用 SR减去 CS时间戳,就能得到网络延迟。 |
| SS | server sent服务器端发送 | 该 annotation表明完成请求处理(当响应发回客户端时)。如果用 SS减去 SR时间戳,就能得到服务器端处理请求所需的时间。 |
| CR | Client Received客户端接收 | span结束的标识。客户端成功接收到服务器端的响应。如果 CR减去 CS时间戳,就能得到从客户端发送请求到服务器响应的所需的时间。 |
| annotation | 标注 | annotation用来记录事件的存在,其中,核心annotation用来定义请求的开始和结束。(CS、SR、SS、CR 统称为 annotation) |
使用Zipkin试图化显示sleuth数据
nacos-product-sleuth 子服务创建
依赖中,需要使用到该项目流程的信息,所以需要引入org.springframework.cloud下的spring-cloud-starter-sleuth依赖,同时如果需要使用 Zipkin做视图显示时,还需要额外引入spring-cloud-starter-zipkin依赖信息。
详细pom.xml如下所示:
<!-- SpringCloud ailibaba nacos -->
<dependency>
    <groupId>com.alibaba.cloud</groupId>
    <artifactId>spring-cloud-starter-alibaba-nacos-discovery</artifactId>
</dependency>
<dependency>
    <groupId>org.springframework.boot</groupId>
    <artifactId>spring-boot-starter-web</artifactId>
</dependency>
<!--监控 -->
<dependency>
    <groupId>org.springframework.boot</groupId>
    <artifactId>spring-boot-starter-actuator</artifactId>
</dependency>
<!--每个服务都需要引用该依赖-->
<dependency>
    <groupId>org.springframework.cloud</groupId>
    <artifactId>spring-cloud-starter-zipkin</artifactId>
</dependency>
<!-- 引入 Sleuth依赖(引入了spring-cloud-starter-zipkin,这个依赖可以不需要引入) -->
<dependency>
    <groupId>org.springframework.cloud</groupId>
    <artifactId>spring-cloud-starter-sleuth</artifactId>
</dependency>
增加配置文件,主要用于注册至nacos注册中心、sleuth信息推送至ui显示等。
## 该服务的端口信息
server:
  port: 11000

## 服务别名和nacos服务注册发现地址配置
spring:
  application:
    name: nacos-product-sleuth
  zipkin:
    base-url: http://localhost:9411/  # 指向地址
    discovery-client-enabled: false # 让cloud将此连接当作是url,而不是服务名
  sleuth:
    sampler:
      probability: 1.0  #指定需要采样的请求的百分比,默认为 0.1f,即 10%
  cloud:
    nacos:
      discovery:
        server-addr: localhost:8848

## 监控相关
management.endpoints.web.exposure.include: '*'
启动类的编写
import org.springframework.boot.SpringApplication;
import org.springframework.boot.autoconfigure.SpringBootApplication;
import org.springframework.cloud.client.discovery.EnableDiscoveryClient;

@SpringBootApplication
@EnableDiscoveryClient
public class SleuthProduct11000 {


    public static void main(String[] args) {


        SpringApplication.run(SleuthProduct11000.class,args);
    }
}
创建外部访问接口
import org.springframework.beans.factory.annotation.Value;
import org.springframework.web.bind.annotation.PathVariable;
import org.springframework.web.bind.annotation.RequestMapping;
import org.springframework.web.bind.annotation.RestController;

@RestController
public class TestController {


    @Value("${server.port}")
    private String port;

    @RequestMapping("/product/getProduct/{id}")
    public String getOrder(@PathVariable("id") String id) {


//        try {


//            Thread.sleep(800);
//        } catch (InterruptedException e) {


//            e.printStackTrace();
//        }
        return "this is product services,port:"+port+"\t id="+id;
    }
}
nacos-zipkin-client 消费者子服务
依赖引入和配置文件同上一致,如果为了显示更加具体的sleuth信息,配置文件中可以配置下列信息
# 打印更多的日志信息
logging:
  level:
    org.springframework.cloud.sleuth: debug
创建接口,作为内部调用nacos-product-sleuth中提供的接口信息。由于此处使用openFeign,所以依赖中需要额外添加openfeign引入:
<dependency>
    <groupId>org.springframework.cloud</groupId>
    <artifactId>spring-cloud-starter-openfeign</artifactId>
</dependency>
编写控制类,创建对外暴露接口:
import cn.linkpower.ProductFeignService;
import org.springframework.beans.factory.annotation.Autowired;
import org.springframework.web.bind.annotation.RequestMapping;
import org.springframework.web.bind.annotation.RestController;

@RestController
public class TestController {


    @Autowired
    private ProductFeignService productFeignService;

    @RequestMapping("/test")
    public  String test(){


        return "this is zipkin client test  "+productFeignService.getOrder("1");
    }
}
编写feign服务接口调用
import org.springframework.cloud.openfeign.FeignClient;
import org.springframework.web.bind.annotation.PathVariable;
import org.springframework.web.bind.annotation.RequestMapping;

@FeignClient(value = "nacos-product-sleuth")
public interface ProductFeignService {


    @RequestMapping("/product/getProduct/{id}")
    public String getOrder(@PathVariable("id") String id);
}
当然此处需要做fallback,构建降级返回数据信息。
其次还有最重要的一点,再启动类上需要新增@EnableFeignClients注解,开启feign。
import org.springframework.boot.SpringApplication;
import org.springframework.boot.autoconfigure.SpringBootApplication;
import org.springframework.cloud.client.discovery.EnableDiscoveryClient;
import org.springframework.cloud.openfeign.EnableFeignClients;

@SpringBootApplication
@EnableDiscoveryClient //注册至注册中心中,调入了nacos依赖,可以无需此依赖信息
@EnableFeignClients //启用激活feign
public class ZipkinClient10000 {


    public static void main(String[] args) {


        SpringApplication.run(ZipkinClient10000.class,args);
    }
}
下载启动Zipkin
在 Spring Cloud中,最初构建Zipkin的ui显示时,需要开发者去创建一个Zipkin-server子服务,做sleuth子服务数据的推送接受器。但在spring cloud alibaba中,则不需要额外配置,只需要下载,然后java -jar xxx启动即可,就像sentinel一样。
其下载地址链接如下所示:
下载后,使用 java -jar .\zipkin-server-2.12.9-exec.jar启动即可这里使用的版本为2.12.9。
启动测试
分别启动nacos、zipkin-server、nacos-product-sleuth、nacos-zipkin-client。
访问 zipkin-server 服务界面链接
http://localhost:9411/zipkin/

请求子服务链接:
http://localhost:10000/test
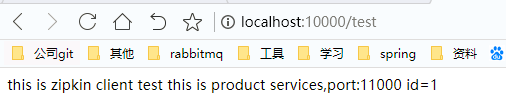
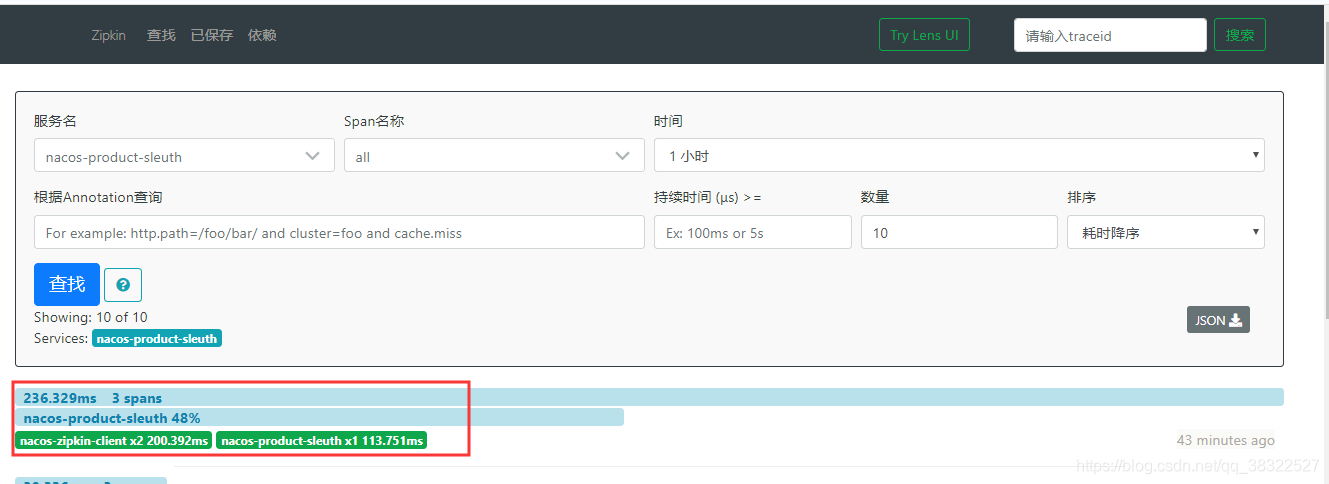
返回zipkin 的ui界面,刷新查看。
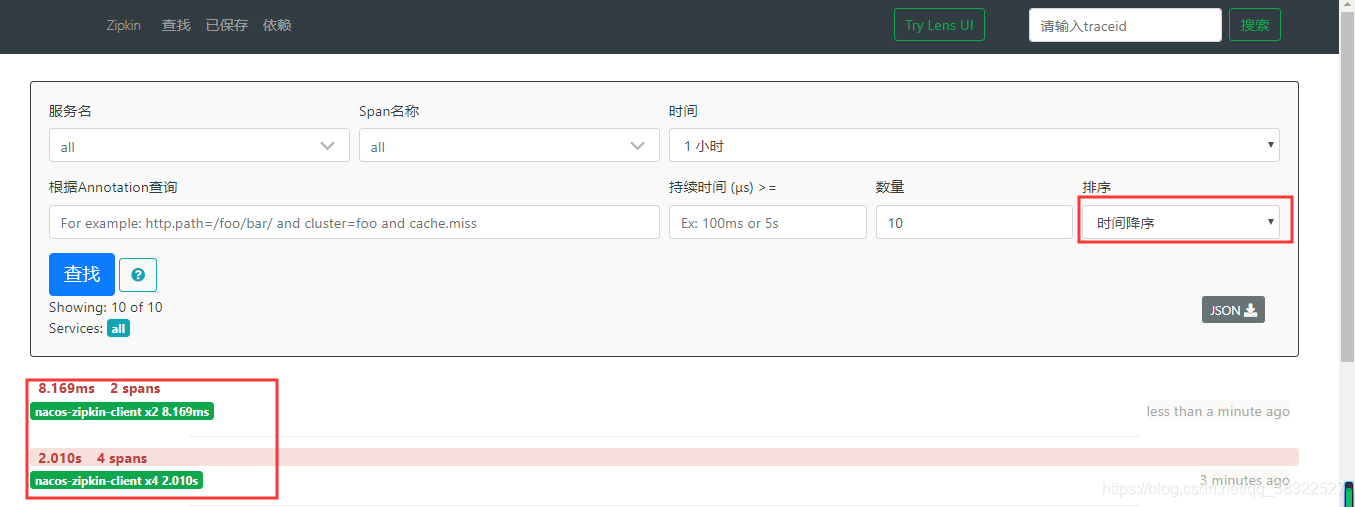
如果某个服务宕机了(关闭nacos-product-sleuth),此时的链路信息为:
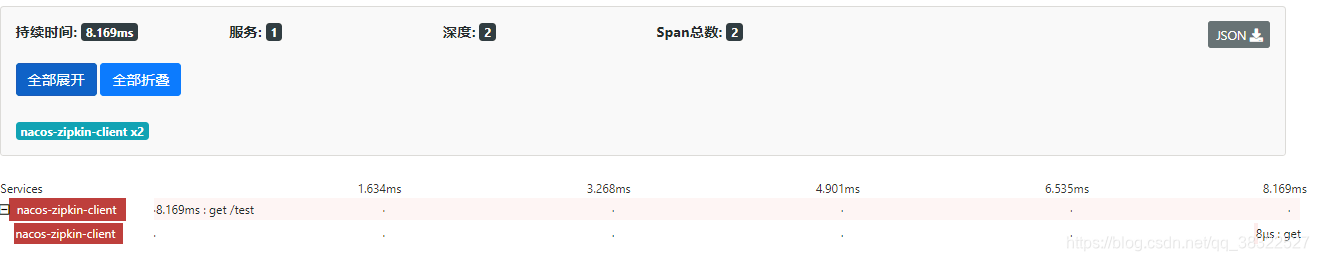
此处点击进入查看
参考文章
SpringCloud alibaba新版本教程[sleuth-zipkin链路]-13
Spring Cloud Alibaba学习笔记(23) - 调用链监控工具Spring Cloud Sleuth + Zipkin
代码下载
sleuth-cloud-admin-10000
sleuth-cloud-admin-product