一,安装
官方网址:
https://echarts.apache.org/zh/index.html
采用npm:
npm install echarts --save
二,基本使用
这里主要讲在vue单页面开发中怎么使用
1,先定义好echarts通用化组件
<template>
    <div :class="className" :style="{height:height,width:width}" />
</template>
<script>
// 按需引入 引入 ECharts 主模块
let echarts = require('echarts/lib/echarts')
// 引入柱状图
require('echarts/lib/chart/bar')

// 引入提示框和标题组件
require('echarts/lib/component/tooltip')
require('echarts/lib/component/title')
require('echarts/lib/component/legend')

export default {


    props: {


        className: {


            type: String,
            default: 'chart'
        },
        width: {


            type: String,
            default: '100%'
        },
        height: {


            type: String,
            default: '350px'
        },
        // 父组件传递过来的图表数据
        chartData: {


            type: Object,
            required: true
        }

    },
    data() {


        return {


            // Echarts实例
            chart: null,
        };
    },
    watch: {


        /* 如果图表数据是后台获取的,监听父组件中的数据变化,重新触发Echarts */
        chartData: {


            deep: true,
            handler(val) {


                this.setOptions(val)
            }
        }
    },
    mounted() {


        /* 图表初始化 */
        this.$nextTick(() => {


            this.initChart()
        })
    },
    beforeDestroy() {


        if (!this.chart) {


            return
        }
        /* 释放图表实例 */
        this.chart.dispose()
        /* dispose 会释放内部占用的一些资源和事件绑定,但是解除实例的引用我们是做不到的,所以需要重新赋值为null */
        this.chart = null
    },
    methods: {


        initChart() {


            //使用准备好的dom,初始化echarts实例
            this.chart = echarts.init(this.$el)
            this.setOptions(this.chartData)
        },
        //重新触发echarts表格,使用传入的数据进行渲染,如果未传入,则传入空对象
        setOptions(option = {

    }) {


            this.chart.setOption(option)
        }
    }
};
</script>
<style scoped>
</style>
2,在页面中使用这个组件–这里主要是要把图表的数据传入组件中
<template>
<div class="revenueBox">
<div class="container">
<el-radio-group v-model="rangeRadio" size="small">
<el-radio-button label="1">当日</el-radio-button>
<el-radio-button label="2">近7天</el-radio-button>
<el-radio-button label="3">近30天</el-radio-button>
</el-radio-group>
<!-- 时间范围选择 -->
<el-date-picker type="datetime" placeholder="开始时间" v-model="startTime" class="w170 ml20"></el-date-picker>
<span class="tace ml10 cogr">--</span>
<el-date-picker type="datetime" placeholder="结束时间" v-model="endTime" class="w170 ml10"></el-date-picker>
<el-button size="small" class="ml20" type="primary" >确定</el-button>
</div>
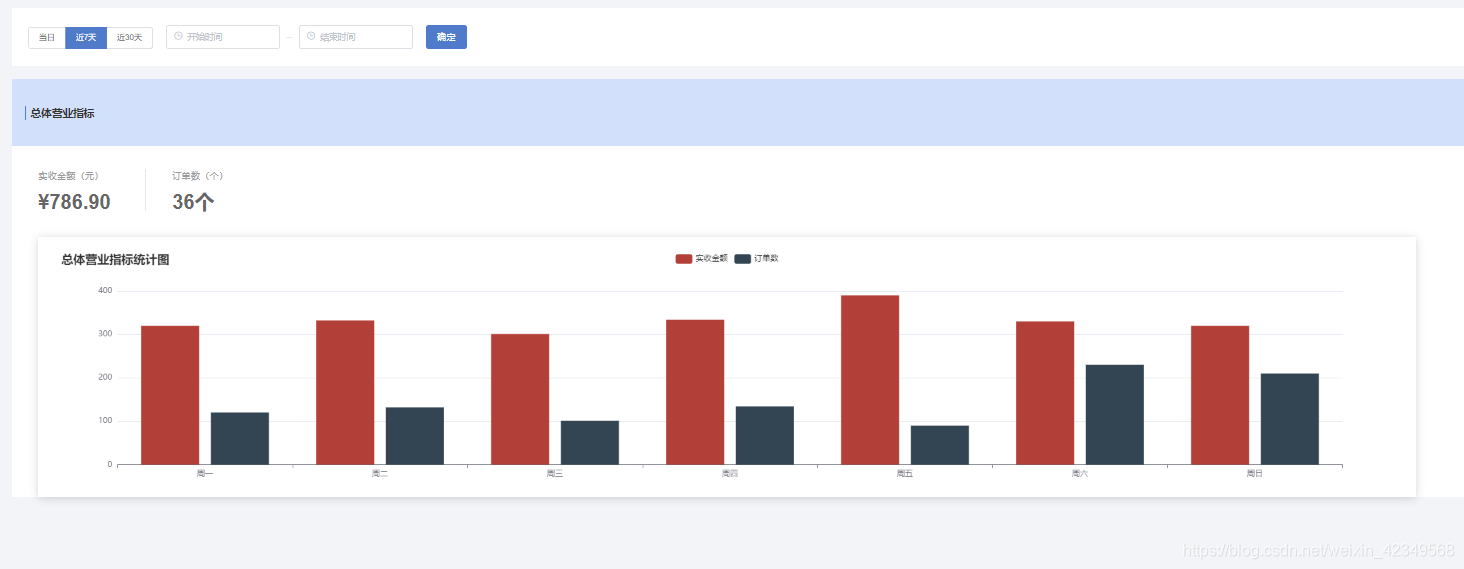
<!-- 总体营业指标 -->
<div class="container mt20 echartsBox">
<div class="title">
<div class="chart-title">总体营业指标</div>
</div>
<div class="chart-data ml40">
<div class="chart-data-item">
<div class="co9">实收金额(元)</div>
<div class="co6 f30 fwb mt10 lh42">¥786.90</div>
</div>
<div class="chart-data-separate"></div>
<div class="chart-data-item">
<div class="co9">订单数(个)</div>
<div class="co6 f30 fwb mt10 lh42">36个</div>
</div>
</div>
<div class="chart-area ml40">
<echarts :chartData="option" ></echarts>
</div>
</div>
</div>
</template>
<script>
import Echarts from '@/components/echarts';
export default {
components:{
Echarts,
},
name: "revenueMain",
data() {
return {
rangeRadio:'2',
startTime:'',
endTime:'',
option: {
title: {
text: '总体营业指标统计图',
textStyle: {
color: "#333333"
},
},
tooltip: {
trigger: 'axis',
axisPointer: {
// 坐标轴指示器,坐标轴触发有效
type: 'shadow' // 默认为直线,可选为:'line' | 'shadow'
}
},
color: ["#B34038", "#334553"],
legend: {
data: ['实收金额', '订单数']
},
grid: {
left: '3%',
right: '4%',
bottom: '3%',
containLabel: true
},
xAxis: [
{
type: 'category',
data: ['周一', '周二', '周三', '周四', '周五', '周六', '周日']
}
],
yAxis: [
{
type: 'value'
}
],
series: [
{
name: '实收金额',
type: 'bar',
data: [320, 332, 301, 334, 390, 330, 320]
},
{
name: '订单数',
type: 'bar',
stack: '广告',
data: [120, 132, 101, 134, 90, 230, 210]
}
]
}
};
},
created() {
},
mounted() {
},
methods: {
},
};
</script>
<!-- Add "scoped" attribute to limit CSS to this component only -->
<style lang="less" scoped>
.revenueBox .echartsBox{
padding: 0 ;
.title{
background: #D2E0FC;
height: 60px;
display: flex;
align-items: center;
}
}
.container{
background: #FFFFFF;
padding: 25px 24px;
}
.chart-title{
border-left: 2px solid #4F7BCA;
padding-left: 6px;
color: #333333;
font-size: 16px;
font-weight: bold;
}
.chart-data{
display: flex;
margin-top: 35px;
&-item{
width: 160px;
height: 62px;
}
&-separate{
width: 1px;
height: 62px;
margin-right: 40px;
background: #E9E8E8;
}
}
.chart-area{
width: 76%;
margin-top: 40px;
padding: 20px 30px;
box-shadow: 0 2px 13px 0 rgba(75, 75, 75, 0.23);
}
.dyic{
display: block;}
.w170{
width: 170px;}
.ml20{
margin-left: 20px;}
.cogr{
color:#E9E8E8;}
.lh42{
line-height: 42px;}
</style>
3,实际效果