svg绘制pie饼图
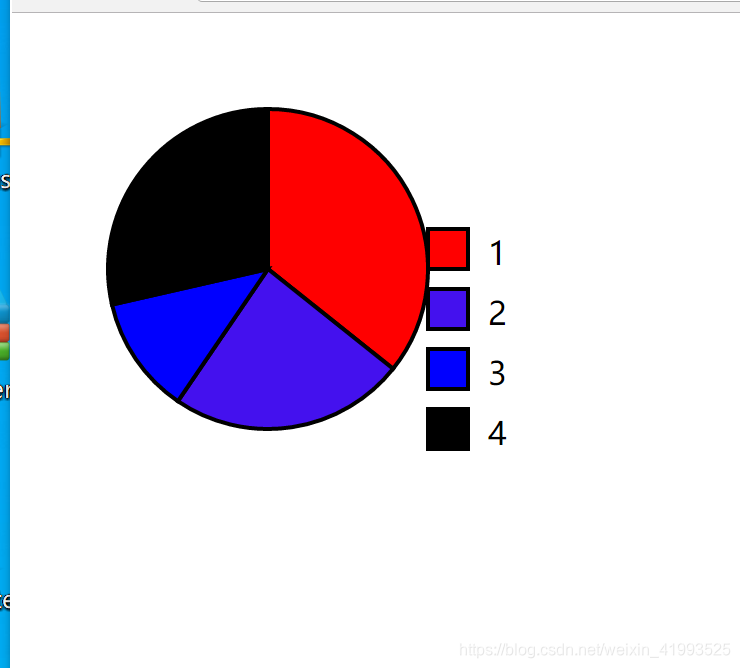
let arr=[300,200,100,240];
let color=["red","#41e","blue"];
let labels=["1","2","3","4"];
let pieData = pieChart(arr,300,300,120,120,80,color,labels,200,100);
console.log(pieData);
document.getElementById("svg").appendChild(pieData);
function pieChart(data,width,height,cx,cy,r,colors,labels,lx,ly){


    let svgns = "http://www.w3.org/2000/svg";
    let chart=document.createElementNS(svgns,"svg:svg");
    chart.setAttribute("width",width);
    chart.setAttribute("height",height);
    chart.setAttribute("viewBox","0 0 " + width + " " + height);
    let total = 0;
    for(let i=0;i<data.length;i++){


        total += data[i];
    }
    let angles = [];
    for(let i=0;i<data.length;i++){


        angles[i] = data[i]/total * Math.PI*2;
    }
    let anglesExp=null
    for(let i=0;i<angles.length;i++){


        anglesExp += angles[i];
    }
    console.log(anglesExp);

    startangle = 0;
    for(let i=0;i<data.length;i++){


    	let endangle = startangle + angles[i];
    	let x1 = cx + r* Math.sin(startangle);
	    let y1 = cy - r*Math.cos(startangle);
    	let x2 = cx + r* Math.sin(endangle);
    	let y2 = cy - r*Math.cos(endangle);

    	let big = 0;
    	if(endangle - startangle > Math.PI) big = 1;
    	let path = document.createElementNS(svgns,"path");
    	let d = "M " + cx + "," + cy + " L " + x1 + "," + y1 + " A " + r + "," + r + " 0 " + big + " 1 " + x2 + "," + y2 + " Z";

    	path.setAttribute("d", d);
    	path.setAttribute("fill", colors[i]);
    	path.setAttribute("stroke","black");
    	path.setAttribute("stroke-width", "2");
    	chart.appendChild(path);
     	startangle = endangle;

    	let icon = document.createElementNS(svgns,"rect");
    	icon.setAttribute("x",lx);
    	icon.setAttribute("y",ly + 30*i);
    	icon.setAttribute("width",20);
    	icon.setAttribute("height",20);
    	icon.setAttribute("fill",colors[i]);
    	icon.setAttribute("stroke","black");
    	icon.setAttribute("stroke-width","2");
    	chart.appendChild(icon);

    	let label = document.createElementNS(svgns,"text");
    	label.setAttribute("x",lx + 30);
    	label.setAttribute("y",ly + 30*i + 18);

    	label.setAttribute("font-family","sans-serif");
    	label.setAttribute("font-size",16);
    	label.appendChild(document.createTextNode(labels[i]));
    	chart.appendChild(label);
	}
    return chart;
}
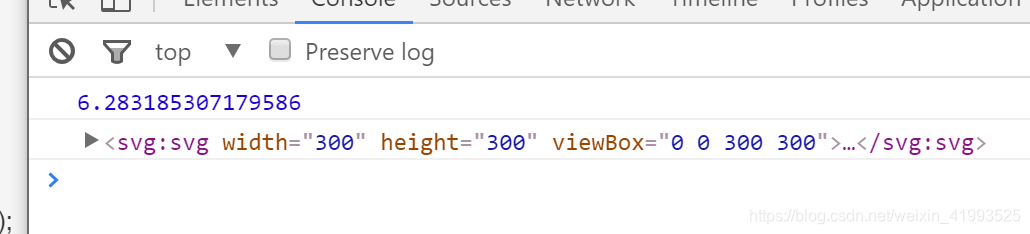
2*Math.PI
2π代表一个圆周的角度,即360°。
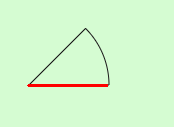
解读三角函数sin/cos计算svg路线画扇形圆边左边
svg绘制圆饼图必然会根据数组内各项数据与总数的比例来配置各项对应的角度数(弧度制),然后根据角度与给定的半径r绘制和给定数组内每一项对应的扇形区,最后形成圆饼图。
这里的核心是:
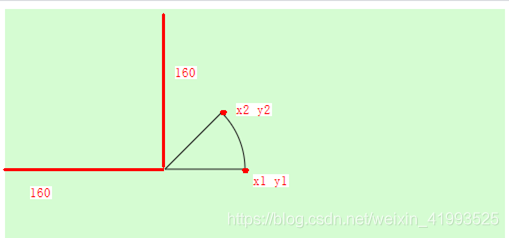
给定的svg饼图圆心cx/cy、扇形弧坐标1(x1,y1)/坐标2(x2,y2)、svg路径工具path的d属性【M(移动画笔)/L(画线)/A(绘制圆)/z闭合路径】
x1/y1、x2/y2坐标相对于圆心cx/cy,通过三角函数sin/cos即可求得。
<svg x="100px" y="100px" width="431px" height="439px" viewBox="0 0 331 139" version="1.1" id="this_flex">
<path :d="'M ' + cx + ',' + cy + ' L ' + x1 + ',' + y1 + ' A ' + r + ',' + r + ' 0 ' + big + ' 1 ' + x2 + ',' + y2 + ' Z'" class="house" stroke="#1A1919" fill="none" stroke-width="1"></path>
</svg>
export default {


  data() {


    let r = 80;
    let startangle = 0;
    let endangle = Math.PI/4;
    let big = 0, cx = 160,cy = 160, x1, y1, x2, y2;
    if(endangle - startangle > Math.PI){


      big = 1
    }
    x1 = cx + r * Math.sin(startangle);
    y1 = cy - r * Math.cos(endangle);
    x2 = cx + r * Math.sin(endangle - startangle);
    y2 = cy - r * Math.cos(endangle - startangle);
    return {


      r:r,
      cx:cx,
      cy:cy,
      x1:x1,
      y1:y1,
      x2:x2,
      y2:y2,
      big:big,
      startangle:startangle,
      endangle:endangle,
    }
  },
}
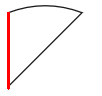
以上的写法计算起始轴为竖直方向(y)。
<svg class="special" x="0px" y="0px" width="500px" height="500px" viewBox="0 0 500 500" version="1.1" id="this_flex">
    <path :d="'M ' + cx + ',' + cy + ' L ' + x1 + ',' + y1 + ' A ' + r + ',' + r + ' 0 ' + big + ' 0 ' + x2 + ',' + y2 + ' Z'" class="house" stroke="#1A1919" fill="none" stroke-width="1"></path>
</svg>
export default {


  data() {


    let r = 80;
    let startangle = 0;
    let endangle = Math.PI/4;
    let big = 0, cx = 160,cy = 160, x1, y1, x2, y2;
    if(endangle - startangle > Math.PI){


      big = 1
    }
    x1 = cx + r * Math.cos(startangle); // 240
    y1 = cy - r * Math.sin(startangle);   // 160
    x2 = cx + r * Math.cos(endangle); // 216
    y2 = cy - r * Math.sin(endangle); // 103
    console.log(cx,cy,x1,y1,x2,y2);
    return {


      r:r,
      cx:cx,
      cy:cy,
      x1:x1,
      y1:y1,
      x2:x2,
      y2:y2,
      big:big,
      startangle:startangle,
      endangle:endangle,
    }
  },
}