上代码:
import matplotlib.pyplot as plt
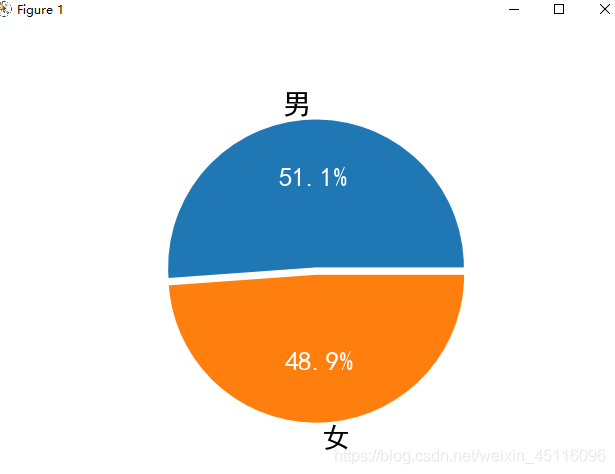
men=71371
women=68187
men_pec=men/(men+women)#男比例
women_pec=women/(men+women)#女比例
plt.rcParams['font.sans-serif']=['SimHei']#解决中文显示问题
labels=['男','女']
# labels是名称,explode爆炸,也就是饼状图之间的间隙,atuopct显示百分比
paches,texts,autotexts=plt.pie([men_pec,women_pec],labels=labels,explode=(0,0.05),autopct=('%0.1f%%'))
#设置饼状图中字体颜色
for text in autotexts:
text.set_color('white')
#设置字体大小
for text in texts+autotexts:
text.set_fontsize(20)
plt.show()
运行截图: