系列文章目录
Python专栏 | 脑电图和脑磁图(EEG/MEG)的数据分析方法之载入数据
Python专栏 | MNE脑电数据(EEG/MEG)可视化
Python专栏 | 独立成分分析(ICA)的实例应用:消除伪影信号
持续更新中……
文章目录
识别伪影信号的方法
1. Selecting ICA components manually (手动识别)
确定要排除的Components后,可以通过设置ica.exclude属性手动指定。
仅设置ica.exclude不会立即执行任何操作,只会将排除的Independent Components (IC)添加到列表中,以便之后在需要时使用。
一旦设置了排除项,即使未传递exclude参数,比如plot_overlay的ICA方法,也会排除指定的Components。
使用mne.preprocessing.ICA.save和mne.preprocessing.read_ica时可以保留被排除的Components列表。
代码示例:
ica.exclude = [0, 1] #indices chosen based on various plots above
现在我们已经设置好了排除项(ica.exclude),接着我们可以使用ica.apply的方法重塑已经去除伪影的传感器信号。
即现在进入了下图中的ica.apply环节。
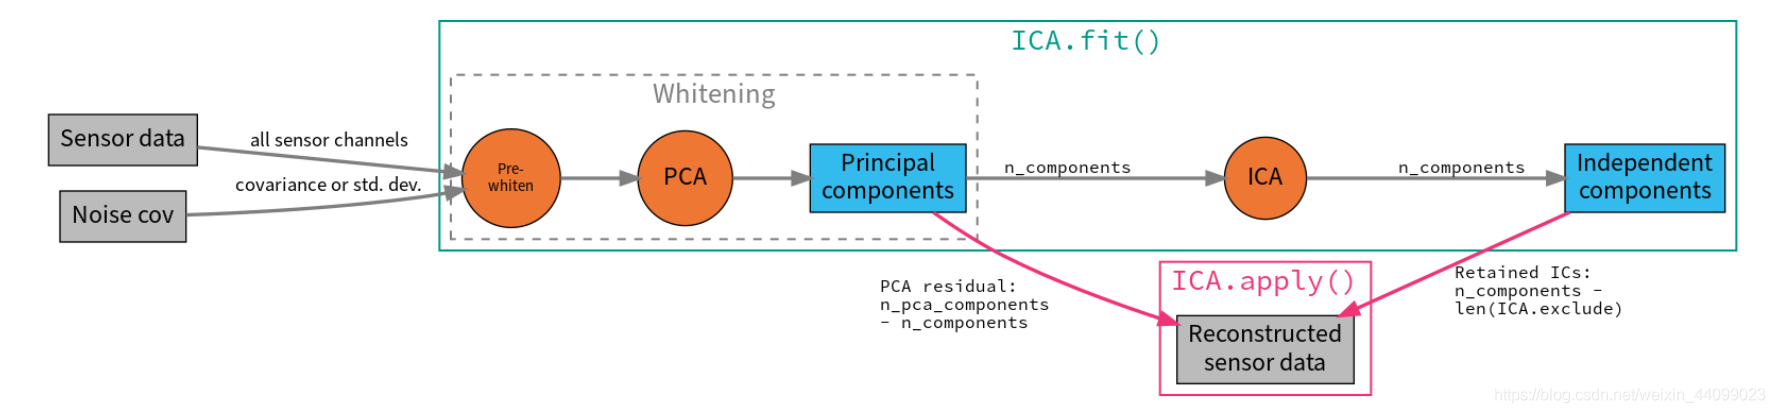
▲点击图片可查看大图
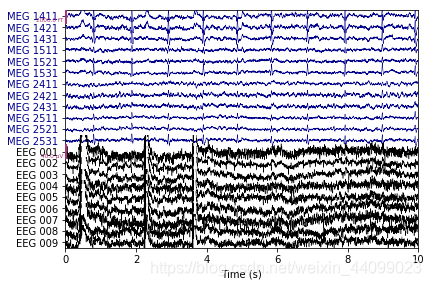
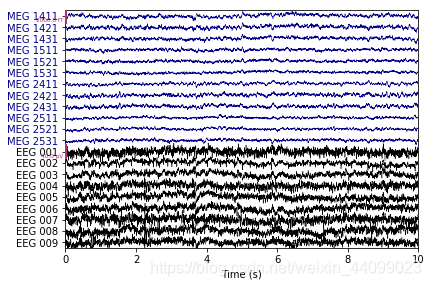
我们将把原始数据与重塑的数据一起绘制,来表明心跳和眨眼伪影已得到修复。
代码示例:
#ica.apply() changes the Raw object in-place, so let's make a copy first:
raw.load_data()
reconst_raw = raw.copy()
ica.apply(reconst_raw)

#原始数据
raw.plot(order=artifact_picks, n_channels=len(artifact_picks),
         show_scrollbars=False)
#重塑数据,和原始数据进行对比,来表明心跳和眨眼伪影已得到修复。
reconst_raw.plot(order=artifact_picks, n_channels=len(artifact_picks),
                 show_scrollbars=False)
del reconst_raw #删除变量reconst_raw
输出结果:
Applying ICA to Raw instance
    Transforming to ICA space (15 components)
    Zeroing out 2 ICA components
    Projecting back using 364 PCA components
2. Using an EOG channel to select ICA components
通过上面手动选择要排除的IC的方法似乎比较简单,但是当需要处理成百上千个被试的数据时,手动排除的方式就略显繁琐。
在这种情况下,比较合理的做法是:首先使用专用的EOG或ECG传感器进行实验,把由此测得的信号作为一种“模型(pattern)”,然后将“模型”与每一种IC相对应,利用算法自动标记出和“EOG / ECG模型信号”匹配的所有ICs。
在mne-python包里,我们将使用find_bads_eog自动查找与EOG信号最匹配的ICs,然后再使用plot_scores以及其他一些绘图功能来查看选择了哪些IC。
由于在手动选择步骤里,我们使用了ica.exclude = [0, 1],手动选择了ICA001和ICA000,因此在使用自动选择功能函数前,我们首先需要将ica.exclude重置为空列表。
代码示例:
#自动选择与ECG和EOG信号对应的ICs
ica.exclude = []#首先将ica.exclude变成空列表
#find which ICs match the EOG pattern
eog_indices, eog_scores = ica.find_bads_eog(raw)
ica.exclude = eog_indices
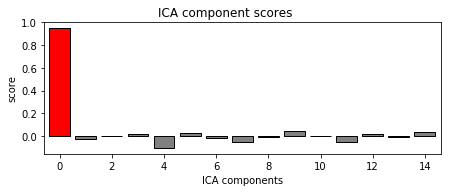
# barplot of ICA component "EOG match" scores
ica.plot_scores(eog_scores)
#eog_scores是计算每个ICs(本例子里共有15个ICs)与EOG信号的match scores。绝对值越接近1代表匹配度越高,越接近0代表匹配度越低。
#由画出的条形图可以看出,ICA000的值是0.94763376,匹配度最高。
# plot diagnostics
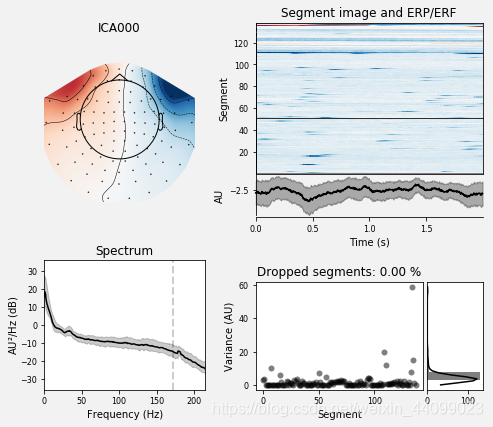
ica.plot_properties(raw, picks=eog_indices)
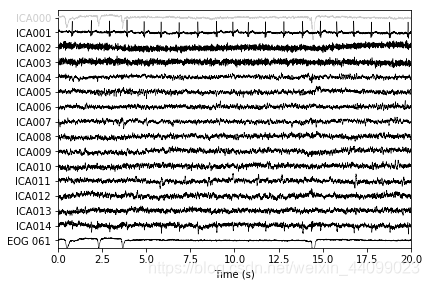
# plot ICs applied to raw data, with EOG matches highlighted
ica.plot_sources(raw, show_scrollbars=False)
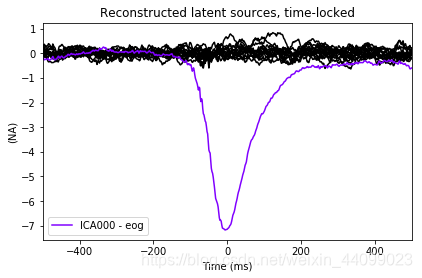
# plot ICs applied to the averaged EOG epochs, with EOG matches highlighted
ica.plot_sources(eog_evoked)
输出结果:
filtering target
Setting up band-pass filter from 1 - 10 Hz

FIR filter parameters
---------------------
Designing a two-pass forward and reverse, zero-phase, non-causal bandpass filter:
- Windowed frequency-domain design (firwin2) method
- Hann window
- Lower passband edge: 1.00
- Lower transition bandwidth: 0.50 Hz (-12 dB cutoff frequency: 0.75 Hz)
- Upper passband edge: 10.00 Hz
- Upper transition bandwidth: 0.50 Hz (-12 dB cutoff frequency: 10.25 Hz)
- Filter length: 6007 samples (10.001 sec)

C:\ProgramData\Anaconda3\lib\site-packages\mkl_fft\_numpy_fft.py:331: FutureWarning: Using a non-tuple sequence for multidimensional indexing is deprecated; use `arr[tuple(seq)]` instead of `arr[seq]`. In the future this will be interpreted as an array index, `arr[np.array(seq)]`, which will result either in an error or a different result.
  output = mkl_fft.rfft_numpy(a, n=n, axis=axis)

Using multitaper spectrum estimation with 7 DPSS windows
Not setting metadata
Not setting metadata
138 matching events found
No baseline correction applied
0 projection items activated
0 bad epochs dropped
C:\ProgramData\Anaconda3\lib\site-packages\mkl_fft\_numpy_fft.py:331: FutureWarning: Using a non-tuple sequence for multidimensional indexing is deprecated; use `arr[tuple(seq)]` instead of `arr[seq]`. In the future this will be interpreted as an array index, `arr[np.array(seq)]`, which will result either in an error or a different result.
  output = mkl_fft.rfft_numpy(a, n=n, axis=axis)

Creating RawArray with float64 data, n_channels=16, n_times=166800
    Range : 25800 ... 192599 =     42.956 ...   320.670 secs
Ready.
以上我们在原始Raw实例以及提取了EOG伪影的Evoked实例上都使用了plot_sources。这可以是另一种确认find_bads_eog已标识正确component的方法。
总结
今天用到的代码总结:
#手动选择要排除的ICs
ica.exclude = [0, 1]  # indices chosen based on various plots above

#现在我们已经设置好了排除项(ica.exclude)
#接着我们可以使用ica.apply的方法重塑已经去除伪影的传感器信号。
#ica.apply() changes the Raw object in-place, so let's make a copy first:
raw.load_data()
reconst_raw = raw.copy()
ica.apply(reconst_raw)

#原始数据
raw.plot(order=artifact_picks, n_channels=len(artifact_picks),
         show_scrollbars=False)
#重塑数据,和原始数据进行对比,来表明心跳和眨眼伪影已得到修复。
reconst_raw.plot(order=artifact_picks, n_channels=len(artifact_picks),
                 show_scrollbars=False)
del reconst_raw #删除变量reconst_raw


#自动选择与ECG和EOG信号对应的ICs
ica.exclude = []#首先将ica.exclude变成空列表

#find which ICs match the EOG pattern
eog_indices, eog_scores = ica.find_bads_eog(raw)
ica.exclude = eog_indices

# barplot of ICA component "EOG match" scores
ica.plot_scores(eog_scores)
#eog_scores是计算每个ICs(本例子里共有15个ICs)与EOG信号的match scores。绝对值越接近1代表匹配度越高,越接近0代表匹配度越低。
#由画出的条形图可以看出,ICA000的值是0.94763376,匹配度最高。

# plot diagnostics
ica.plot_properties(raw, picks=eog_indices)

# plot ICs applied to raw data, with EOG matches highlighted
ica.plot_sources(raw, show_scrollbars=False)

# plot ICs applied to the averaged EOG epochs, with EOG matches highlighted
ica.plot_sources(eog_evoked)
参考链接
https://mne.tools/stable/auto_tutorials/preprocessing/plot_40_artifact_correction_ica.html#fitting-and-plotting-the-ica-solution
未完待续……
欲知后事如何,请关注我们的公众号:脑机接口研习社