系列文章目录
Python专栏 | 脑电图和脑磁图(EEG/MEG)的数据分析方法之载入数据
Python专栏 | MNE脑电数据(EEG/MEG)可视化
Python专栏 | 独立成分分析(ICA)的实例应用:消除伪影信号
持续更新中……
Using a simulated channel to select ICA components
如果您没有测EOG信号,则还需要采取另外的方法。
find_bads_eog具有ch_name参数,可以将其用作EOG的代替。
可以使用单个波段(single channel);
也可以从前额脑电传感器波段(frontal EEG channels)创建双极性参照(bipolar reference)并将其用作虚拟的EOG波段。但是这需要建立在一个前提下:即前额叶EEG波段仅包含EOG,而不包含前额皮质中的大脑活动变化,或者前额皮质中的大脑活动变化可以忽略不计。
相比于EOG,ECG比较简单。find_bads_ecg可以使用磁力计或梯度仪波段的交叉波段平均(cross-channel averaging)来构建虚拟ECG波段。所以,MEG波段通常不必传递特定的波段名称。
find_bads_ecg包含两个参数:“ctps”(交叉实验阶段统计cross-trial phase statistics)和“correlation”(数据与ECG波段之间的皮尔逊相关)。
代码示例:
#通过模拟波段来选择ICA components
ica.exclude = []
# find which ICs match the ECG pattern
ecg_indices, ecg_scores = ica.find_bads_ecg(raw, method='correlation',
threshold='auto')
ica.exclude = ecg_indices
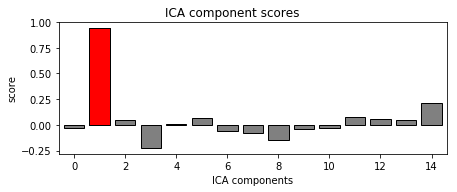
# barplot of ICA component "ECG match" scores
ica.plot_scores(ecg_scores)
# plot diagnostics
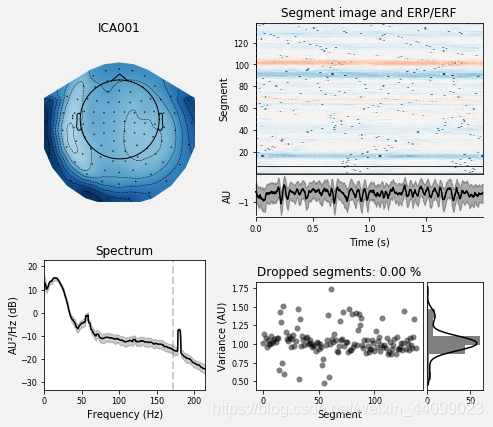
ica.plot_properties(raw, picks=ecg_indices)
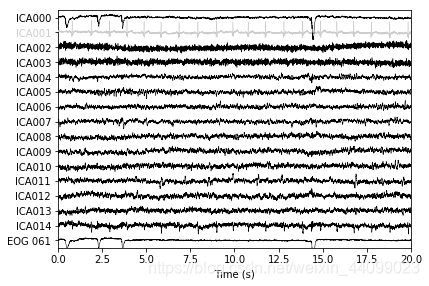
# plot ICs applied to raw data, with ECG matches highlighted
ica.plot_sources(raw, show_scrollbars=False)
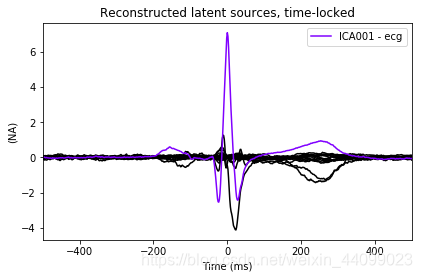
# plot ICs applied to the averaged ECG epochs, with ECG matches highlighted
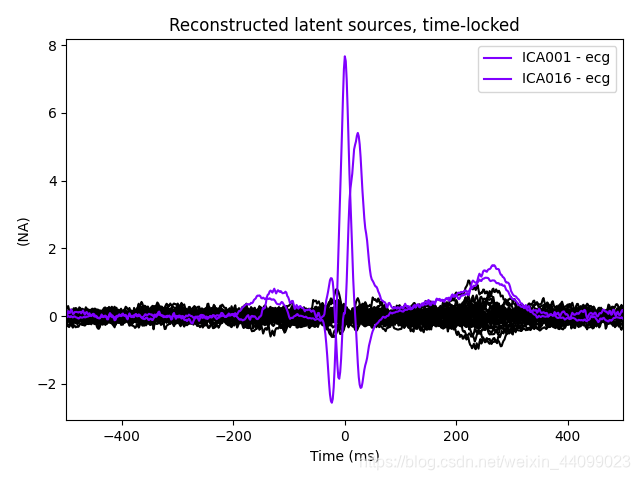
ica.plot_sources(ecg_evoked)
输出结果:

Using multitaper spectrum estimation with 7 DPSS windows
Not setting metadata
Not setting metadata
138 matching events found
No baseline correction applied
0 projection items activated
0 bad epochs dropped
C:\ProgramData\Anaconda3\lib\site-packages\mkl_fft\_numpy_fft.py:331: FutureWarning: Using a non-tuple sequence for multidimensional indexing is deprecated; use `arr[tuple(seq)]` instead of `arr[seq]`. In the future this will be interpreted as an array index, `arr[np.array(seq)]`, which will result either in an error or a different result.
  output = mkl_fft.rfft_numpy(a, n=n, axis=axis)

Creating RawArray with float64 data, n_channels=16, n_times=166800
    Range : 25800 ... 192599 =     42.956 ...   320.670 secs
Ready.
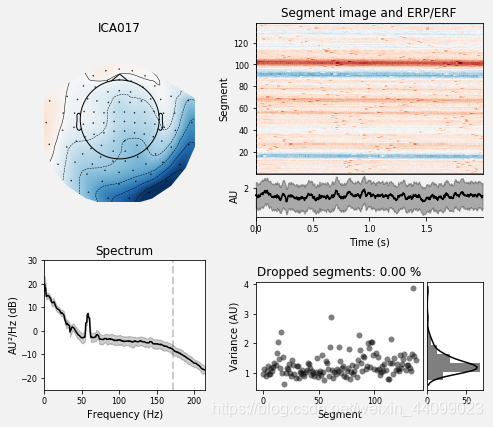
ECG输出的这几张图,如果仔细观察,可看到图中有两个IC上都出现了心跳信号,而我们却只捕获了其中的一个(ICA001)。
实际上,如果我们仔细查看plot_sources输出的两张图,放大,则看起来ICA014具有与ICA001同相的弱周期性分量。这值得我们重新运行带有更多components的ICA,以更好地独立出第二个心跳信号(ICA014)。
代码示例:
# refit the ICA with 30 components this time
new_ica = ICA(n_components=30, random_state=97)#这一次将components设置成30
new_ica.fit(filt_raw)
# find which ICs match the ECG pattern
ecg_indices, ecg_scores = new_ica.find_bads_ecg(raw, method='correlation',
threshold='auto')
new_ica.exclude = ecg_indices
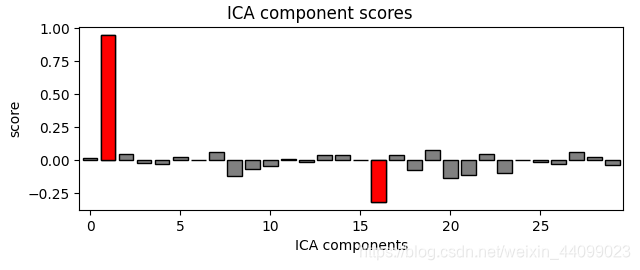
# barplot of ICA component "ECG match" scores
new_ica.plot_scores(ecg_scores)
# plot diagnostics
new_ica.plot_properties(raw, picks=ecg_indices)
# plot ICs applied to raw data, with ECG matches highlighted
new_ica.plot_sources(raw, show_scrollbars=False)
# plot ICs applied to the averaged ECG epochs, with ECG matches highlighted
new_ica.plot_sources(ecg_evoked)
输出结果:

filtering ICA sources
Setting up band-pass filter from 8 - 16 Hz

FIR filter parameters
---------------------
Designing a two-pass forward and reverse, zero-phase, non-causal bandpass filter:
- Windowed frequency-domain design (firwin2) method
- Hann window
- Lower passband edge: 8.00
- Lower transition bandwidth: 0.50 Hz (-12 dB cutoff frequency: 7.75 Hz)
- Upper passband edge: 16.00 Hz
- Upper transition bandwidth: 0.50 Hz (-12 dB cutoff frequency: 16.25 Hz)
- Filter length: 6007 samples (10.001 sec)

filtering target
Setting up band-pass filter from 8 - 16 Hz

FIR filter parameters
---------------------
Designing a two-pass forward and reverse, zero-phase, non-causal bandpass filter:
- Windowed frequency-domain design (firwin2) method
- Hann window
- Lower passband edge: 8.00
- Lower transition bandwidth: 0.50 Hz (-12 dB cutoff frequency: 7.75 Hz)
- Upper passband edge: 16.00 Hz
- Upper transition bandwidth: 0.50 Hz (-12 dB cutoff frequency: 16.25 Hz)
- Filter length: 6007 samples (10.001 sec)

C:\ProgramData\Anaconda3\lib\site-packages\mkl_fft\_numpy_fft.py:331: FutureWarning: Using a non-tuple sequence for multidimensional indexing is deprecated; use `arr[tuple(seq)]` instead of `arr[seq]`. In the future this will be interpreted as an array index, `arr[np.array(seq)]`, which will result either in an error or a different result.
  output = mkl_fft.rfft_numpy(a, n=n, axis=axis)

 Using multitaper spectrum estimation with 7 DPSS windows
Not setting metadata
Not setting metadata
138 matching events found
No baseline correction applied
0 projection items activated
0 bad epochs dropped
C:\ProgramData\Anaconda3\lib\site-packages\mkl_fft\_numpy_fft.py:331: FutureWarning: Using a non-tuple sequence for multidimensional indexing is deprecated; use `arr[tuple(seq)]` instead of `arr[seq]`. In the future this will be interpreted as an array index, `arr[np.array(seq)]`, which will result either in an error or a different result.
  output = mkl_fft.rfft_numpy(a, n=n, axis=axis)
Not setting metadata
Not setting metadata
138 matching events found
No baseline correction applied
0 projection items activated
0 bad epochs dropped

Creating RawArray with float64 data, n_channels=31, n_times=166800
    Range : 25800 ... 192599 =     42.956 ...   320.670 secs
Ready.
代码:
#clean up memory before moving on
del raw, filt_raw, ica, new_ica
总结
今天用到的代码总结:
#通过模拟波段来选择ICA components
ica.exclude = []
# find which ICs match the ECG pattern
ecg_indices, ecg_scores = ica.find_bads_ecg(raw, method='correlation',
                                            threshold='auto')
ica.exclude = ecg_indices


# barplot of ICA component "ECG match" scores
ica.plot_scores(ecg_scores)


# plot diagnostics
ica.plot_properties(raw, picks=ecg_indices)


# plot ICs applied to raw data, with ECG matches highlighted
ica.plot_sources(raw, show_scrollbars=False)


# plot ICs applied to the averaged ECG epochs, with ECG matches highlighted
ica.plot_sources(ecg_evoked)


#通过观察ECG生成的这几张图,发现ICA014也有可能是心跳伪影。故尝试增加components,将ICA014分离出来
# refit the ICA with 30 components this time
new_ica = ICA(n_components=30, random_state=97)#这一次将components设置成30
new_ica.fit(filt_raw)


# find which ICs match the ECG pattern
ecg_indices, ecg_scores = new_ica.find_bads_ecg(raw, method='correlation',
                                                threshold='auto')
new_ica.exclude = ecg_indices


# barplot of ICA component "ECG match" scores
new_ica.plot_scores(ecg_scores)


# plot diagnostics
new_ica.plot_properties(raw, picks=ecg_indices)


# plot ICs applied to raw data, with ECG matches highlighted
new_ica.plot_sources(raw, show_scrollbars=False)


# plot ICs applied to the averaged ECG epochs, with ECG matches highlighted
new_ica.plot_sources(ecg_evoked)


#clean up memory before moving on
del raw, filt_raw, ica, new_ica