Prometheus的主要特点
Prometheus 属于一站式监控告警平台,依赖少,功能齐全。
Prometheus 支持对云的或容器的监控,其他系统主要对主机监控。
Prometheus 数据查询语句表现力更强大,内置更强大的统计函数。
Prometheus 在数据存储扩展性以及持久性上没有 InfluxDB,OpenTSDB,Sensu 好。
Prometheus的核心组件
Prometheus Server, 主要用于抓取数据和存储时序数据,另外还提供查询和 Alert Rule 配置管理。
client libraries,用于对接 Prometheus Server, 可以查询和上报数据。
push gateway ,用于批量,短期的监控数据的汇总节点,主要用于业务数据汇报等。
各种汇报数据的 exporters ,例如汇报机器数据的 node_exporter, 汇报 MongoDB 信息的 MongoDB exporter 等等。
用于告警通知管理的 alertmanager 。
Prometheus的架构图
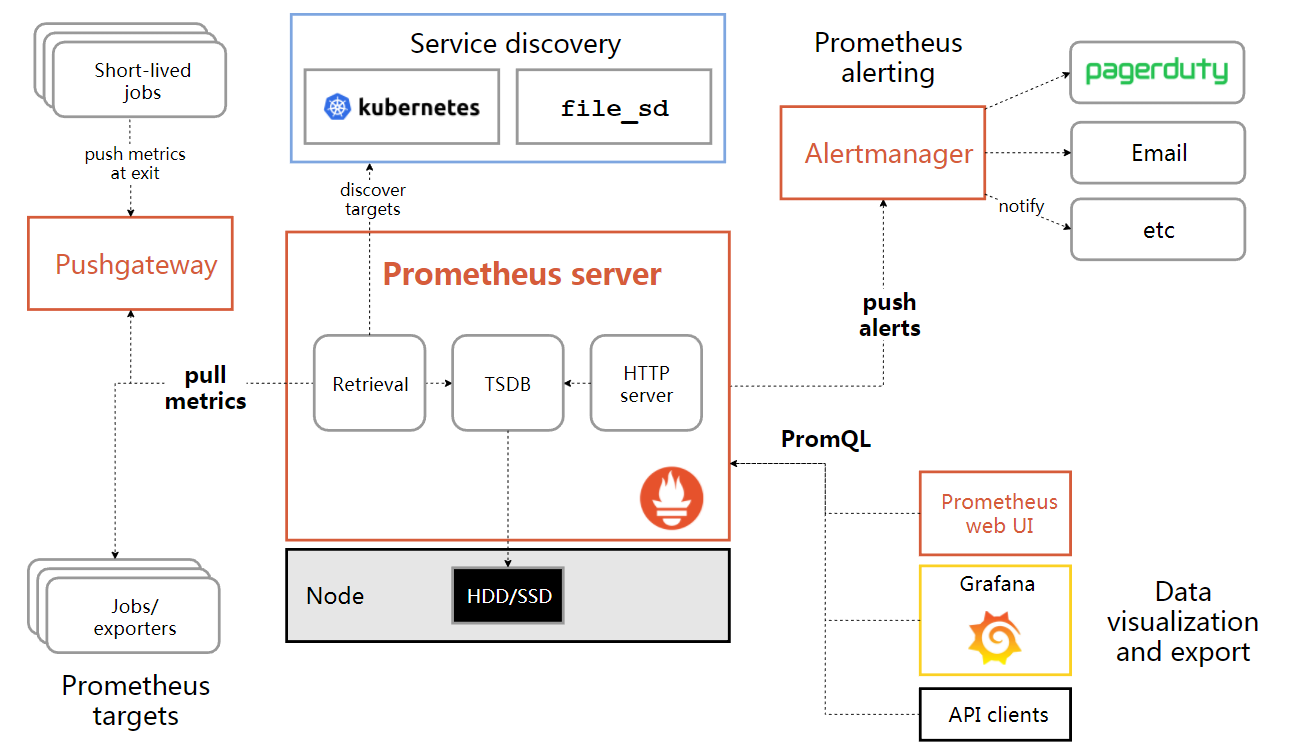
从这个架构图,也可以看出 Prometheus 的主要模块包含, Server, Exporters, Pushgateway, PromQL, Alertmanager, WebUI 等。
它大致使用逻辑是这样:
Prometheus server 定期从静态配置的 targets 或者服务发现的 targets 拉取数据。
当新拉取的数据大于配置内存缓存区的时候,Prometheus 会将数据持久化到磁盘(如果使用 remote storage 将持久化到云端)。
Prometheus 可以配置 rules,然后定时查询数据,当条件触发的时候,会将 alert 推送到配置的 Alertmanager。
Alertmanager 收到警告的时候,可以根据配置,聚合,去重,降噪,最后发送警告。
可以使用 API, Prometheus Console 或者 Grafana 查询和聚合数据。
Prometheus的安装
下载 prometheus-2.0.0.linux-amd64.tar.gz
http://download.csdn.net/download/fly910905/10130519
tar -zxvf prometheus-2.0.0.linux-amd64.tar.gz
cd prometheus-2.0.0.linux-amd64.tar.gz
./prometheus
Prometheus的配置
global:
scrape_interval: 15s # By default, scrape targets every 15 seconds.
evaluation_interval: 15s # By default, scrape targets every 15 seconds.
# scrape_timeout is set to the global default (10s).
# Attach these labels to any time series or alerts when communicating with
# external systems (federation, remote storage, Alertmanager).
external_labels:
monitor: 'codelab-monitor'
# Load rules once and periodically evaluate them according to the global 'evaluation_interval'.
rule_files:
# - "first.rules"
# - "second.rules"
# A scrape configuration containing exactly one endpoint to scrape:
# Here it's Prometheus itself.
scrape_configs:
# The job name is added as a label `job=<job_name>` to any timeseries scraped from this config.
- job_name: 'prometheus'
# Override the global default and scrape targets from this job every 5 seconds.
scrape_interval: 5s
# metrics_path defaults to '/metrics'
# scheme defaults to 'http'.
static_configs:
- targets: ['localhost:9090']
- job_name: 'mydemo'
# Override the global default and scrape targets from this job every 5 seconds.
scrape_interval: 5s
metrics_path: '/prometheus'
# scheme defaults to 'http'.
static_configs:
- targets: ['192.168.60.207:8088']
最关键的配置就是targets,就是web应用的ip和端口
Prometheus的启动
http://localhost:9090/targets
---------------------
作者:琦彦
来源:CSDN
原文:https://blog.csdn.net/fly910905/article/details/78618534
版权声明:本文为博主原创文章,转载请附上博文链接!