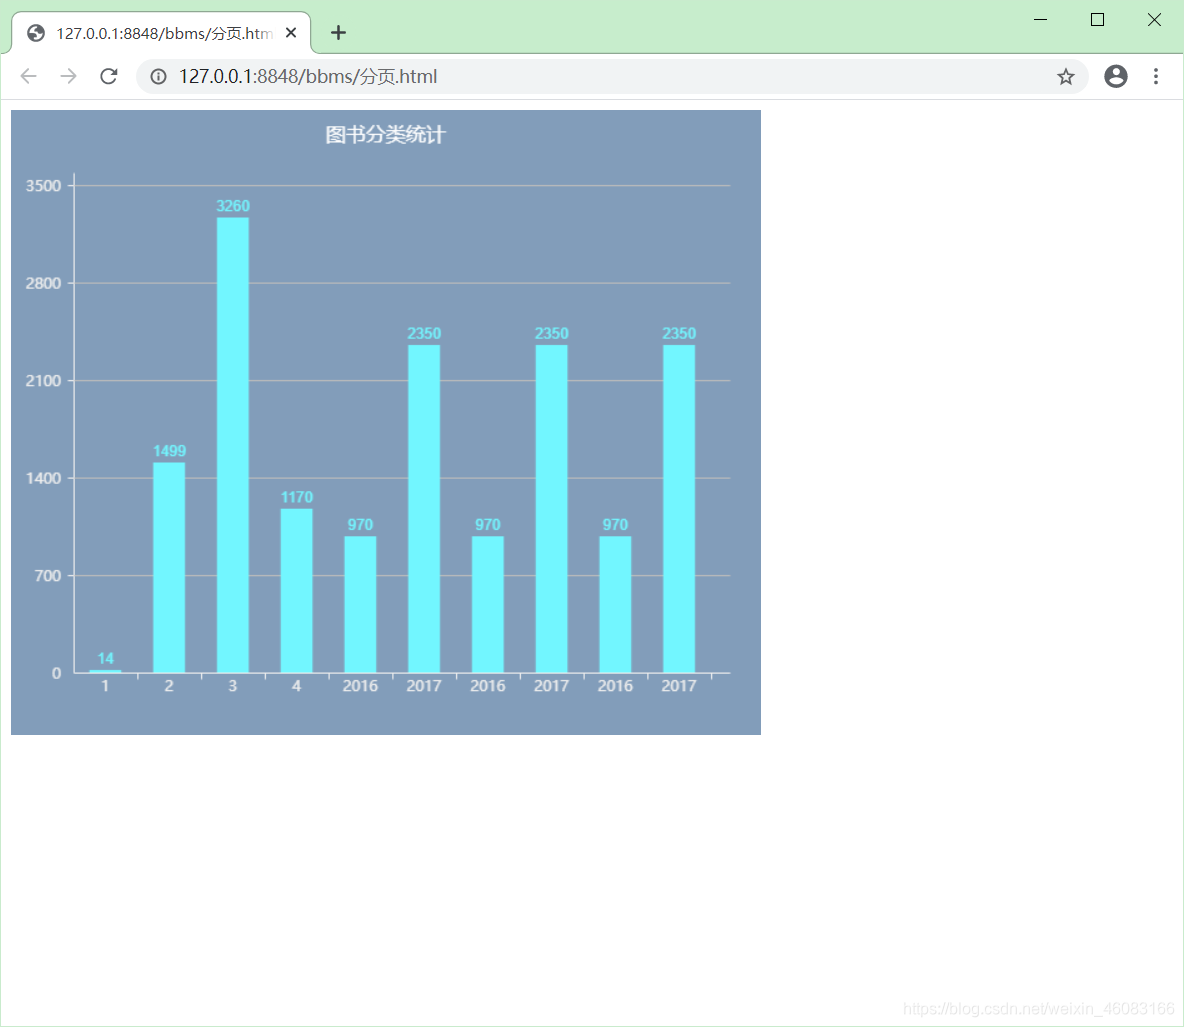
条形统计效果
<!DOCTYPE html>
<html>
	<head>
		<meta charset="utf-8">
		<title></title>

	</head>
	<body>
		<!-- 图书统计 -->
		<div class="row" id="hh">
			<div class="container">
				<canvas id="canvas" width="600" height="500"></canvas>
				<script src="js/sChart.js"></script>
				<script>
				    var data = [
				        {

    xAxis:'1',value:14}, //{xAxis:横轴名称,value:数值} 竖轴的数大小随各个的数值自动变化
				        {

    xAxis:'2',value:1499},
				        {

    xAxis:'3',value:3260},
				        {

    xAxis:'4',value:1170},
				        {

    xAxis:'2016',value:970},
				        {

    xAxis:'2017',value:2350},
						{

    xAxis:'2016',value:970},
						{

    xAxis:'2017',value:2350},
						{

    xAxis:'2016',value:970},
						{

    xAxis:'2017',value:2350}
				    ]
				    var chart = new sBarChart('canvas',data,{


				        title: '图书分类统计',
				        bgColor: '#829dba',
				        titleColor: '#ffffff',      // 标题颜色
				        titlePosition: 'top',       // 标题位置
				        fillColor: '#72f6ff',       // 柱状填充色
				        axisColor: '#eeeeee',       // 坐标轴颜色
				        contentColor: '#bbbbbb'     // 内容横线颜色
				    });
				</script>
			</div>
		</div>
	</body>
</html>
需要引入sChart.js
function sBarChart(canvas, data, options) {


    this.canvas = document.getElementById(canvas);
    this.ctx = this.canvas.getContext('2d');
    this.data = data;                           // 存放图表数据
    this.dataLength = this.data.length;         // 图表数据的长度
    this.width = this.canvas.width;             // canvas 宽度
    this.height = this.canvas.height;           // canvas 高度
    this.padding = 50;                          // canvas 内边距
    this.yEqual = 5;                            // y轴分成5等分
    this.yLength = 0;                           // y轴坐标点之间的真实长度
    this.xLength = 0;                           // x轴坐标点之间的真实长度
    this.yFictitious = 0;                       // y轴坐标点之间显示的间距
    this.yRatio = 0;                            // y轴坐标真实长度和坐标间距的比
    this.bgColor = '#ffffff';                   // 默认背景颜色
    this.fillColor = '#1E9FFF';                 // 默认填充颜色
    this.axisColor = '#666666';                 // 坐标轴颜色
    this.contentColor = '#eeeeee';              // 内容横线颜色
    this.titleColor = '#000000';                // 图表标题颜色
	this.title = '';                            // 图表标题
	this.titlePosition = 'top';                 // 图表标题位置: top / bottom
    this.looped = null;                         // 是否循环
    this.current = 0;                           // 当前加载柱状图高度的百分数
    this.currentIndex = -1;
    this.onceMove = -1;
    this.init(options);
}
sBarChart.prototype = {


    init: function(options) {


        if(options){


            this.padding = options.padding || 50;
            this.yEqual = options.yEqual || 5;
            this.bgColor = options.bgColor || '#ffffff';
            this.fillColor = options.fillColor || '#1E9FFF';
            this.axisColor = options.axisColor || '#666666';
            this.contentColor = options.contentColor || '#eeeeee';
            this.titleColor = options.titleColor || '#000000';
            this.title = options.title;
            this.titlePosition = options.titlePosition || 'top';
        }
        this.yLength = Math.floor((this.height - this.padding * 2 - 10) / this.yEqual);
        this.xLength = Math.floor((this.width - this.padding * 1.5 - 10) / this.dataLength);
        this.yFictitious = this.getYFictitious(this.data);
        this.yRatio = this.yLength / this.yFictitious;
        this.looping();
    },
    looping: function() {


        this.looped = requestAnimationFrame(this.looping.bind(this));
        if(this.current < 100){


			this.current = (this.current + 3) > 100 ? 100 : (this.current + 3);
            this.drawAnimation();
        }else{


            window.cancelAnimationFrame(this.looped);
            this.looped = null;
            this.watchHover();
        }
    },
    drawAnimation: function() {


        for(var i = 0; i < this.dataLength; i++) {


            var x = Math.ceil(this.data[i].value * this.current / 100 * this.yRatio);
            var y = this.height - this.padding - x;

            this.data[i].left = this.padding + this.xLength * (i + 0.25);
            this.data[i].top = y;
            this.data[i].right = this.padding + this.xLength * (i + 0.75);
            this.data[i].bottom = this.height - this.padding;
            this.drawUpdate();
        }
    },
    drawUpdate: function() {


        this.ctx.fillStyle = this.bgColor;
        this.ctx.fillRect(0, 0, this.width, this.height);
        this.drawAxis();
        this.drawPoint();
        this.drawTitle();
        this.drawChart();
    },
    drawChart: function() {


        this.ctx.fillStyle = this.fillColor;
        for(var i = 0; i < this.dataLength; i++) {


            this.ctx.fillRect(
                this.data[i].left,
                this.data[i].top,
                this.data[i].right - this.data[i].left,
                this.data[i].bottom - this.data[i].top
            );
            this.ctx.font = '12px Arial'
            this.ctx.fillText(
                this.data[i].value * this.current / 100,
                this.data[i].left + this.xLength / 4,
                this.data[i].top - 5
            );
        }
    },
    drawAxis: function() {


        this.ctx.beginPath();
        this.ctx.strokeStyle = this.axisColor;
        // y轴线, +0.5是为了解决canvas画1像素会显示成2像素的问题
		this.ctx.moveTo(this.padding + 0.5, this.height - this.padding + 0.5);
		this.ctx.lineTo(this.padding + 0.5, this.padding + 0.5);
		// x轴线
		this.ctx.moveTo(this.padding + 0.5, this.height - this.padding + 0.5);
		this.ctx.lineTo(this.width - this.padding / 2 + 0.5, this.height - this.padding + 0.5);
		this.ctx.stroke();
    },
    drawPoint: function() {


        // x轴坐标点
        this.ctx.beginPath();
        this.ctx.font = '12px Microsoft YaHei';
        this.ctx.textAlign = 'center';
        this.ctx.fillStyle = this.axisColor;
        for(var i = 0; i < this.dataLength; i ++){


			var xAxis = this.data[i].xAxis;
			var xlen = this.xLength * (i + 1);
			this.ctx.moveTo(this.padding + xlen + 0.5, this.height - this.padding + 0.5);
			this.ctx.lineTo(this.padding + xlen + 0.5, this.height - this.padding + 5.5);
			this.ctx.fillText(xAxis, this.padding + xlen - this.xLength / 2, this.height - this.padding + 15);
		}
        this.ctx.stroke();

        // y轴坐标点
        this.ctx.beginPath();
        this.ctx.font = '12px Microsoft YaHei';
        this.ctx.textAlign = 'right';
        this.ctx.fillStyle = this.axisColor;
        this.ctx.moveTo(this.padding + 0.5, this.height - this.padding + 0.5);
        this.ctx.lineTo(this.padding - 4.5, this.height - this.padding + 0.5);
        this.ctx.fillText(0, this.padding - 10, this.height - this.padding + 5);
        for(var i=0; i < this.yEqual; i ++){


			var y = this.yFictitious * (i + 1);
			var ylen = this.yLength * (i + 1);
            this.ctx.beginPath();
            this.ctx.strokeStyle = this.axisColor;
			this.ctx.moveTo(this.padding + 0.5, this.height - this.padding - ylen + 0.5);
			this.ctx.lineTo(this.padding - 4.5, this.height - this.padding - ylen + 0.5);
			this.ctx.stroke();
			this.ctx.fillText(y,this.padding - 10, this.height - this.padding - ylen + 5);
            this.ctx.beginPath();
			this.ctx.strokeStyle = this.contentColor;
			this.ctx.moveTo(this.padding + 0.5, this.height - this.padding - ylen + 0.5)
			this.ctx.lineTo(this.width - this.padding / 2 + 0.5, this.height - this.padding - ylen+0.5);
            this.ctx.stroke();
		}
    },
    drawTitle: function() {


        if(this.title){


            this.ctx.beginPath();
			this.ctx.textAlign = 'center';
			this.ctx.fillStyle = this.titleColor;
			this.ctx.font = '16px Microsoft YaHei';
			if(this.titlePosition === 'bottom' && this.padding >= 40){


				this.ctx.fillText(this.title, this.width / 2, this.height - 5)
			}else{


				this.ctx.fillText(this.title, this.width / 2, this.padding / 2)
			}
		}
    },
    /**
     * 监听鼠标移动事件
     */
    watchHover: function() {


        var self = this;
        self.canvas.addEventListener('mousemove', function(ev) {


			ev = ev || window.event;
            self.currentIndex = -1;
			for (var i = 0; i < self.data.length; i ++){


				if( ev.offsetX > self.data[i].left &&
                    ev.offsetX < self.data[i].right &&
                    ev.offsetY > self.data[i].top &&
                    ev.offsetY < self.data[i].bottom )
                {


					self.currentIndex = i;
				}
			}
            self.drawHover();
		})
    },
    drawHover: function() {


        if(this.currentIndex !== -1){


            if(this.onceMove === -1){


                this.onceMove = this.currentIndex;
                this.canvas.style.cursor = 'pointer';
            }
        }else{


            if(this.onceMove !== -1){


                this.onceMove = -1;
                this.canvas.style.cursor = 'inherit';
            }
        }
    },
    /**
     * y轴坐标点之间显示的间距
     * @param data
     * @return y轴坐标间距
     */
    getYFictitious: function(data) {


        var arr = data.slice(0);
        arr.sort(function(a,b){


            return -(a.value-b.value);
        });
        var len = Math.ceil(arr[0].value / this.yEqual);
        var pow = len.toString().length - 1;
        pow = pow > 2 ? 2 : pow;
        return Math.ceil(len / Math.pow(10,pow)) * Math.pow(10,pow);
    }
}