#coding:utf-8
import matplotlib as mpl
import matplotlib.pyplot as plt
import pandas as pd
#-*- 原始数据 -*-
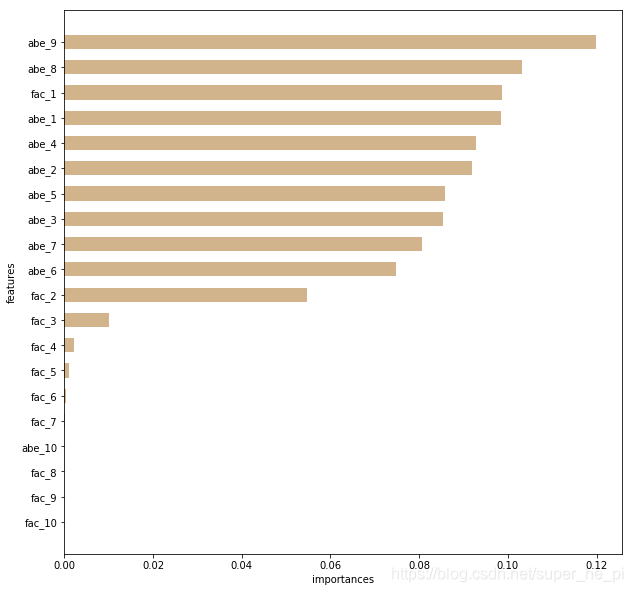
Feature_importances = [0.09874236361414918, 0.05457733080394871, 0.010137636755458375, 0.002168849354716167,
0.001013334072272919, 0.0004140993059956171, 8.349594684160916e-05, 3.20916475647705e-05,
1.013794641507518e-06, 0.0, 0.09850544433863488, 0.09200726418964804, 0.08526823770386598,
0.0929247547648456, 0.08577678907643776, 0.07479688092774066, 0.08069145257465207,
0.10305018928137757, 0.11980877184720869, 0.0]
fea_label = ['fac_1','fac_2','fac_3','fac_4','fac_5','fac_6','fac_7','fac_8','fac_9','fac_10',
'abe_1','abe_2','abe_3','abe_4','abe_5','abe_6','abe_7','abe_8','abe_9','abe_10']
Feature_importances = [round(x,4) for x in Feature_importances]
F2 = pd.Series(Feature_importances,index = fea_label)
F2 = F2.sort_values(ascending = True)
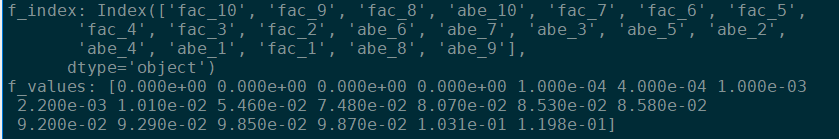
f_index = F2.index
f_values = F2.values
# -*-输出 -*- #
print ('f_index:',f_index)
print ('f_values:',f_values)
#####################################
x_index = list(range(0,20))
x_index = [x/20 for x in x_index]
plt.rcParams['figure.figsize'] = (10,10)
plt.barh(x_index,f_values,height = 0.028 ,align="center",color = 'tan',tick_label=f_index)
plt.xlabel('importances')
plt.ylabel('features')
plt.show()# -*- 输出index 与 importances
#绘图部分: