prometheus监控使用(按照文档步骤就可以操作成功)。
文档分别坐了使用k8s集群部署docker 跑prometheus监控。(后期如果有时间会做一个监控pod的文档)
监控K8s细节文章链接
https://blog.csdn.net/zeorg/article/details/112164465
特别说明:此环境要提前部署好k8s。
1、prometheus 作为监控k8s的最佳选择在这里做一个在k8s部署prometheus文档供大家参考。
#私自转载请联系博主否则必定追究版权 下方有微信
系统环境:
| IP | 节点名称(不是主机名) |
|---|---|
| 192.168.182.150 | k8s-master |
| 192.168.182.151 | k8s-node2 |
| 192.168.182.152 | k8s-node2 |
| 192.168.182.153 | docker仓库 |
1、在docker仓库里面先拉取prometheus images(直接使用k8s拉取因为网络问题可以说基本是失败的)。
docker仓库执行
docker pull prom/prometheus:v2.2.1
docker   tag   prom/prometheus:v2.2.1  192.168.182.153:5000/prom/prometheus:v2.2.1
###为prometheus:v2.2.1 images 打一个标签
docker   push  192.168.182.153:5000/prom/prometheus:v2.2.1
##上传打包后的prometheus:v2.2.1镜像
2、使用k8s创建prometheus 容器配置。
k8s-master执行
创建文件prometheus-config.yml(如果是实验环境目录无所谓)
apiVersion: v1
kind: ConfigMap
metadata:
  name: prometheus-config
data:
  prometheus.yml: |
    global:
      scrape_interval:     15s
      evaluation_interval: 15s
    scrape_configs:
      - job_name: 'prometheus'
        static_configs:
        - targets: ['localhost:9090']
创建文件prometheus-deployment.yml(如果是实验环境目录无所谓)
apiVersion: v1
kind: "Service"
metadata:
  name: prometheus
  labels:
    name: prometheus
spec:
  ports:
  - name: prometheus
    protocol: TCP
    port: 9090
    targetPort: 9090
  selector:
    app: prometheus
  type: NodePort
---
apiVersion: extensions/v1beta1
kind: Deployment
metadata:
  labels:
    name: prometheus
  name: prometheus
spec:
  replicas: 1
  template:
    metadata:
      labels:
        app: prometheus
    spec:
      containers:
      - name: prometheus
        image: prom/prometheus:v2.2.1
        command:
        - "/bin/prometheus"
        args:
        - "--config.file=/etc/prometheus/prometheus.yml"
        ports:
        - containerPort: 9090
          protocol: TCP
        volumeMounts:
        - mountPath: "/etc/prometheus"
          name: prometheus-config
      volumes:
      - name: prometheus-config
        configMap:
          name: prometheus-config
3、使用k8s下发任务。
k8s-master执行
kubectl create -f prometheus-config.yml
kubeckubectl create -f prometheus-deployment.yml
4、查看任务进度。
k8s-master执行
[root@master prometheus]# kubectl get pods    ##如果下方创建失败可以根据NAME名称查看日志
NAME                          READY     STATUS    RESTARTS   AGE
nginx-3121059884-lx6qc        1/1       Running   0          1h
nginx-3121059884-n6bdl        1/1       Running   0          1h
nginx-3121059884-n9pxz        1/1       Running   1          4h
prometheus-3596598276-5wrkl   1/1       Running   0          1h
5、查看失败日志(我上面是成功后的所以状态是Running)大家可以看我的报错有多次镜像拉取失败。
k8s-master执行
 kubectl describe pod prometheus-3596598276-5wrkl
Name:           prometheus-3596598276-5wrkl
Namespace:      default
Node:           node-1/192.168.182.151
Start Time:     Fri, 01 Jan 2021 21:39:02 +0800
Labels:         app=prometheus
                pod-template-hash=3596598276
Status:         Running
IP:             10.10.17.5
Controllers:    ReplicaSet/prometheus-3596598276
Containers:
  prometheus:
    Container ID:       docker://d2887dbb516b7415f0ddf1ee1c8fbf0b389db935e361c6108c44a9b52bb6ef29
    Image:              prom/prometheus:v2.2.1
    Image ID:           docker-pullable://192.168.182.153:5000/prom/prometheus@sha256:b0912ab008c270be88f6e81d3df6dfd24b7c1f9b4aacbffa70abe2a382152223
    Port:               9090/TCP
    Command:
      /bin/prometheus
    Args:
      --config.file=/etc/prometheus/prometheus.yml
    State:              Running
      Started:          Fri, 01 Jan 2021 22:24:25 +0800
    Ready:              True
    Restart Count:      0
    Volume Mounts:
      /etc/prometheus from prometheus-config (rw)
    Environment Variables:      <none>
Conditions:
  Type          Status
  Initialized   True
  Ready         True
  PodScheduled  True
Volumes:
  prometheus-config:
    Type:       ConfigMap (a volume populated by a ConfigMap)
    Name:       prometheus-config
QoS Class:      BestEffort
Tolerations:    <none>
Events:
  FirstSeen     LastSeen        Count   From                    SubObjectPath                   Type            Reason                  Message
  ---------     --------        -----   ----                    -------------                   --------        ------                  -------
  1h            58m             9       {

    default-scheduler }                                    Warning         FailedScheduling        no nodes available to schedule pods
  57m           57m             6       {

    default-scheduler }                                    Warning         FailedScheduling        no nodes available to schedule pods
  56m           56m             1       {

    default-scheduler }                                    Normal          Scheduled               Successfully assigned prometheus-3596598276-5wrkl to node-1
  56m           44m             14      {

    kubelet node-1}                                        Warning         FailedMount             MountVolume.SetUp failed for volume "kubernetes.io/configmap/0a83b05e-4c34-11eb-ae3b-000c29fd225f-prometheus-config" (spec.Name: "prometheus-config") pod "0a83b05e-4c34-11eb-ae3b-000c29fd225f" (UID: "0a83b05e-4c34-11eb-ae3b-000c29fd225f") with: configmaps "prometheus-config" not found
  54m           43m             6       {

    kubelet node-1}                                        Warning         FailedMount             Unable to mount volumes for pod "prometheus-3596598276-5wrkl_default(0a83b05e-4c34-11eb-ae3b-000c29fd225f)": timeout expired waiting for volumes to attach/mount for pod "default"/"prometheus-3596598276-5wrkl". list of unattached/unmounted volumes=[prometheus-config]
  54m           43m             6       {

    kubelet node-1}                                        Warning         FailedSync              Error syncing pod, skipping: timeout expired waiting for volumes to attach/mount for pod "default"/"prometheus-3596598276-5wrkl". list of unattached/unmounted volumes=[prometheus-config]
  32m           32m             1       {

    kubelet node-1}        spec.containers{

    prometheus}     Normal          BackOff                 Back-off pulling image "prom/prometheus:v2.2.1"
  32m           32m             1       {

    kubelet node-1}                                        Warning         FailedSync              Error syncing pod, skipping: failed to "StartContainer" for "prometheus" with ImagePullBackOff: "Back-off pulling image \"prom/prometheus:v2.2.1\""

  32m   14m     2       {

    kubelet node-1}        spec.containers{

    prometheus}     Warning Failed          Failed to pull image "prom/prometheus:v2.2.1": net/http: request canceled
  32m   14m     2       {

    kubelet node-1}                                        Warning FailedSync      Error syncing pod, skipping: failed to "StartContainer" for "prometheus" with ErrImagePull: "net/http: request canceled"

  42m   14m     3       {

    kubelet node-1}        spec.containers{

    prometheus}     Normal  Pulling                 pulling image "prom/prometheus:v2.2.1"
  11m   11m     1       {

    kubelet node-1}        spec.containers{

    prometheus}     Normal  Pulled                  Successfully pulled image "prom/prometheus:v2.2.1"
  42m   11m     2       {

    kubelet node-1}                                        Warning MissingClusterDNS       kubelet does not have ClusterDNS IP configured and cannot create Pod using "ClusterFirst" policy. Falling back to DNSDefault policy.
  11m   11m     1       {

    kubelet node-1}        spec.containers{

    prometheus}     Normal  Created                 Created container with docker id d2887dbb516b; Security:[seccomp=unconfined]
  11m   11m     1       {

    kubelet node-1}        spec.containers{

    prometheus}     Normal  Started                 Started container with docker id d2887dbb516b
6、查看容器随机分配端口。
k8s-master执行
[root@master prometheus]# kubectl get all
NAME DESIRED CURRENT UP-TO-DATE AVAILABLE AGE
deploy/nginx 3 3 3 3 4h
deploy/prometheus 1 1 1 1 1h
NAME CLUSTER-IP EXTERNAL-IP PORT(S) AGE
svc/kubernetes 10.10.0.1 <none> 443/TCP 4h
svc/nginx 10.10.214.157 <nodes> 80:31882/TCP 4h
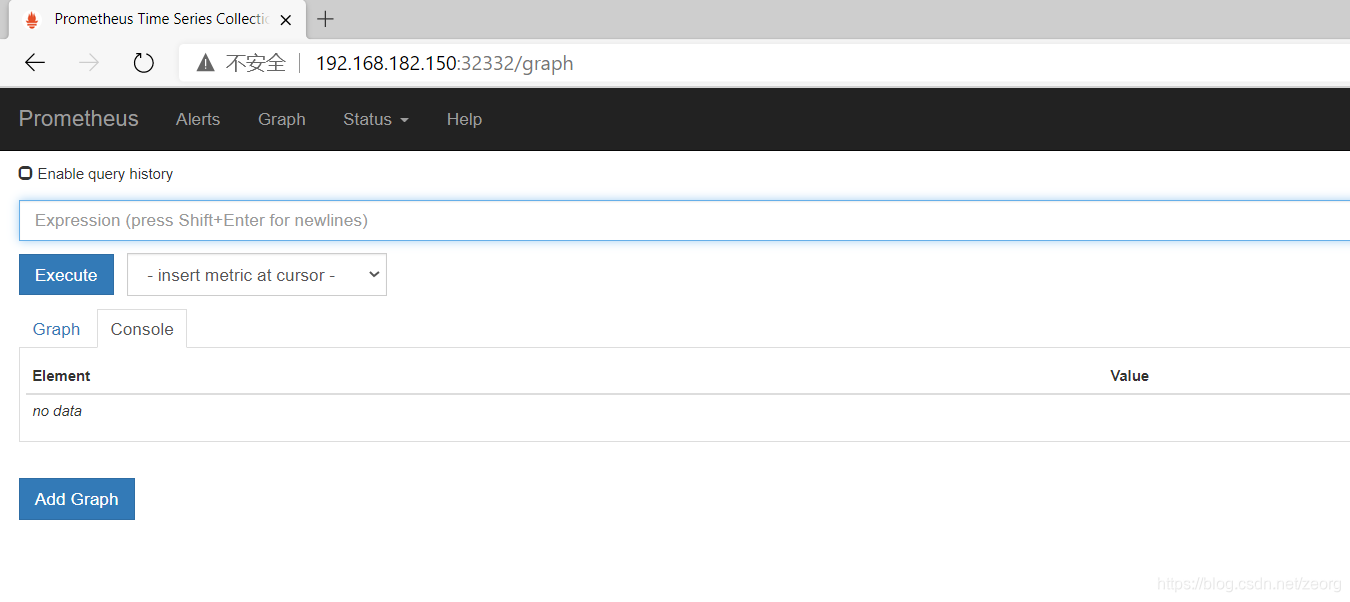
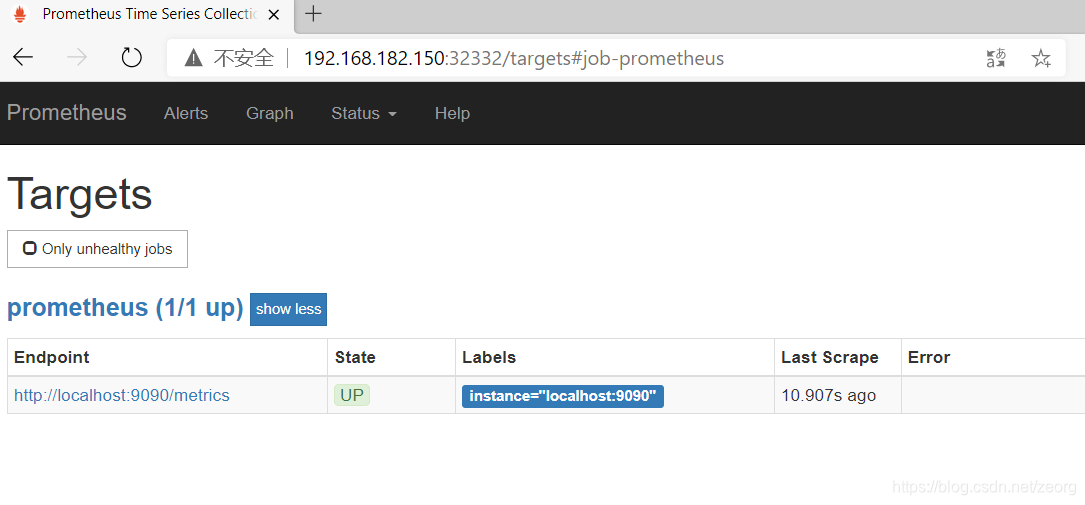
svc/prometheus 10.10.165.138 <nodes> 9090:32332/TCP 1h
6、在web浏览器打开。