基本架构
Prometheus由SoundCloud发布,是一套由go语言开发的开源的监控&报警&时间序列数据库的组合。
Prometheus的基本原理是通过HTTP协议周期性抓取被监控组件的状态,任意组件只要提供对应的HTTP接口就可以接入监控。不需要任何SDK或者其他的集成过程。这样做非常适合做虚拟化环境监控系统,比如VM、Docker、Kubernetes等。
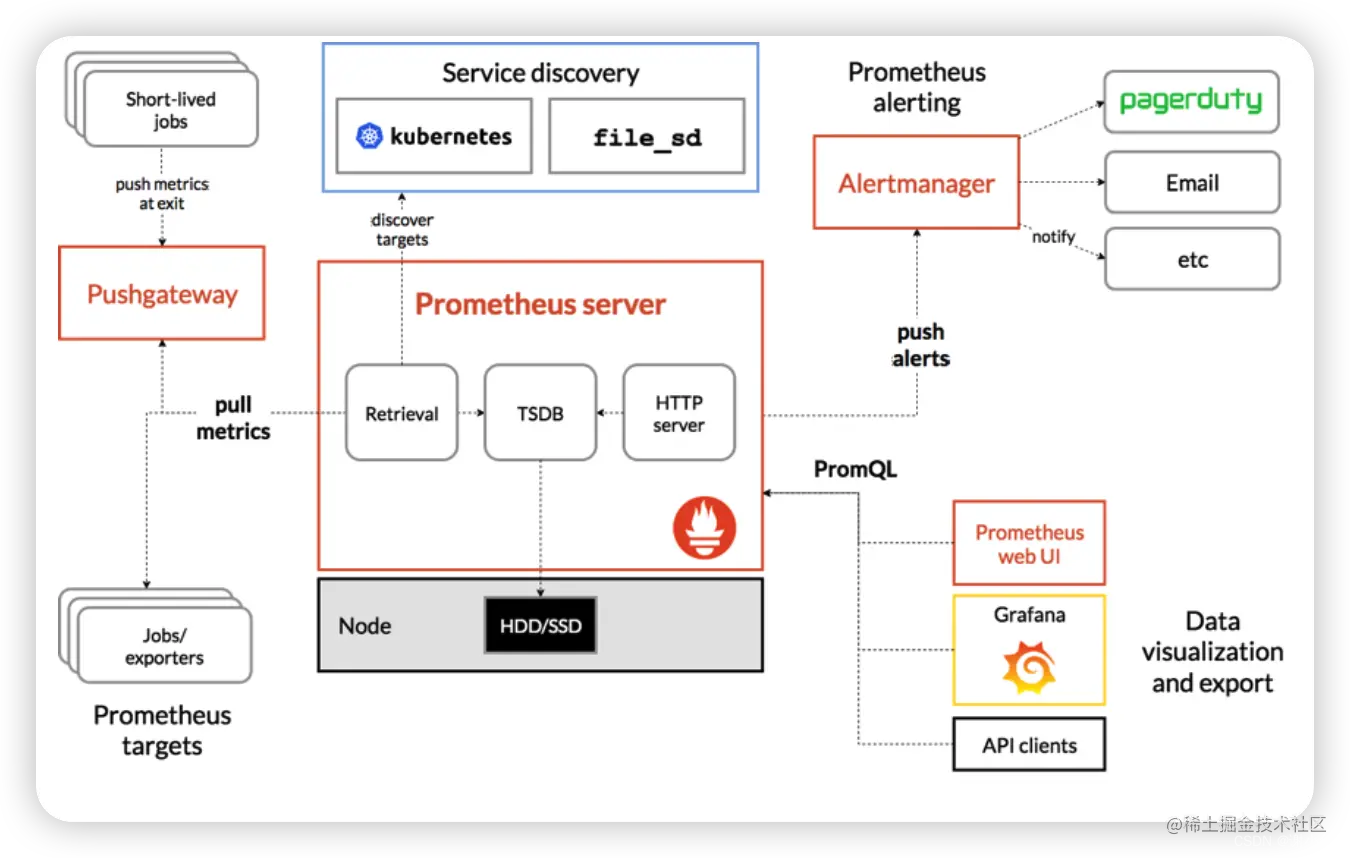
Prometheus 主要的组件功能如下:
- Prometheus Server:server的作用主要是定期从静态配置的targets或者服务发现(主要是DNS、consul、k8s、mesos等)的 targets 拉取数据。
- Exporter: 主要负责向prometheus server做数据汇报。而不同的数据汇报由不同的exporters实现,比如监控主机有node-exporters,mysql有MySQL server exporter。
- Pushgateway:Prometheus获得数据的方式除了到对应exporter去Pull,还可以由服务先Push到pushgateway,server再去pushgateway 拉取。
- Alertmanager:实现prometheus的告警功能。
- webui:主要通过grafana来实现webui展示。
我们在实际使用的时候的基本流程就是:
各个服务push监控数据到其对应的指标(比如下面提到的Exporter) --> Prometheus Server定时采集数据并存储 --> 配置Grafana展示数据 & 配置告警规则进行告警
Helm部署Prometheus平台
使用helm部署kube-prometheus-stack
helm地址:传送门
github地址:传送门
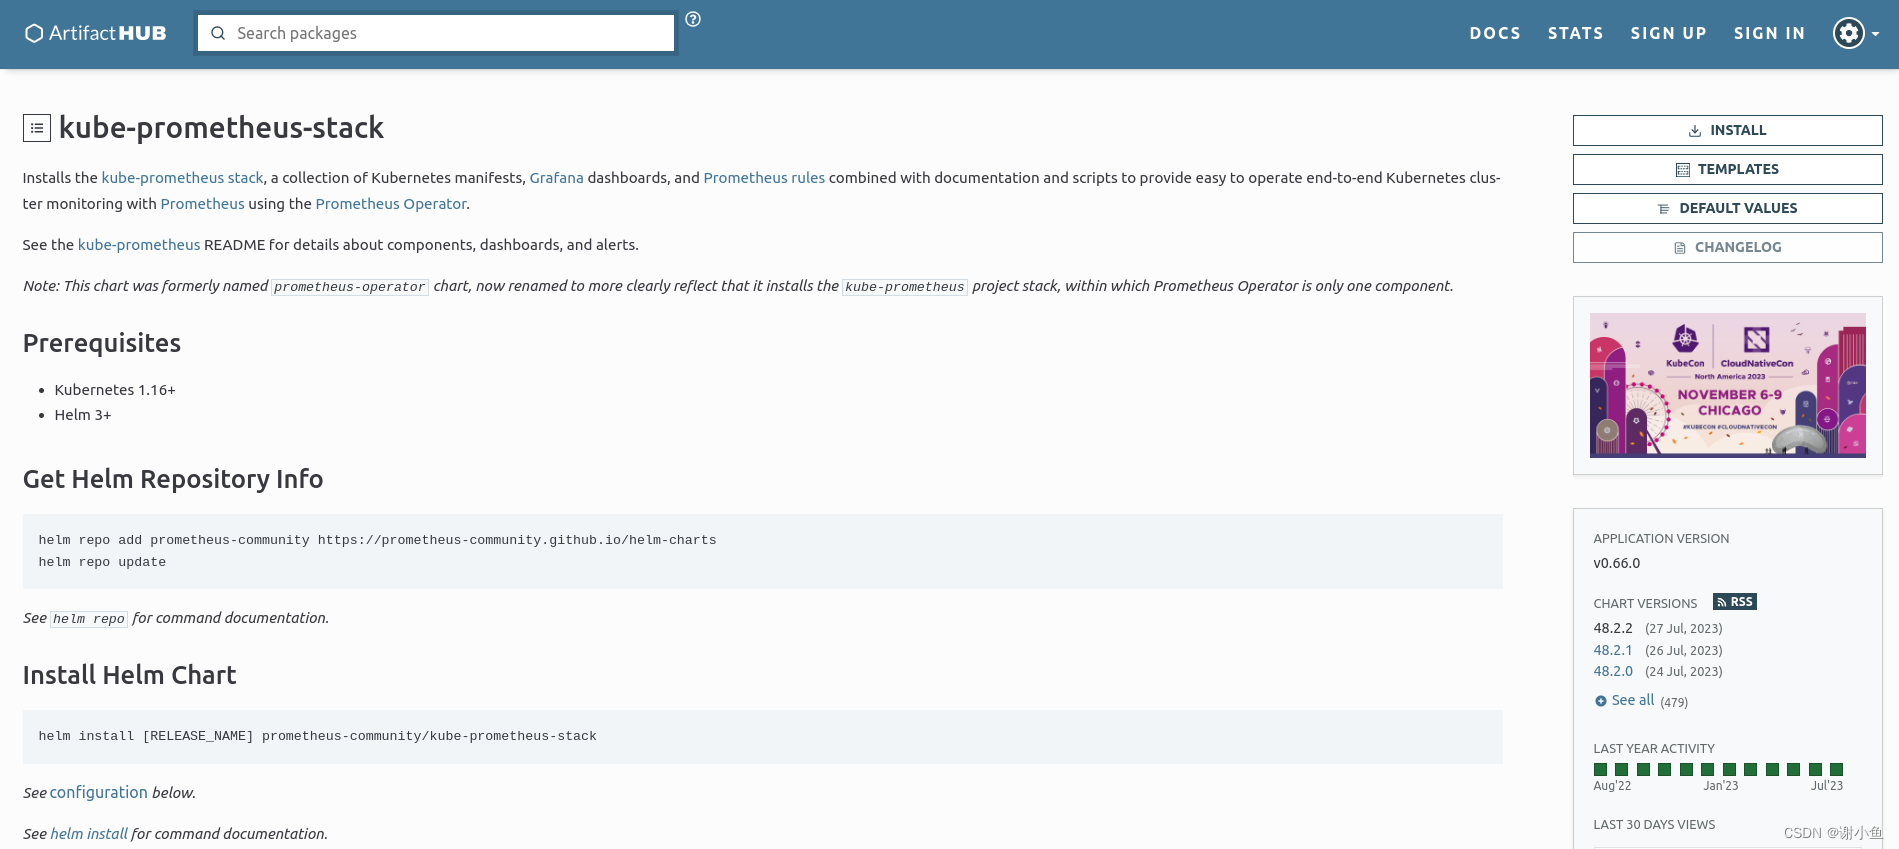
首先需要在服务器上安装helm工具,怎么安装不再赘述,网上很多教程。使用helm安装prometheus的具体操作为:
helm repo add prometheus-community https://prometheus-community.github.io/helm-charts
helm repo update
helm install [RELEASE_NAME] prometheus-community/kube-prometheus-stack
Exporter
要采集目标的监控数据,首先就要在被采集目标地方安装采集组件,这种采集组件被称为Exporter。prometheus.io官网上有很多这种exporter,官方exporter列表。
采集完了怎么传输到Prometheus?
Exporter 会暴露一个HTTP接口,prometheus通过Pull模式的方式来拉取数据,会通过HTTP协议周期性抓取被监控的组件数据。
不过prometheus也提供了一种方式来支持Push模式,你可以将数据推送到Push Gateway,prometheus通过pull的方式从Push Gateway获取数据。
golang应用中接入采集组件
kratos框架
在微服务框架kratos中接入Prometheus采集组件的示例,kratos官方教程:
package main

import (
	"context"
	"fmt"
	"log"

	prom "github.com/go-kratos/kratos/contrib/metrics/prometheus/v2"
	"github.com/go-kratos/kratos/v2/middleware/metrics"
	"github.com/prometheus/client_golang/prometheus/promhttp"

	"github.com/go-kratos/examples/helloworld/helloworld"
	"github.com/go-kratos/kratos/v2"
	"github.com/go-kratos/kratos/v2/transport/grpc"
	"github.com/go-kratos/kratos/v2/transport/http"
	"github.com/prometheus/client_golang/prometheus"
)

// go build -ldflags "-X main.Version=x.y.z"
var (
	// Name is the name of the compiled software.
	Name = "metrics"
	// Version is the version of the compiled software.
	// Version = "v1.0.0"

	_metricSeconds = prometheus.NewHistogramVec(prometheus.HistogramOpts{


		Namespace: "server",
		Subsystem: "requests",
		Name:      "duration_sec",
		Help:      "server requests duration(sec).",
		Buckets:   []float64{

    0.005, 0.01, 0.025, 0.05, 0.1, 0.250, 0.5, 1},
	}, []string{

    "kind", "operation"})

	_metricRequests = prometheus.NewCounterVec(prometheus.CounterOpts{


		Namespace: "client",
		Subsystem: "requests",
		Name:      "code_total",
		Help:      "The total number of processed requests",
	}, []string{

    "kind", "operation", "code", "reason"})
)

// server is used to implement helloworld.GreeterServer.
type server struct {


	helloworld.UnimplementedGreeterServer
}

// SayHello implements helloworld.GreeterServer
func (s *server) SayHello(ctx context.Context, in *helloworld.HelloRequest) (*helloworld.HelloReply, error) {


	return &helloworld.HelloReply{

    Message: fmt.Sprintf("Hello %+v", in.Name)}, nil
}

func init() {


	prometheus.MustRegister(_metricSeconds, _metricRequests)
}

func main() {


	grpcSrv := grpc.NewServer(
		grpc.Address(":9000"),
		grpc.Middleware(
			metrics.Server(
				metrics.WithSeconds(prom.NewHistogram(_metricSeconds)),
				metrics.WithRequests(prom.NewCounter(_metricRequests)),
			),
		),
	)
	httpSrv := http.NewServer(
		http.Address(":8000"),
		http.Middleware(
			metrics.Server(
				metrics.WithSeconds(prom.NewHistogram(_metricSeconds)),
				metrics.WithRequests(prom.NewCounter(_metricRequests)),
			),
		),
	)
	httpSrv.Handle("/metrics", promhttp.Handler())

	s := &server{

    }
	helloworld.RegisterGreeterServer(grpcSrv, s)
	helloworld.RegisterGreeterHTTPServer(httpSrv, s)

	app := kratos.New(
		kratos.Name(Name),
		kratos.Server(
			httpSrv,
			grpcSrv,
		),
	)

	if err := app.Run(); err != nil {


		log.Fatal(err)
	}
}
最终暴露出一个http://127.0.0.1:8000/metricsHTTP接口出来,Prometheus可以通过这个接口拉取监控数据。
Gin框架
在轻量级HTTP框架Gin中接入Prometheus采集组件的示例:
package main

import (
	"strconv"
	"time"

	"github.com/gin-gonic/gin"
	"github.com/prometheus/client_golang/prometheus"
	"github.com/prometheus/client_golang/prometheus/promhttp"
)

var (
	handler = promhttp.Handler()

	_metricSeconds = prometheus.NewHistogramVec(prometheus.HistogramOpts{


		Namespace: "server",
		Subsystem: "requests",
		Name:      "duration_sec",
		Help:      "server requests duration(sec).",
		Buckets:   []float64{

    0.005, 0.01, 0.025, 0.05, 0.1, 0.250, 0.5, 1},
	}, []string{

    "method", "path"})
	_metricRequests = prometheus.NewCounterVec(prometheus.CounterOpts{


		Namespace: "client",
		Subsystem: "requests",
		Name:      "code_total",
		Help:      "The total number of processed requests",
	}, []string{

    "method", "path", "code"})
)

func init() {


	prometheus.MustRegister(_metricSeconds, _metricRequests)
}

func HandlerMetrics() func(c *gin.Context) {


	return func(c *gin.Context) {


		handler.ServeHTTP(c.Writer, c.Request)
	}
}

func WithProm() gin.HandlerFunc {


	return func(c *gin.Context) {


		var (
			method string
			path   string
			code   int
		)
		startTime := time.Now()

		method = c.Request.Method
		path = c.Request.URL.Path

		c.Next()

		code = c.Writer.Status()

		_metricSeconds.WithLabelValues(method, path).Observe(time.Since(startTime).Seconds())
		_metricRequests.WithLabelValues(method, path, strconv.Itoa(code)).Inc()
	}
}

func main() {


	r := gin.Default()
	r.Use(WithProm())
	r.GET("/ping", func(c *gin.Context) {


		c.JSON(200, gin.H{


			"message": "pong",
		})
	})
	r.GET("/metrics", HandlerMetrics())
	r.Run() // 监听并在 0.0.0.0:8080 上启动服务
}
最终暴露出一个http://127.0.0.1:8080/metricsHTTP接口出来,Prometheus可以通过这个接口拉取监控数据。
抓取集群外部数据源
背景:在已有的K8s集群中通过
helm部署了一个kube-prometheus-stack,用于监控服务器和服务。现在已经将k8s集群中的node、pod等组件接入到prometheus了。还需要将部署在k8s集群外部的其他应用服务接入到prometheus。
prometheus抓取k8s集群外部的数据时,有以下途径:
- ServiceMonitor
- Additional Scrape Configuration
ServiceMonitor
ServiceMonitor 是一个CRD,它定义了 Prometheus 应该抓取的服务端点以及抓取的时间间隔。
通过ServiceMonitor监控集群外部的服务,需要配置Service、Endpoints和ServiceMonitor。
现在有一个已经部署到192.168.1.100:8000的后端服务,已经通过/metrics将监控指标暴露出来了。尝试将其接入到prometheus,具体操作如下:
在命令行中输入
$ touch external-application.yaml

$ vim external-application.yaml
然后将下面的yaml文件内容拷贝进去
---
apiVersion: v1
kind: Service
metadata:
  name: external-application-exporter
  namespace: monitoring
  labels:
    app: external-application-exporter
    app.kubernetes.io/name: application-exporter
spec:
  type: ClusterIP
  ports:
  - name: metrics
    port: 9101
    protocol: TCP
    targetPort: 9101
---
apiVersion: v1
kind: Endpoints
metadata:
    name: external-application-exporter
    namespace: monitoring
    labels:
      app: external-application-exporter
      app.kubernetes.io/name: application-exporter
subsets:
- addresses:
  - ip: 192.168.1.100  # 这里是外部的资源列表
  ports:
  - name: metrics
    port: 8000
- addresses:
  - ip: 192.168.1.100  # 这里是外部的资源列表2
  ports:
  - name: metrics
    port: 8080
---
apiVersion: monitoring.coreos.com/v1
kind: ServiceMonitor
metadata:
  name: external-application-exporter
  namespace: monitoring
  labels:
    app: external-application-exporter
    release: prometheus
spec:
  selector:
    matchLabels:            # Service选择器
      app: external-application-exporter
  namespaceSelector:        # Namespace选择器
    matchNames:
    - monitoring
  endpoints:
  - port: metrics           # 采集节点端口(svc定义)
    interval: 10s           # 采集频率根据实际需求配置,prometheus默认10s
    path: /metrics          # 默认地址/metrics
保存好文件之后运行命令:
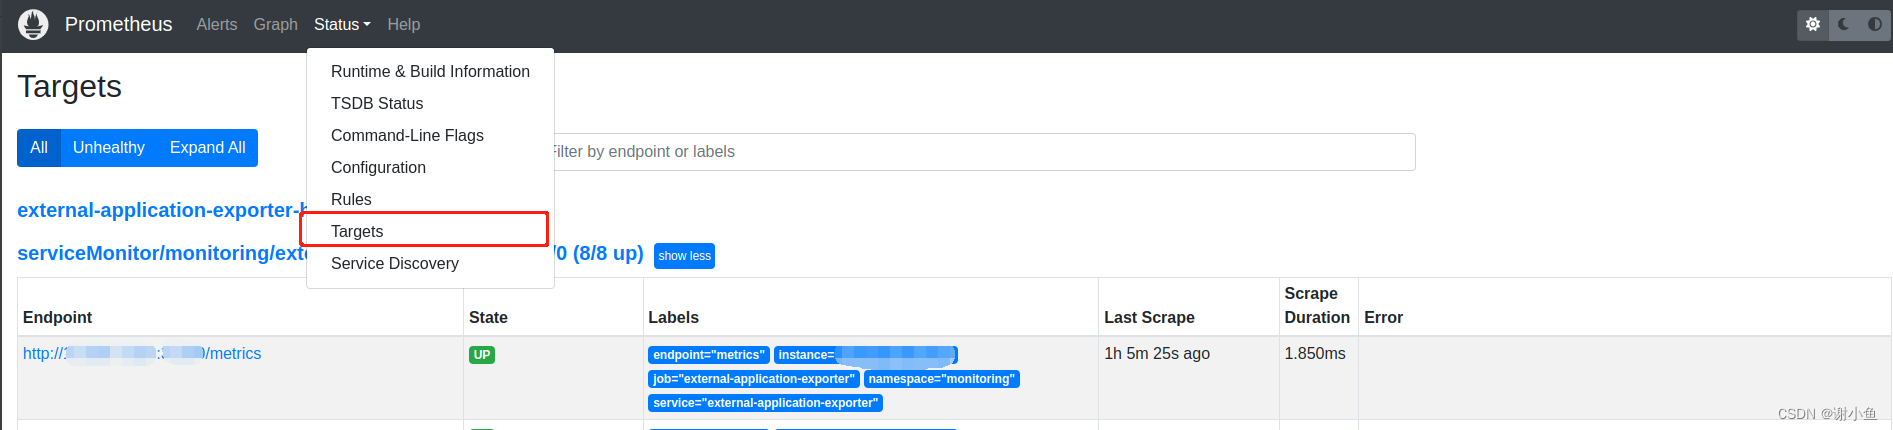
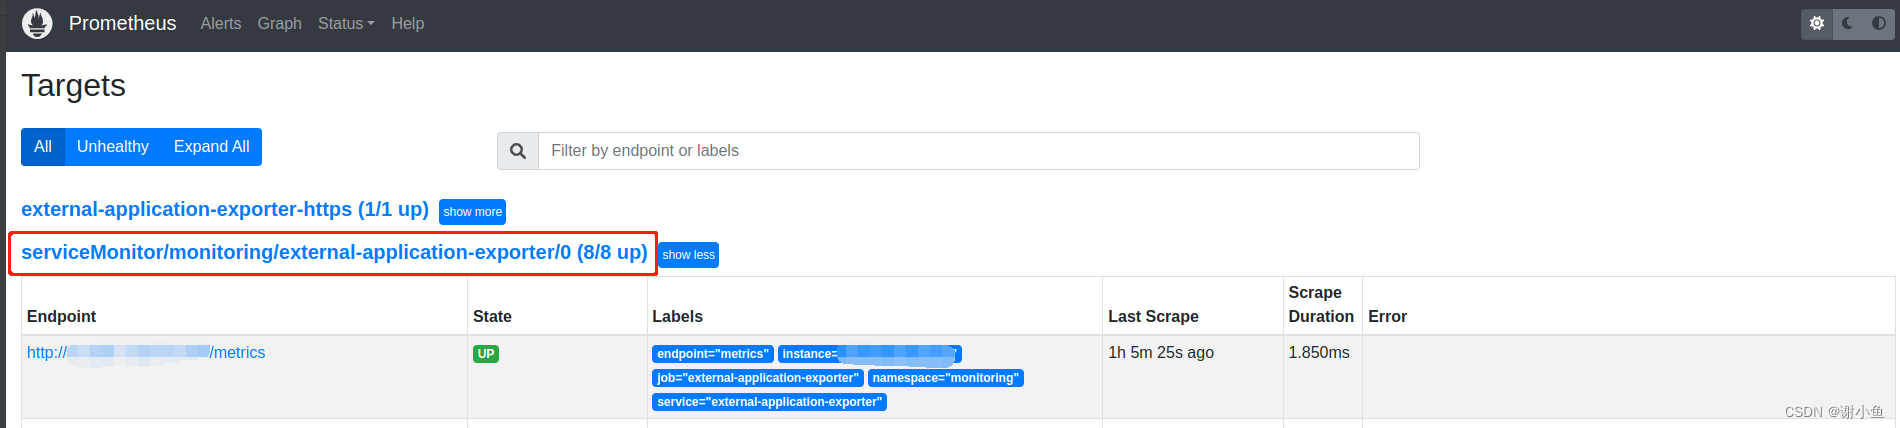
kubectl apply -f external-application.yaml
之后打开prometheus控制台,进入Targets目录。可以看到新增的external-application-exporter显示出来了:
Additional Scrape Configuration
除了ip加端口提供的HTTP服务以外,我还在其他服务器上部署了可以通过域名访问的HTTPS服务。现在想用同样的方法将其接入进来。
首先尝试修改Endpoints,找到k8s的官方文档,发现Endpoints仅支持ip,也没有配置HTTPS协议的地方。
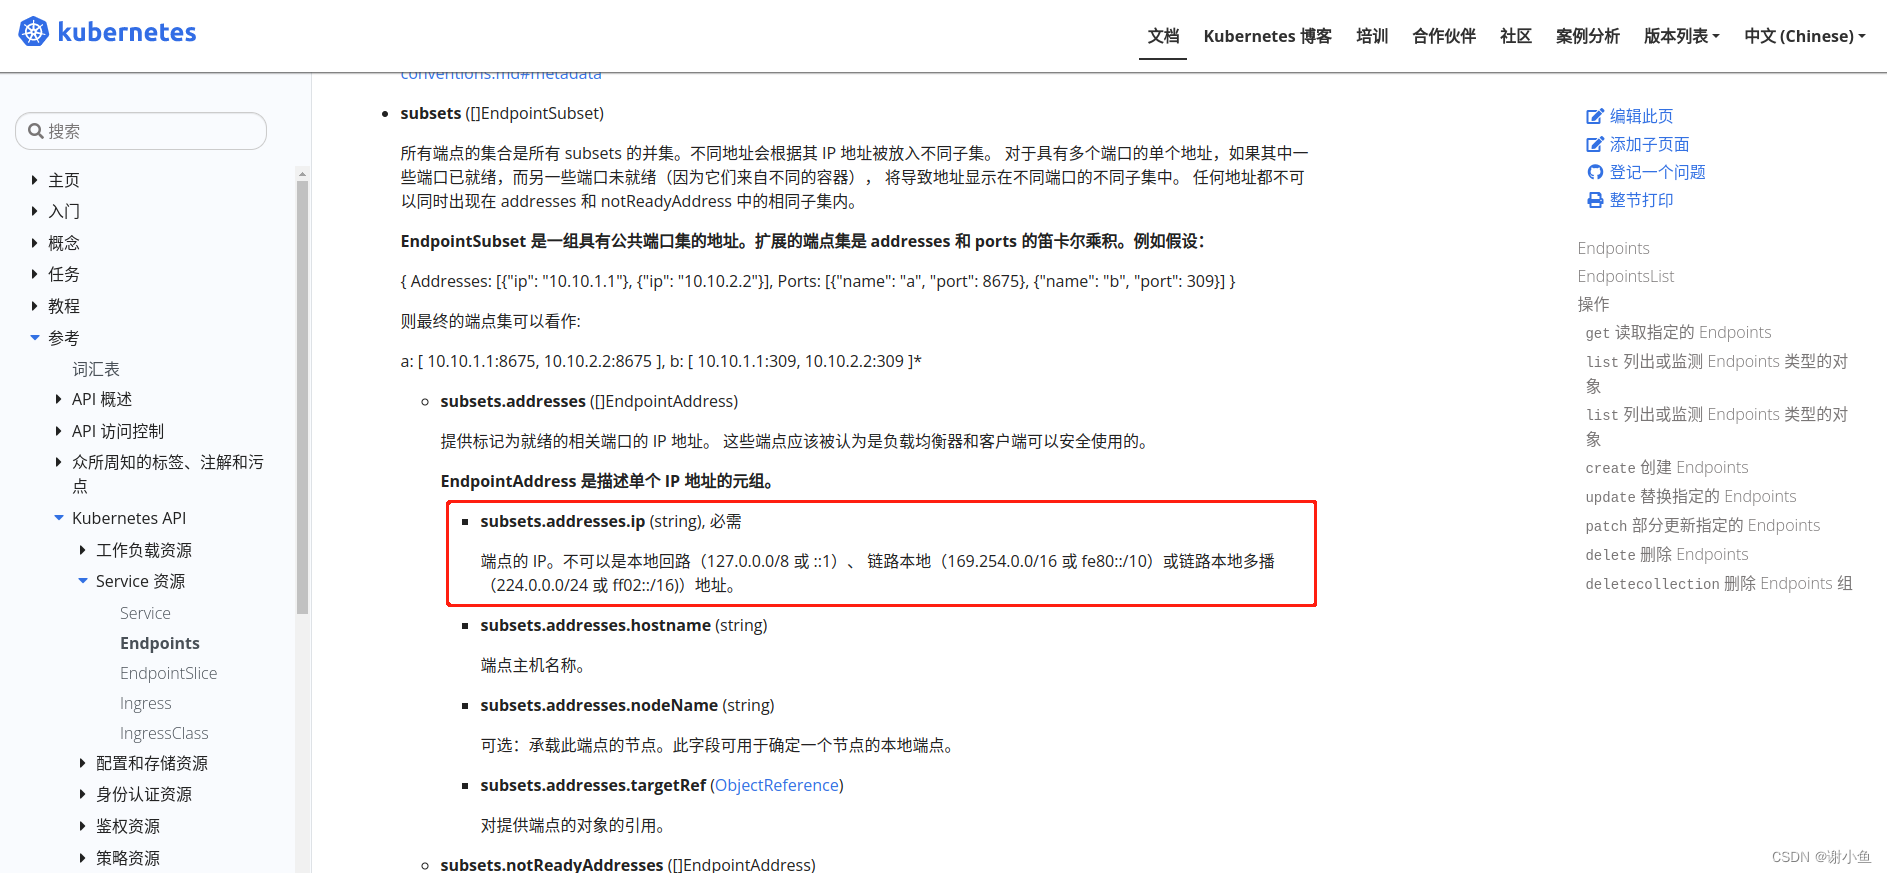
那么我们尝试换一种方式。
第一种方法
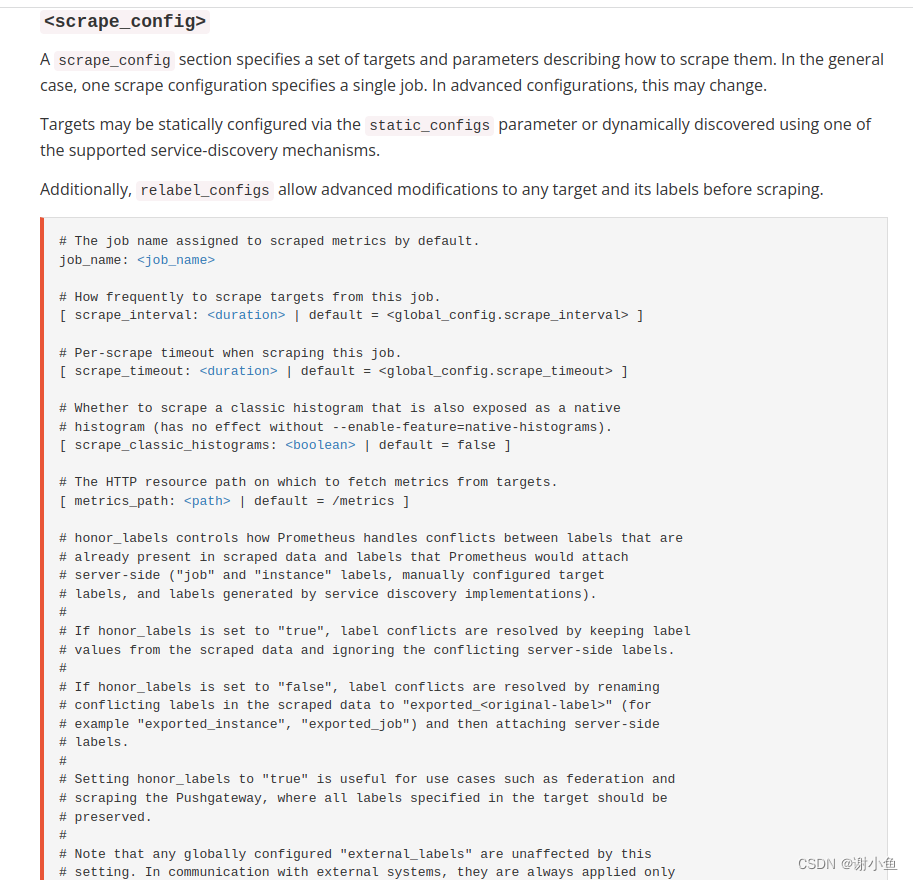
首先查阅官方文档,找到关于关于prometheus抓取配置的地方,可以看到,prometheus的抓取配置的关键字是scrape_config
我们的prometheus是通过helm部署kube-prometheus-stack得到的,所以我们查看一下该charts的value.yaml文件,看看有无配置。
输入命令:
$ cat values.yaml | grep -C 20 scrape_config
得到如下结果:
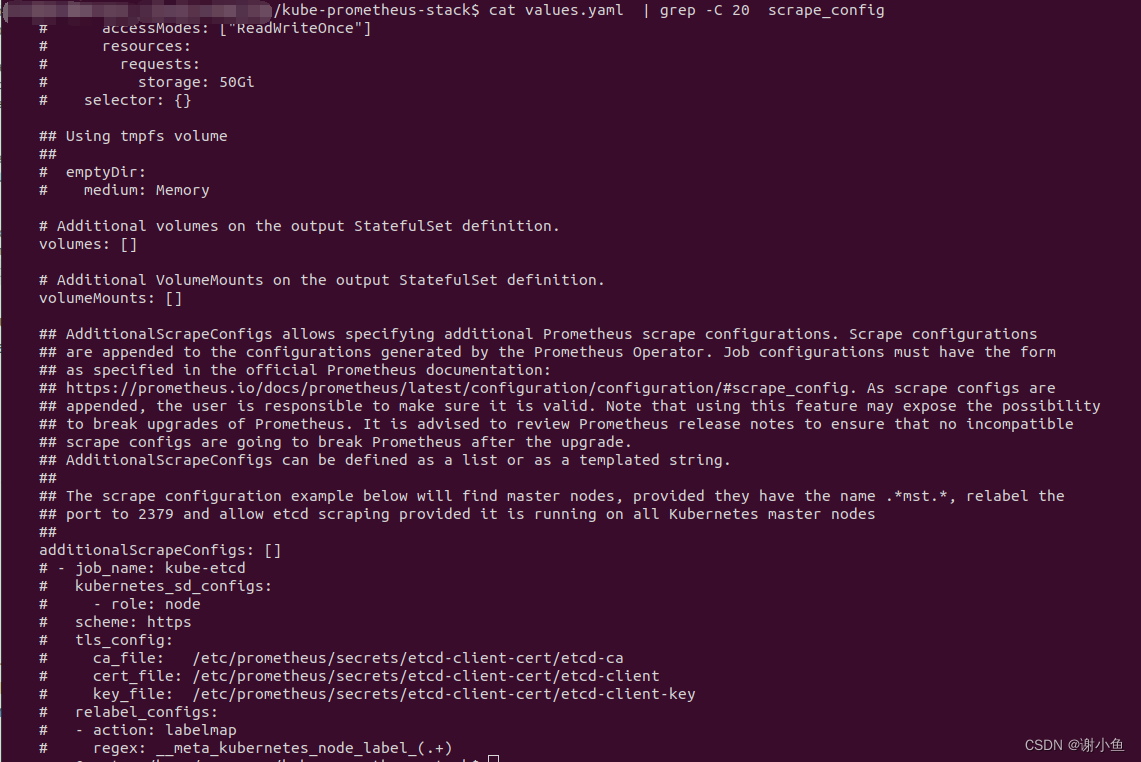
从注释中知道,kube-prometheus是通过additionalScrapeConfigs配置抓取策略的。
于是写一个配置文件去更新helm已经部署好的prometheus的release。
$ touch prometheus.yml

$ vim prometheus.yml
将一下内容写入:
prometheus:
  prometheusSpec:
    additionalScrapeConfigs:
      - job_name: external-application-exporter-https
      scrape_interval: 10s
      scrape_timeout: 10s
      metrics_path: /metrics
      scheme: https
      tls_config:
        insecure_skip_verify: true
      static_configs:
        - targets: ["www.baidu.com:443"]
最后更新release:
$ helm upgrade -nmonitoring -f prometheus.yaml prometheus kube-prometheus-stack-40.0.0.tgz
使用prometheus.yaml更新release,其中kube-prometheus-stack-40.0.0.tgz是我在部署prometheus时已经helm pull到本地的chart文件。
我们在prometheus的控制台的Targets目录下可以看到我们新添加的数据源。
到这里其实就可以结束了,但是有一个不好的地方是,每次添加新的域名监控,都需要重新更新helm的release,不是特别方便。
第二种方法
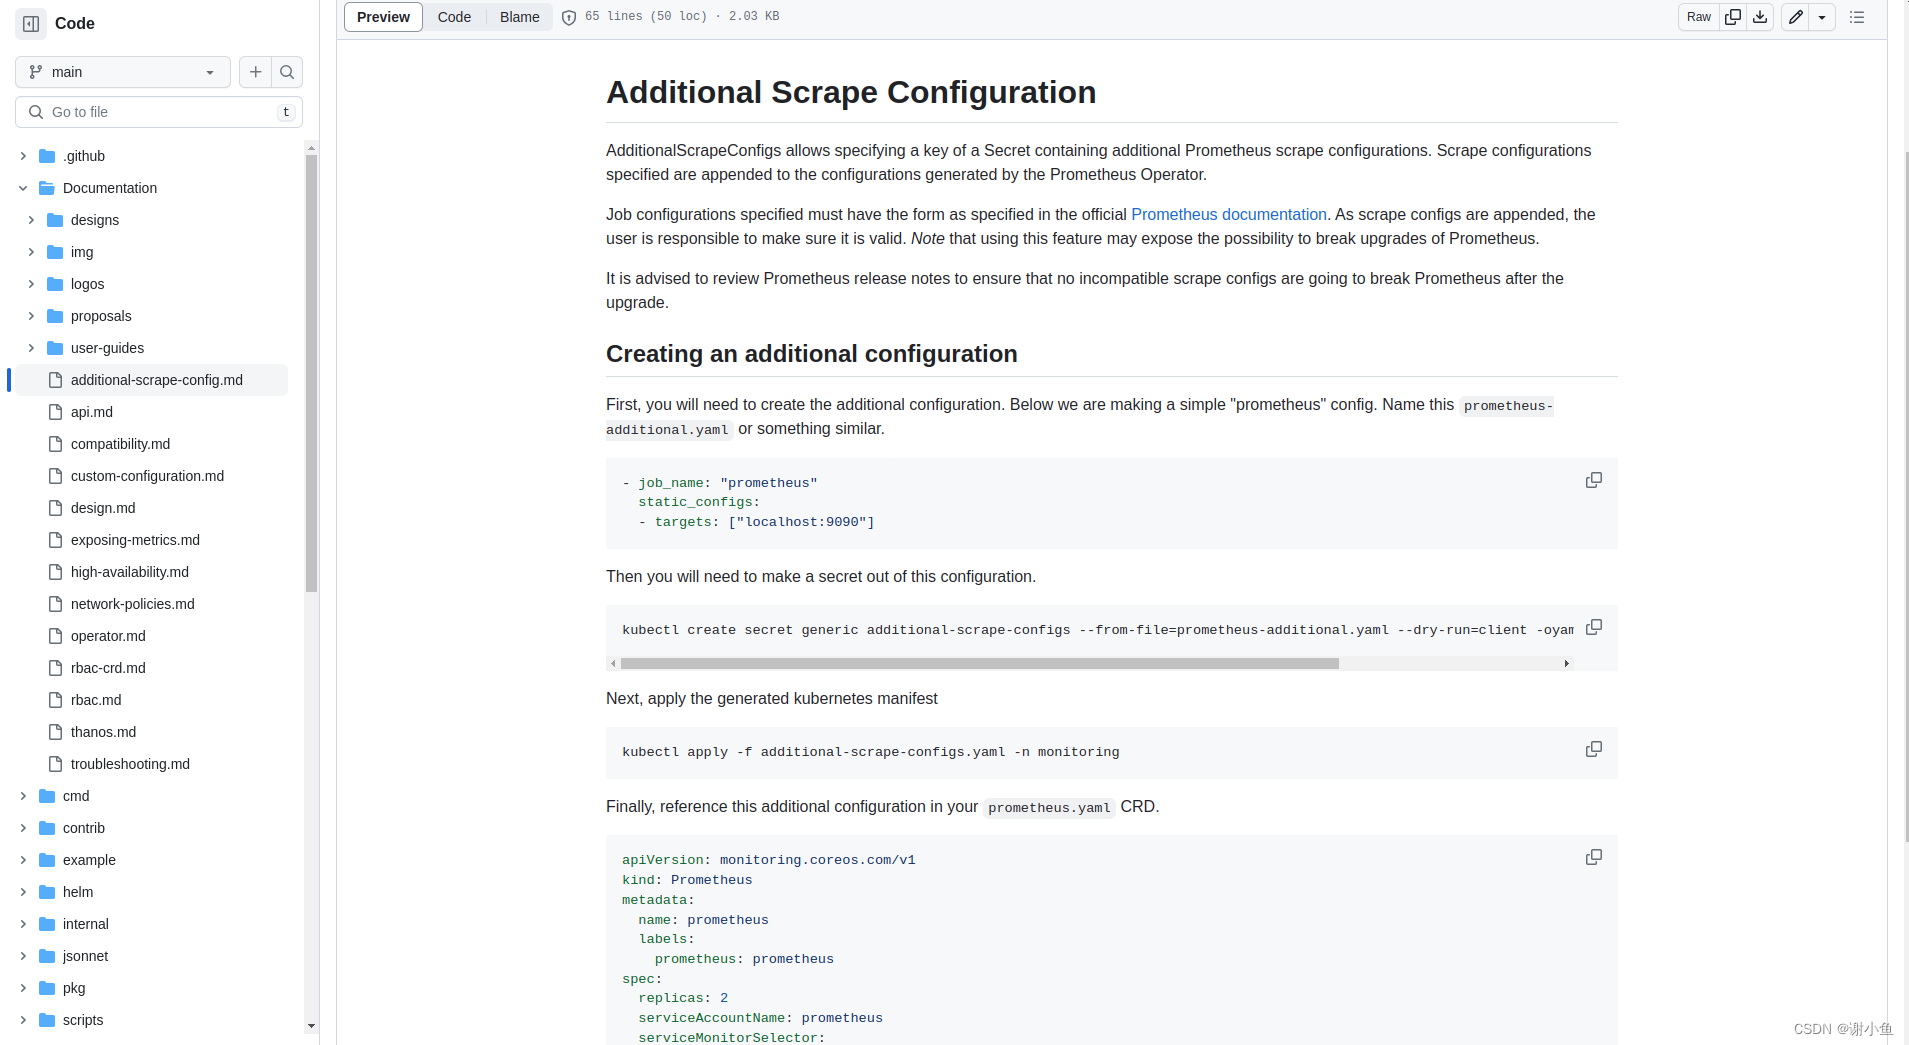
翻一翻prometheus-operator的源码,发现在说明中,有关于抓取配置热更新的教程。简单的概括就是,通过配置secret,来控制prometheus的抓取数据源。secret的内容修改时,可以热更新prometheus的抓取配置。截个图看一下:
第一步,生成prometheus-additional.yaml文件
$ touch prometheus-additional.yaml

$ vim prometheus-additional.yaml
prometheus-additional.yaml内容:
- job_name: external-application-exporter-https
  scrape_interval: 10s
  scrape_timeout: 10s
  metrics_path: /metrics
  scheme: https
  tls_config:
    insecure_skip_verify: true
  static_configs:
    - targets: ["www.baidu.com:443"]
第二步,生成secret
生成用于创建secret的配置文件:
$ kubectl create secret generic additional-scrape-configs --from-file=prometheus-additional.yaml --dry-run=client -oyaml > additional-scrape-configs.yaml

$ cat additional-scrape-configs.yaml
可以看到生成的additional-scrape-configs.yaml内容如下:
apiVersion: v1
data:
  prometheus-additional.yaml: LSBqb2JfbmFtZTogZXh0ZXJuYWwtYXBwbGljYXRpb24tZXhwb3J0ZXItaHR0cHMKICBzY3JhcGVfaW50ZXJ2YWw6IDEwcwogIHNjcmFwZV90aW1lb3V0OiAxMHMKICBtZXRyaWNzX3BhdGg6IC9tZXRyaWNzCiAgc2NoZW1lOiBodHRwcwogIHRsc19jb25maWc6CiAgICBpbnNlY3VyZV9za2lwX3ZlcmlmeTogdHJ1ZQogIHN0YXRpY19jb25maWdzOgogICAgLSB0YXJnZXRzOiBbImNpYW10ZXN0LnNtb2EuY2M6NDQzIl0K
kind: Secret
metadata:
  creationTimestamp: null
  name: additional-scrape-configs
将这段编码解码看一下内容:
$ echo "LSBqb2JfbmFtZTogZXh0ZXJuYWwtYXBwbGljYXRpb24tZXhwb3J0ZXItaHR0cHMKICBzY3JhcGVfaW50ZXJ2YWw6IDEwcwogIHNjcmFwZV90aW1lb3V0OiAxMHMKICBtZXRyaWNzX3BhdGg6IC9tZXRyaWNzCiAgc2NoZW1lOiBodHRwcwogIHRsc19jb25maWc6CiAgICBpbnNlY3VyZV9za2lwX3ZlcmlmeTogdHJ1ZQogIHN0YXRpY19jb25maWdzOgogICAgLSB0YXJnZXRzOiBbImNpYW10ZXN0LnNtb2EuY2M6NDQzIl0K" | base64 -d
得到:
- job_name: external-application-exporter-https
  scrape_interval: 10s
  scrape_timeout: 10s
  metrics_path: /metrics
  scheme: https
  tls_config:
    insecure_skip_verify: true
  static_configs:
    - targets: ["www.baidu.com:443"]
可以确认配置文件生成无误,接着生成secret:
$ kubectl apply -f additional-scrape-configs.yaml -n monitoring
monitoring是prometheus部署所在的命名空间,把它们放到同一个命名空间。
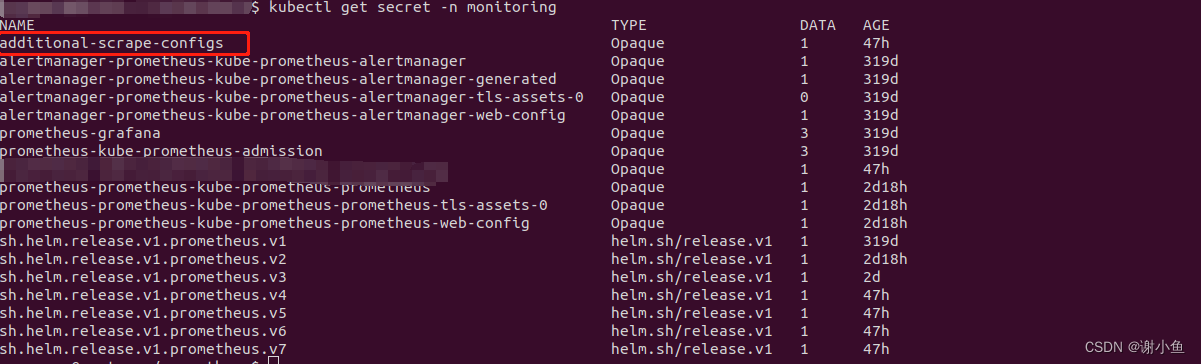
确认secret生成了:
$ kubectl get secret -n monitoring
输出:
最后,修改CRD
Finally, reference this additional configuration in your prometheus.yaml CRD.
官方文档让我们修改prometheus的配置
先找到prometheus这个CRD:
$ kubectl get prometheus -n monitoring
NAME                                    VERSION   REPLICAS   AGE
prometheus-kube-prometheus-prometheus   v2.38.0   1          2d18h
然后修改它
$ kubectl edit prometheus prometheus-kube-prometheus-prometheus -n monitoring
apiVersion: monitoring.coreos.com/v1
kind: Prometheus
metadata:
  name: prometheus
  labels:
    prometheus: prometheus
spec:
  ...
  additionalScrapeConfigs:
    name: additional-scrape-configs
    key: prometheus-additional.yaml
  ...
最后,在prometheus控制台看一下效果:
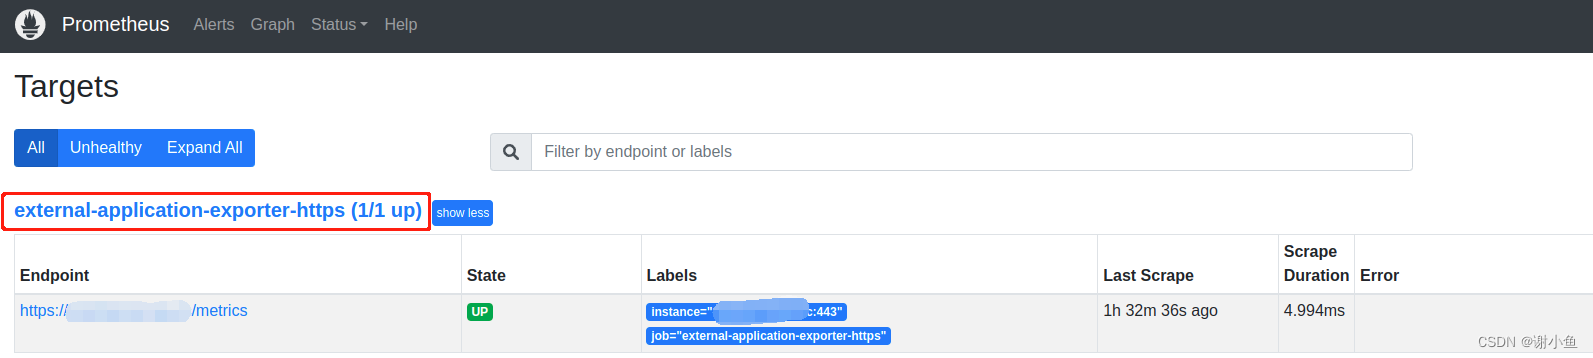
域名服务已经监控上了,以后想添加其他域名监控,只需要修改secret就行,great!!!
告警
关于告警,我们采用prometheus+alertmanager这一套方案。从监控告警信息到处置告警事件的主要流程如下:

我们的业务需求是,在服务挂了的时候能够收到通知,及时处置。所以我们这里需要配置的告警规则为,收集应用的存活信息,当检测到不存活状态,告警消息状态设为peding。当peding时长到达一定时间阈值,就将其设为firing,此时触发告警,告警信息提交到alertmanager,然后在alertmanager中按照规则,发送告警消息给消息接收者,如企微、钉钉、邮件等。
具体的做法如下:
步骤一 prometheus告警触发器
由于我是用helm部署的kube-prometheus-stack,为了保持版本一致性,将charts:kube-prometheus-stack-40.0.0.tgz提前下载(helm pull prometheus-community/kube-prometheus-stack --version=40.0.0)到本地了。解压之后,可以在kube-prometheus-stack 的 values.yaml 中找到如下 PrometheusRules 相关入口:
## Deprecated way to provide custom recording or alerting rules to be deployed into the cluster.
##
# additionalPrometheusRules: []
#  - name: my-rule-file
#    groups:
#      - name: my_group
#        rules:
#        - record: my_record
#          expr: 100 * my_record

## Provide custom recording or alerting rules to be deployed into the cluster.
##
#additionalPrometheusRulesMap: {}
#  rule-name:
#    groups:
#    - name: my_group
#      rules:
#      - record: my_record
#        expr: 100 * my_record
修改values.yaml:
## Deprecated way to provide custom recording or alerting rules to be deployed into the cluster.
##
# additionalPrometheusRules: []
#  - name: my-rule-file
#    groups:
#      - name: my_group
#        rules:
#        - record: my_record
#          expr: 100 * my_record

## Provide custom recording or alerting rules to be deployed into the cluster.
##
additionalPrometheusRulesMap:
  rule-name:
    groups:
    - name: Instance
      rules:
        # Alert for any instance that is unreachable for >5 minutes.
        - alert: InstanceDown
          expr: up == 0
          for: 5m
          labels:
            severity: page
          annotations:
            summary: "Instance {

    { $labels.instance }} down"
            description: "{

    { $labels.instance }} of job {

    { $labels.job }} has been down for more than 5 minutes."
然后更新helm release
helm upgrade -nmonitoring prometheus --values=values.yaml ../kube-prometheus-stack-40.0.0.tgz
更新完成后在prometheus控制台查看结果:
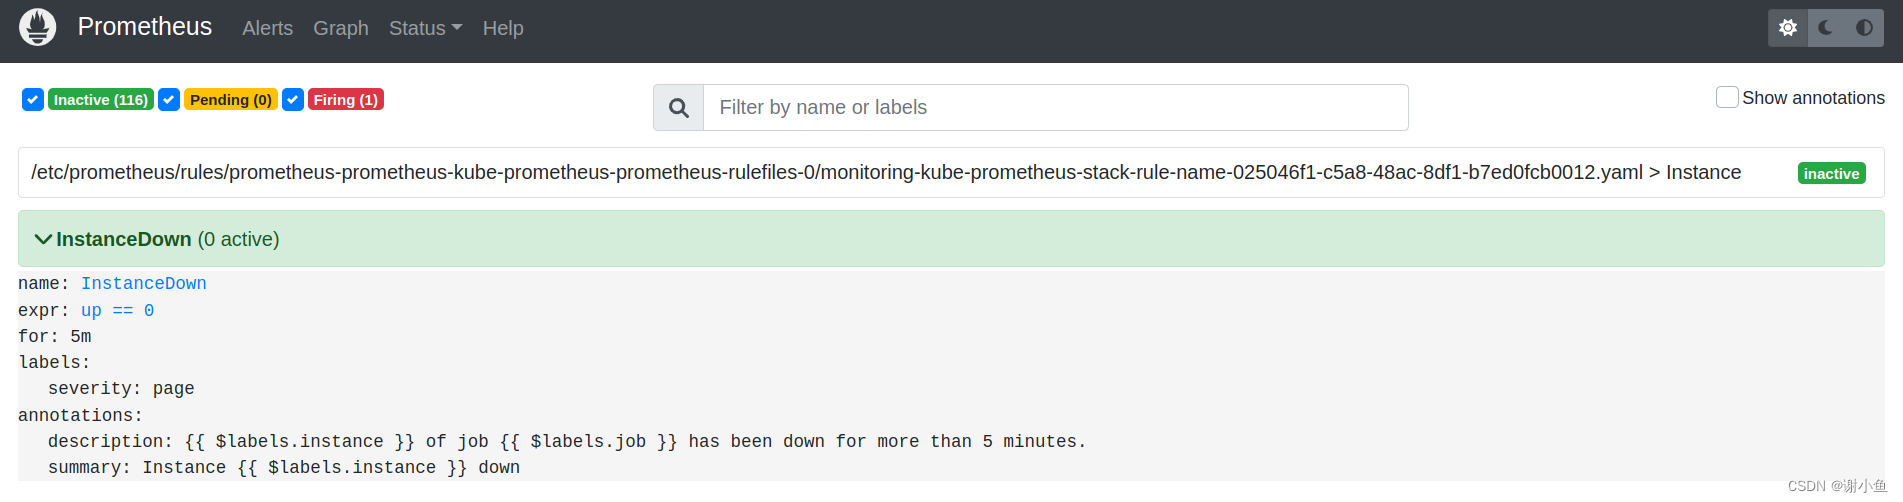
可以看到alert rules已经配置成功,根据告警规则,只要任意instance实例的状态不为up == 0,则会按照规则将alert状态改成peding,5分钟后仍未恢复,状态会变更为firing,触发告警消息。
步骤二 alertmanager 告警通知
prometheus触发器收集到了告警消息之后,会发送到alertmanager进行统一管理。alertmanager配置一定的规则,将告警消息分发给不同的接收者。
在kube-prometheus-stack 的 values.yaml 中找到如下 alertmanager.config 相关入口。alertmanager.config 提供了指定 altermanager 的配置,这样就能够自己定制一些特定的 receivers 。原始的配置如下:
## Configuration for alertmanager
## ref: https://prometheus.io/docs/alerting/alertmanager/
##
alertmanager:
...
  ## Alertmanager configuration directives
  ## ref: https://prometheus.io/docs/alerting/configuration/#configuration-file
  ##      https://prometheus.io/webtools/alerting/routing-tree-editor/
  ##
  config:
    global:
      resolve_timeout: 5m
    inhibit_rules:
      - source_matchers:
          - 'severity = critical'
        target_matchers:
          - 'severity =~ warning|info'
        equal:
          - 'namespace'
          - 'alertname'
      - source_matchers:
          - 'severity = warning'
        target_matchers:
          - 'severity = info'
        equal:
          - 'namespace'
          - 'alertname'
      - source_matchers:
          - 'alertname = InfoInhibitor'
        target_matchers:
          - 'severity = info'
        equal:
          - 'namespace'
    route:
      group_by: ['namespace']
      group_wait: 30s
      group_interval: 5m
      repeat_interval: 12h
      receiver: 'null'
      routes:
      - receiver: 'null'
        matchers:
          - alertname =~ "InfoInhibitor|Watchdog"
    receivers:
    - name: 'null'
    templates:
    - '/etc/alertmanager/config/*.tmpl'
我们将其修改为:
## Configuration for alertmanager
## ref: https://prometheus.io/docs/alerting/alertmanager/
##
alertmanager:
...
  ## Alertmanager configuration directives
  ## ref: https://prometheus.io/docs/alerting/configuration/#configuration-file
  ##      https://prometheus.io/webtools/alerting/routing-tree-editor/
  ##
  config:
    global:
      resolve_timeout: 5m
    inhibit_rules:
      - source_matchers:
          - 'severity = critical'
        target_matchers:
          - 'severity =~ warning|info'
        equal:
          - 'namespace'
          - 'alertname'
      - source_matchers:
          - 'severity = warning'
        target_matchers:
          - 'severity = info'
        equal:
          - 'namespace'
          - 'alertname'
      - source_matchers:
          - 'alertname = InfoInhibitor'
        target_matchers:
          - 'severity = info'
        equal:
          - 'namespace'
    route:
      group_by: ['instance']
      group_wait: 30s
      group_interval: 5m
      repeat_interval: 12h
      receiver: 'wx-webhook'
      routes:
    receivers:
    - name: 'wx-webhook'
      webhook_configs:
      - url: "http://wx-webhook:80/adapter/wx"
        send_resolved: true
    templates:
    - '/etc/alertmanager/config/*.tmpl'
其中webhook_configs[0].url: "http://wx-webhook:80/adapter/wx"中的地址为接受告警消息的企业微信群机器人webhook,企业微信群机器人webhook的搭建接下来会详细讲解。
然后更新helm release
helm upgrade -nmonitoring prometheus --values=values.yaml ../kube-prometheus-stack-40.0.0.tgz
配置完成后,关掉一个服务,在企业微信群查看结果:

步骤三 搭建企业微信群机器人webhook
生成一个企微机器人
在群设置中,进入群机器人功能:

然后添加群机器人,复制添加的群机器人的Webhook地址

编写deployment配置文件wx-webhook-deployment.yaml:
apiVersion: apps/v1
kind: Deployment
metadata:
  name: wx-webhook
  labels:
    app: wx-webhook
spec:
  replicas: 1
  selector:
    matchLabels:
      app: wx-webhook
  template:
    metadata:
      labels:
        app: wx-webhook
    spec:
      containers:
      - name: wx-webhook
        image: guyongquan/webhook-adapter:latest
        imagePullPolicy: IfNotPresent
        args: ["--adapter=/app/prometheusalert/wx.js=/wx=https://qyapi.weixin.qq.com/cgi-bin/webhook/send?key=xxxxxxxxxxxxxxxxxxxxxx"]
        ports:
        - containerPort: 80

---
apiVersion: v1
kind: Service
metadata:
  name: wx-webhook
  labels:
    app: wx-webhook
spec:
  selector:
    app: wx-webhook
  ports:
    - name: wx-webhook
      port: 80
      protocol: TCP
      targetPort: 80
      nodePort: 30904
  type: NodePort
其中args: ["--adapter=/app/prometheusalert/wx.js=/wx=https://qyapi.weixin.qq.com/cgi-bin/webhook/send?key=xxxxxxxxxxxxxxxxxxxxxx"]的内容为上一步创建的企微机器人Webhook地址
紧接着运行命令:
$ kubectl apply -f wx-webhook-deployment.yaml -nmonitoring
$ kubectl get pod -n monitoring | grep wx-webhook
wx-webhook-78d4dc95fc-9nsjn                              1/1     Running   0                26d
$ kubectl get service -n monitoring | grep wx-webhook
wx-webhook          NodePort    10.106.111.183   <none>        80:30904/TCP                 27d
这样就完成了企业微信群机器人webhook的搭建。
这里我使用的是企业微信作为告警消息的接收者,alertmanager也支持其他消息接收者。可以参考这篇文章:kube-promethues监控告警详解(邮件、钉钉、微信、企微机器人、自研平台)
遇到的问题
- 更新抓取配置的secret后prometheus的控制台看不到效果
尝试重启pod:prometheus-prometheus-kube-prometheus-prometheus-0,报错:
ts=2023-07-29T09:30:54.188Z caller=main.go:454 level=error msg=“Error loading config (–config.file=/etc/prometheus/config_out/prometheus.env.yaml)” file=/etc/prometheus/config_out/prometheus.env.yaml err=“parsing YAML file /etc/prometheus/config_out/prometheus.env.yaml: scrape timeout greater than scrape interval for scrape config with job name “external-application-exporter-https””
原因是,自定义指标的配置出错导致prometheus启动失败,scrape_interval和scrape_timeout存在问题
- job_name: external-application-exporter-https
  scrape_interval: 10s
  scrape_timeout: 30s
  metrics_path: /metrics
  scheme: https
  tls_config:
    insecure_skip_verify: true
  static_configs:
    - targets: ["www.baidu.com:443"]
需要改成
- job_name: external-application-exporter-https
  scrape_interval: 10s
  scrape_timeout: 10s
  metrics_path: /metrics
  scheme: https
  tls_config:
    insecure_skip_verify: true
  static_configs:
    - targets: ["www.baidu.com:443"]