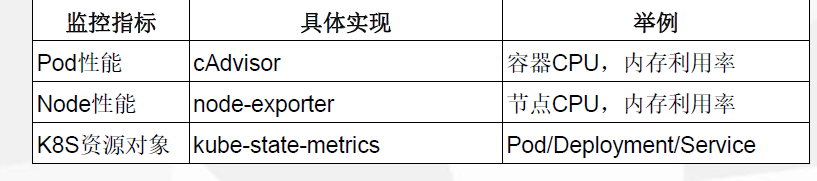
1、k8s 监控资源对象
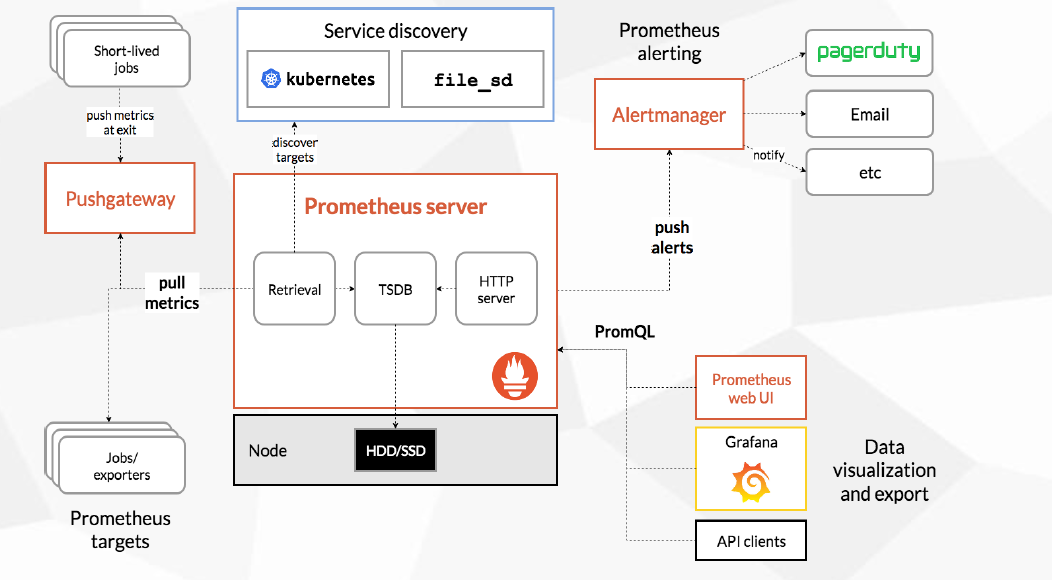
2、 prometheus简单介绍。 https://github.com/prometheus
•多维数据模型:由度量名称和键值对标识的时间序列数据
•PromSQL:一种灵活的查询语言,可以利用多维数据完成复杂的查询
•不依赖分布式存储,单个服务器节点可直接工作
•基于HTTP的pull方式采集时间序列数据
•推送时间序列数据通过PushGateway组件支持
•通过服务发现或静态配置发现目标
•多种图形模式及仪表盘支持(grafana)
组件介绍:
3、prometheus 部署。
[root@VM_0_48_centos prometheus]# cat  prometheus-statefulset.yaml
apiVersion: apps/v1
kind: StatefulSet
metadata:
  name: prometheus
  namespace: kube-system
  labels:
    k8s-app: prometheus
    kubernetes.io/cluster-service: "true"
    addonmanager.kubernetes.io/mode: Reconcile
    version: v2.2.1
spec:
  serviceName: "prometheus"
  replicas: 1
  podManagementPolicy: "Parallel"
  updateStrategy:
   type: "RollingUpdate"
  selector:
    matchLabels:
      k8s-app: prometheus
  template:
    metadata:
      labels:
        k8s-app: prometheus
      annotations:
        scheduler.alpha.kubernetes.io/critical-pod: ''
    spec:
      priorityClassName: system-cluster-critical
      serviceAccountName: prometheus
      initContainers:
      - name: "init-chown-data"
        image: "busybox:latest"
        imagePullPolicy: "IfNotPresent"
        command: ["chown", "-R", "65534:65534", "/data"]
        volumeMounts:
        - name: prometheus-data
          mountPath: /data
          subPath: ""
      containers:
        - name: prometheus-server-configmap-reload
          image: "jimmidyson/configmap-reload:v0.1"
          imagePullPolicy: "IfNotPresent"
          args:
            - --volume-dir=/etc/config
            - --webhook-url=http://localhost:9090/-/reload
          volumeMounts:
            - name: config-volume
              mountPath: /etc/config
              readOnly: true
          resources:
            limits:
              cpu: 10m
              memory: 10Mi
            requests:
              cpu: 10m
              memory: 10Mi

        - name: prometheus-server
          image: "prom/prometheus:v2.2.1"
          imagePullPolicy: "IfNotPresent"
          args:
            - --config.file=/etc/config/prometheus.yml
            - --storage.tsdb.path=/data
            - --web.console.libraries=/etc/prometheus/console_libraries
            - --web.console.templates=/etc/prometheus/consoles
            - --web.enable-lifecycle
          ports:
            - containerPort: 9090
          readinessProbe:
            httpGet:
              path: /-/ready
              port: 9090
            initialDelaySeconds: 30
            timeoutSeconds: 30
          livenessProbe:
            httpGet:
              path: /-/healthy
              port: 9090
            initialDelaySeconds: 30
            timeoutSeconds: 30
          # based on 10 running nodes with 30 pods each
          resources:
            limits:
              cpu: 200m
              memory: 1000Mi
            requests:
              cpu: 200m
              memory: 1000Mi

          volumeMounts:
            - name: config-volume
              mountPath: /etc/config
            - name: prometheus-data
              mountPath: /data
              subPath: ""
      terminationGracePeriodSeconds: 300
      volumes:
        - name: config-volume
          configMap:
            name: prometheus-config
        - name: prometheus-data
          persistentVolumeClaim:
            claimName: prometheus-claim   #采用静态PV,必须现部署
[root@VM_0_48_centos prometheus]# cat   prometheus-service.yaml
kind: Service
apiVersion: v1
metadata:
  name: prometheus
  namespace: kube-system
  labels:
    kubernetes.io/name: "Prometheus"
    kubernetes.io/cluster-service: "true"
    addonmanager.kubernetes.io/mode: Reconcile
spec:
  type: NodePort  #使用NodePort  访问
  ports:
    - name: http
      port: 9090
      protocol: TCP
      targetPort: 9090
  selector:
    k8s-app: prometheus
[root@VM_0_48_centos ~]# kubectl  get svc  -n kube-system |grep prometheus
prometheus             NodePort    10.0.0.94    <none>        9090:48403/TCP           39h
