Zabbix 第六章
6.7 数据收集-Log Monitor
日志监控是需要安装配置Zabbix Agent的,因为日志监控只能是以主动的形式。
- 需要安装zabbox-agent 并开启active 只能主动模式 zabbix_agent的hostname和zabbix_server的名称一致,zabbix_server端启动StartTrappers
- 需要启动zabbix-agent的用户对日志文件有读的权限
- 10051端口要保持通畅
作用: 系统 业务 应用的日志监控
监控是否有人暴力破解
java的应用程序是否有错误 等等
数据收集流程
zabbix-agent 主动到server 拉取最新的监控项,如果监控项里有日志监控的,则zabbix-agent根据配置对对应的日志进行监控,对匹配到关键字的日志,zabbix-agent会将信息反馈给zabbix-server,如果没有匹配到的话,zabbix-agent返回信息就为空

监控项语法:logrt支持日志迭代 比如日志会有日志切割。 count是匹配行数
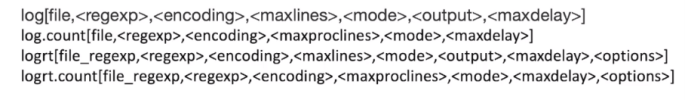 logrt[日志路径,关键字的正则表达式,日志文件的编码,Zabbix Agent处理的最大行数,模式(skip表示跳过旧的,只关注新写入的),日志监控输出,忽略旧的日志文件,针对日志格式的方式来切割日志]
第一步:检查日志监控的前提条件
确保agent安装并启动
#ps aux|grep zabbix
客户端的配置文件 /etc/zabbix/zabbix_agentd.conf
检查Server、ServerActive,Hostname、telnet服务器的10051
AllowRoot=1 #1表示zabbix_agent进程是root启动的 0表示不是root
服务端的配置文件 /etc/zabbix/zabbix_server.conf
检查Trapper进程是否开启,用来接收主动模式监控项的值
第二步:在监控模板创建日志监控项
客户端创建自定义日志的文件
[root@localhost ~]# touch /var/log/monitor_findsec.log
监控日志文件的关键字来实现监控 和 监控错误日志数量
创建监控项>类型选择zabbix-agent 主动模式>key选择log[不写表示使用默认]

在客户端上写入日志
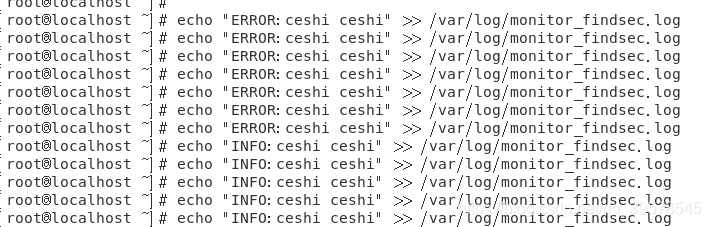
结果:

6.8 数据搜集-SNMP Agent
无agent的收集方式很多,其中常用的SNMP方式

SNMP是简单的网络管理协议,提供了设备与网络交互的方法。默认是通过UDP 161 162通信。 V3提供了安全控制版本。
OID是对象标识符,每个OID都是唯一的,并且每个厂商的前缀都是不一样的,可读可写。
客户端可通过OID查询或者更改网络设备的信息
OID不利于人的可视化。 利用MIB(管理信息基础),提供了OID含义的映射关系,并且解释了OID的数据类型。通过MIB就很容易知道当前OID的作用和其他的一些基本信息。
SNMP Agent针对无法安装Agent的网络设备,都可通过SNMP。 比如打印机,路由器,交换机,存储设备,防火墙等

数据收集流程

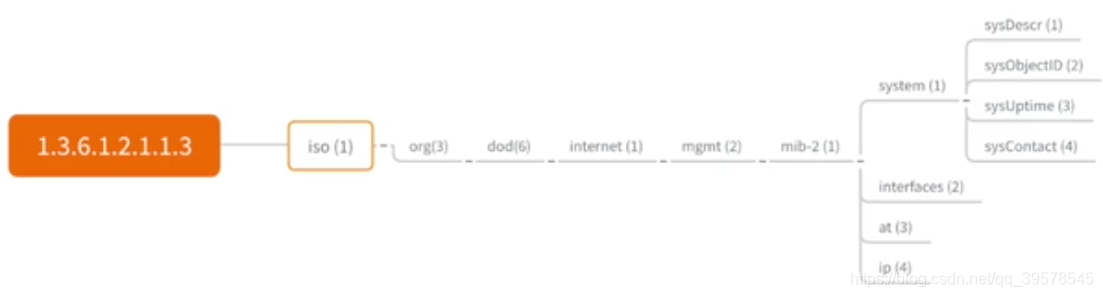
OID
第一步:在被监控端agent端 安装和配置SNMP服务
#yum install net-snmp net-snmp-utils -y
创建SNMP用户
#net-snmp-create-v3-user
[root@localhost ~]# net-snmp-create-v3-user
Enter a SNMPv3 user name to create:
zabbix
Enter authentication pass-phrase:
zabbix@findsec
Enter encryption pass-phrase:
  [press return to reuse the authentication pass-phrase]
zabbix@findsec
adding the following line to /var/lib/net-snmp/snmpd.conf:
   createUser zabbix MD5 "zabbix@findsec" DES zabbix
adding the following line to /etc/snmp/snmpd.conf:
   rwuser zabbix

MD5认证的,DES加密。检查这两行有加入到配置文件
第二步:启动SNMP相关的服务,测试
#systemctl start snmpd
测试
[root@localhost ~]# snmpwalk -v 3 -u zabbix -a MD5 -A ‘zabbix@findsec’ -l authPriv -x DES -X ‘zabbix@findsec’ localhost
第三步:检查Zabbix Server是否满足前提条件
是否启动SNMP服务
#yum install net-snmp-utils
[root@localhost ~]# snmpwalk -v 3 -u zabbix -a MD5 -A ‘zabbix@findsec’ -l authPriv -x DES -X ‘zabbix@findsec’ 192.168.93.147
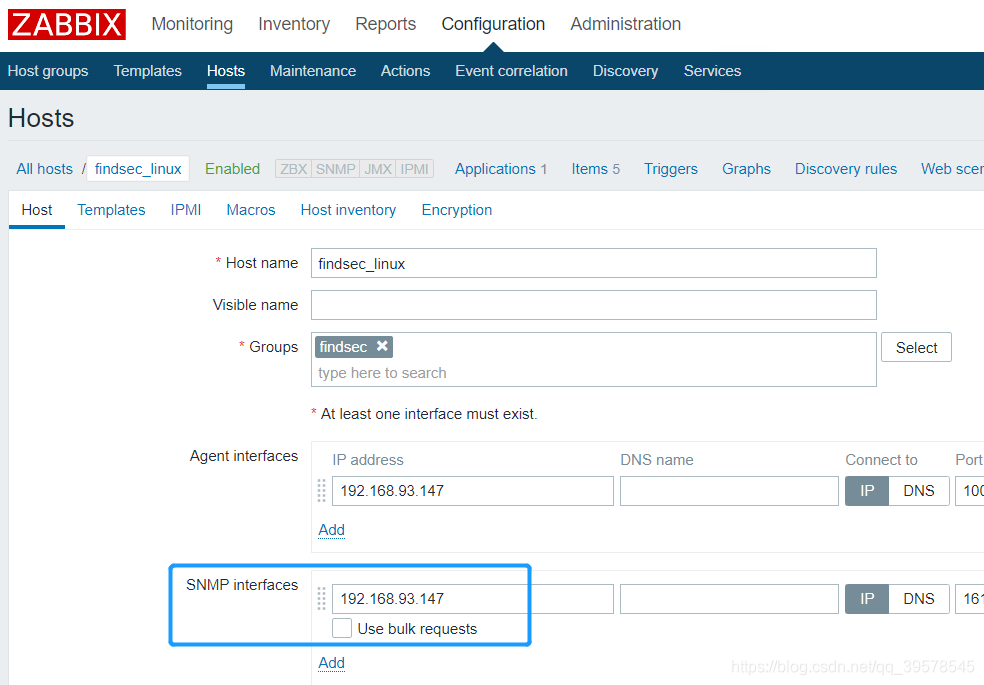
第四步:Zabbix 前端管理页面配置SNMP监控
需要在被监控SNMP的host添加SNMP监控的接口,其次才能创建SNMP监控项
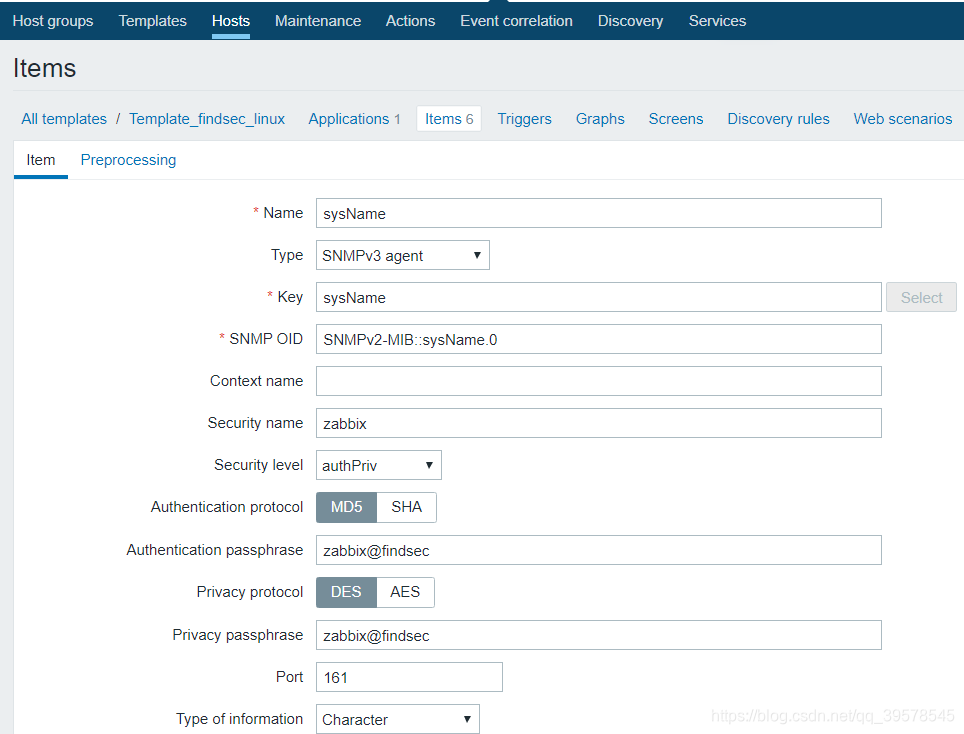
创建监控项
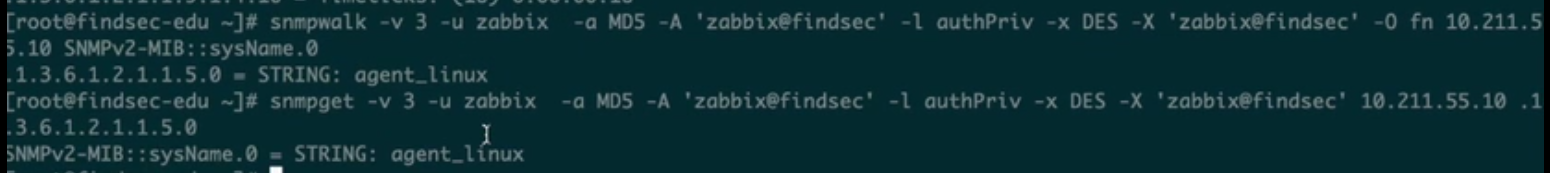
[root@localhost ~]# snmpget -v 3 -u zabbix -a MD5 -A ‘zabbix@findsec’ -l authPriv -x DES -X ‘zabbix@findsec’ 192.168.93.147 SNMPv2-MIB::sysName.0
SNMPv2-MIB::sysName.0 = STRING: localhost.localdomain
[root@localhost ~]# snmpwalk -v 3 -u zabbix -a MD5 -A ‘zabbix@findsec’ -l authPriv -x DES -X ‘zabbix@findsec’-O fn 192.168.93.147 SNMPv2-MIB::sysName.0
用-O fn 就能看到 数字类型的OID
如图举例(实际地址是 192.168.93.147):
下图是在模板中创建监控项。 如果在主机中创建监控项 会多了Host interface
[root@localhost ~]# snmpwalk -v 3 -u zabbix -a MD5 -A ‘zabbix@findsec’
-l authPriv -x DES -X ‘zabbix@findsec’ 192.168.93.147 |more 可以根据自己的情况去选择不同的OID进行不同的监控
结果:

★6.9 数据收集-SNMP Trap
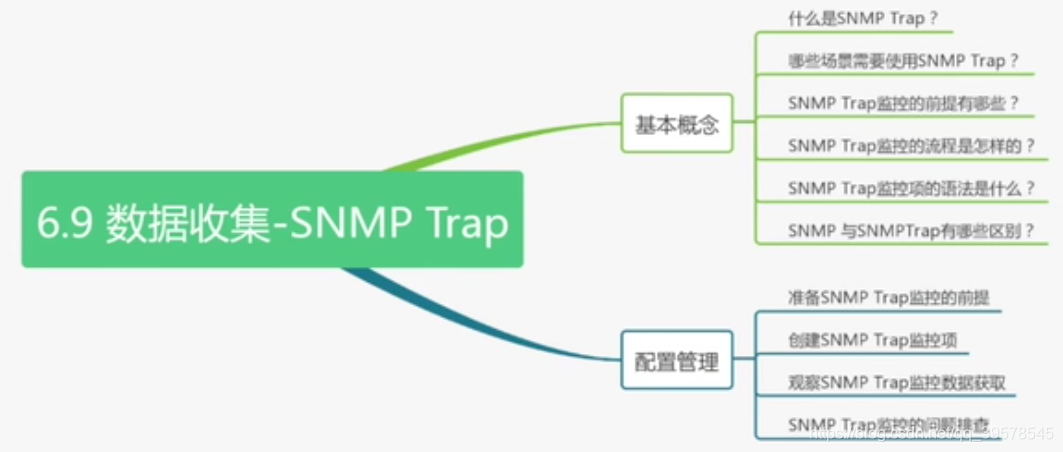
SNMP Trap是当被监控的设备出现问题时,主动将告警信息发送给管理端或者监控设备,不需要监控设备去拉取信息,提高了事件 (如CPU利用率高了,磁盘告警等)发生的及时性.相比于Agent不会因为抓取数据过快,对监控设备造成性能上的压力.
Trap的优势就是异常事件的及时发现,是基于事件的.
使用的端口161和162
161主要用于查询
162主要用于trap通信
支持trap的前提条件:
-
zabbix server端
1 需要支持SNMP 编译时–with-net-snmp
2 配置StartSNMPTrapper和SNMPTrapperFile
3 配置SNMPT服务
4 配置Perl trap receiver(生产环境使用perl脚本 效率更高)
5 允许zabbix server和被监控设备的161 162端口udp通信 -
被监控设备
允许zabbix server和被监控设备的161 162端口udp通信(配置SNMP Trap信息发送)
数据收集流程

语法
snmptrap[regexp]
snmptrap.fallback(用于匹配上面正则没有匹配上的信息)
步骤:
第一步:前提条件配置
监控设备端
Server服务器端
安装snmp trap服务、配置对应的 、 配置Zabbix Server的配置文件,指定SNMP Trapper进程和SNMP Trapper file
[root@localhost ~]# yum install -y net-snmp net-snmp-utils net-snmp-perl
下载Zabbix Server 4.0源码包,准备好zabbix_trap_receiver.pl脚本
https://www.zabbix.com/download_sources#tab:40LTS
root@localhost ~]# wget https://cdn.zabbix.com/zabbix/sources/stable/4.0/zabbix-4.0.20.tar.gz
root@localhost ~]# tar -zxvf zabbix-4.0.20.tar.gz
[root@localhost ~]# cp zabbix-4.0.20/misc/snmptrap/zabbix_trap_receiver.pl /usr/bin
[root@localhost ~]# chmod +x /usr/bin/zabbix_trap_receiver.pl
配置snmp trap的服务
[root@localhost ~]# vim /etc/snmp/snmptrapd.conf
authCommunity log,execute,net public
perl do "/usr/bin/zabbix_trap_receiver.pl"


authCommunity 开头的一行配置了 snmptrapd 的安全设置,表示可以接收 community 为”public”的 SNMP Trap,并且本进程可以有 log,net 和 execute 的权限
重启
[root@localhost ~]# systemctl restart snmptrapd.service
[root@localhost ~]# systemctl enable snmptrapd.service
修改Zabbix Server的配置文件
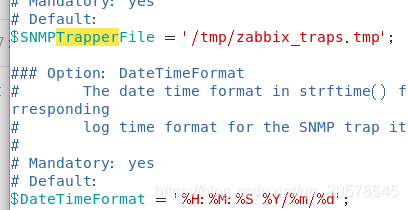
先确认zabbix_trap_receiver.pl 所处理的日志路径
[root@localhost ~]# vim /usr/bin/zabbix_trap_receiver.pl
$SNMPTrapperFile = ‘/tmp/zabbix_traps.tmp’;
[root@localhost ~]# vim /etc/zabbix/zabbix_server.conf
SNMPTrapperFile=/tmp/zabbix_traps.tmp
StartSNMPTrapper=1
重启
[root@localhost ~]# systemctl restart zabbix-server.service
被监控设备
Agent客户端
如果是网络设备SNMP,可以配置网络设备对应SNMP Trap的信息
#yum install net-snmp-utils 检查安装没有
从agent向server发送
snmptrap --help
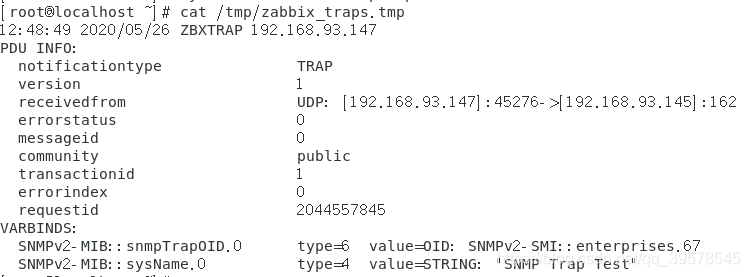
[root@localhost ~]# snmptrap -v 2c -c public 192.168.93.145 "hostname snmptraptest" '1.3.6.1.4.1.67' SNMPv2-MIB::sysName.0 s "SNMP Trap Test"
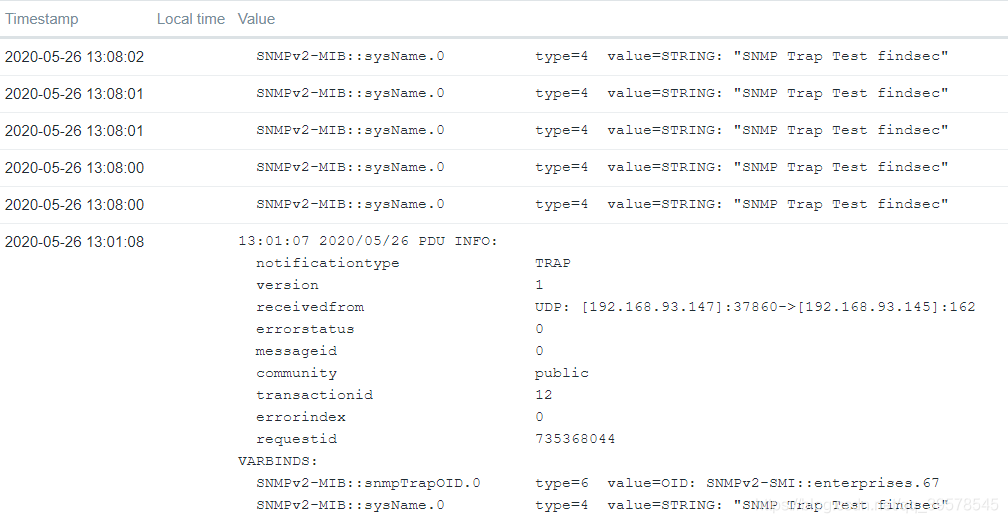
可以通过zabbix-server上的/tmp/zabbix_traps.tmp查看发送过来的信息
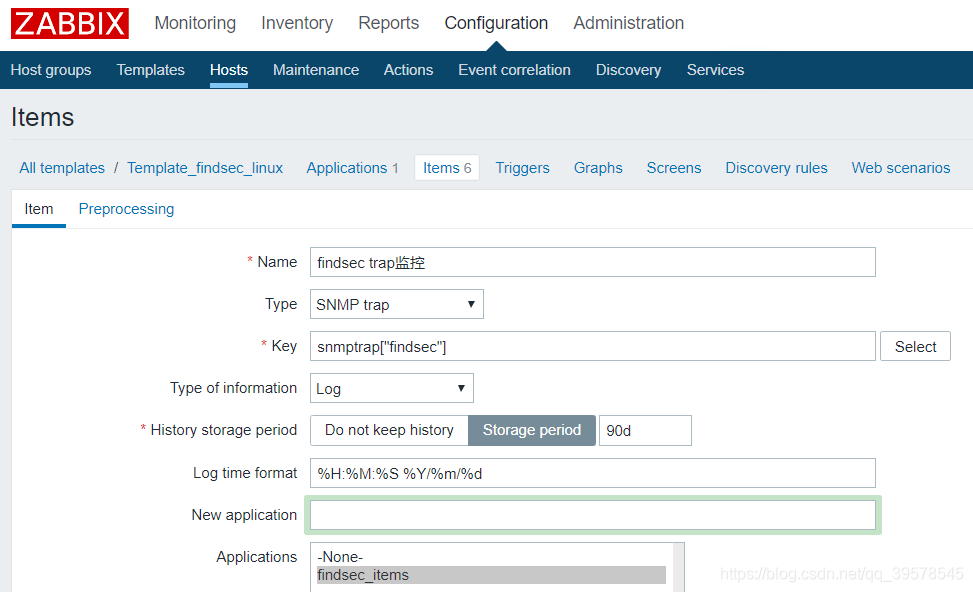
第二步:在Web端配置SNMP监控项
Log time format :%H:%M:%S %Y/%m/%d
查看 Server端的 /usr/bin/zabbix_trap_receiver.pl
$DateTimeFormat = ‘%H:%M:%S %Y/%m/%d’;
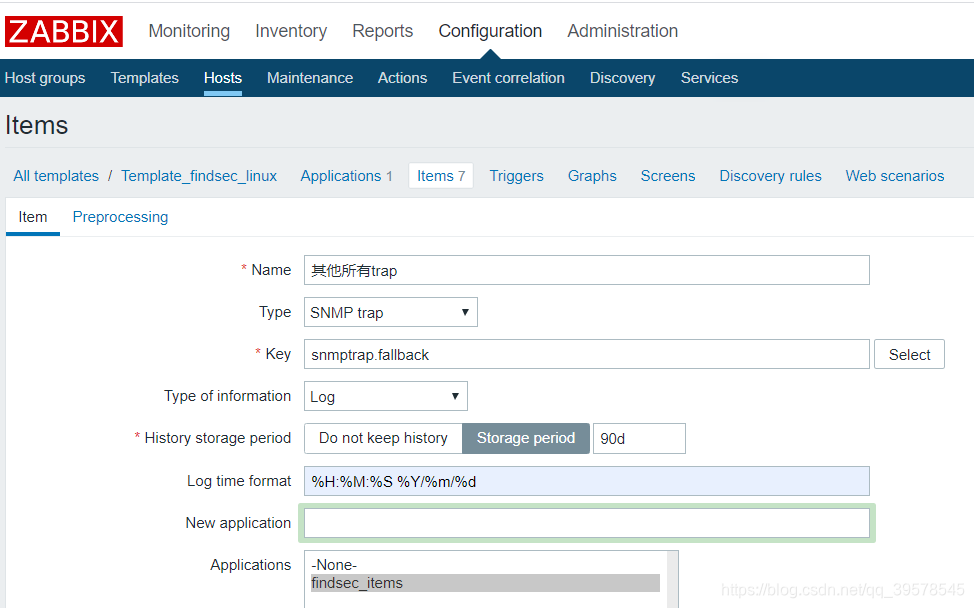
如果trap信息不匹配 findsec的话,默认就会由fallback收集处理
第三步:在客户端发送trap测试
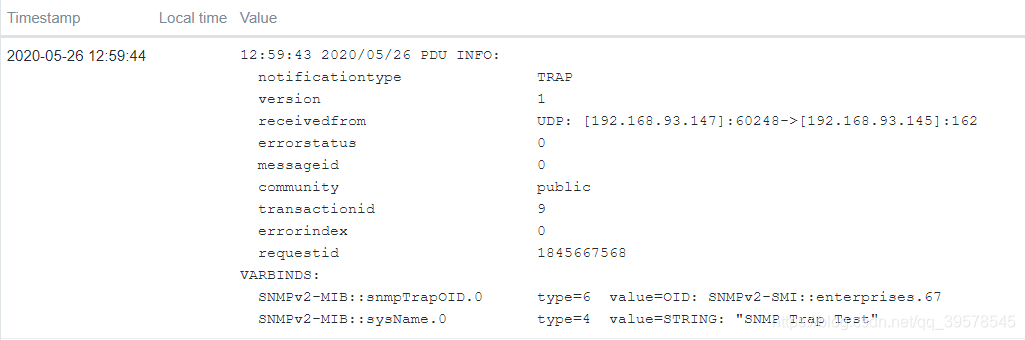
不带findsec 关键字的
[root@localhost ~]# snmptrap -v 2c -c public 192.168.93.145 “snmptraptest” ‘1.3.6.1.4.1.67’ SNMPv2-MIB::sysName.0 s “SNMP Trap Test”
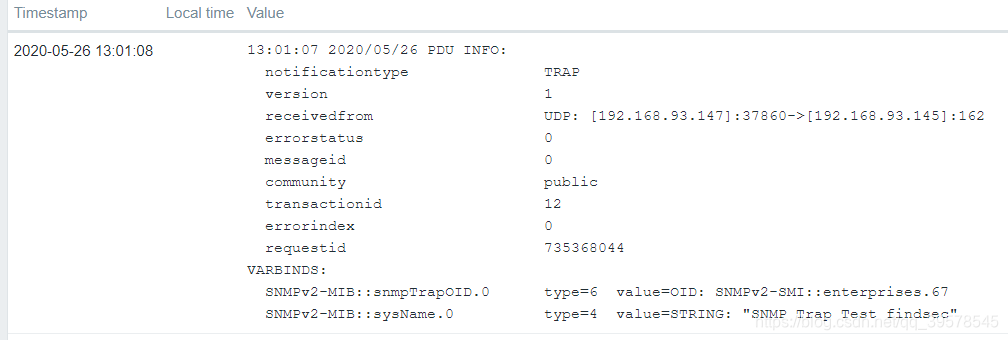
带findsec关键字的
[root@localhost ~]# snmptrap -v 2c -c public 192.168.93.145 “snmptraptest” ‘1.3.6.1.4.1.67’ SNMPv2-MIB::sysName.0 s “SNMP Trap Test findsec”

如果只想提取匹配findsec的那一行,就会用到zabbix的监控项的预处理功能
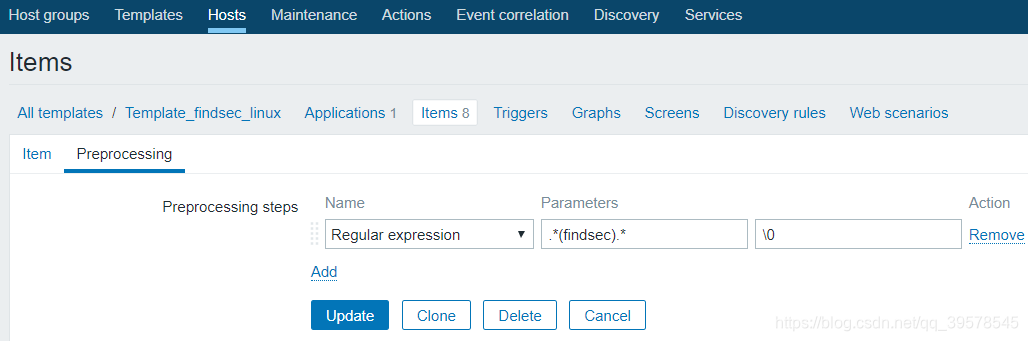
在客户端上发送几条trap信息后查看结果: