历史股价分析-python
今天,我们来讲解一个利用numpy 进行历史股价分析的实例
这里用到了一个data.csv的文件,分别有成交日期,开市价,成交最高值,成交最低值,收市价
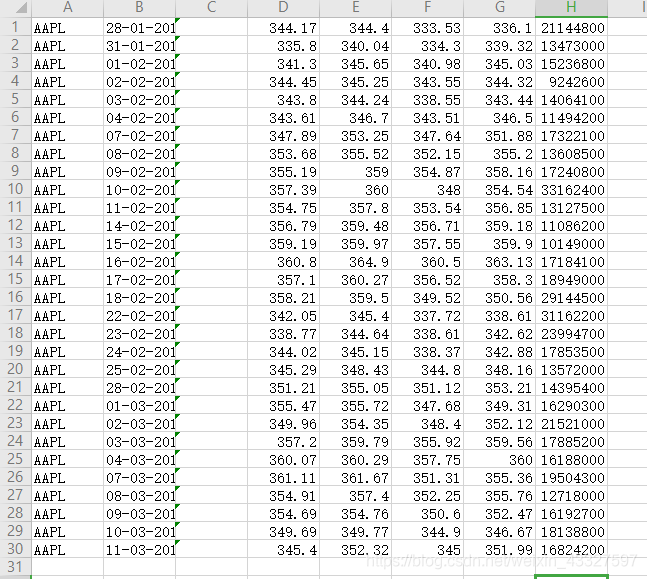
下面,我们就来对这个股票信息文件进行统计
首先我们先读取数据
###利用NumPy进行历史股价分析
import sys
#读入文件
c,v=np.loadtxt('data.csv', delimiter=',', usecols=(6,7), unpack=True)
这里就把文件的第七列数据和第八列数据赋值给c和v
下面进行相关统计量分分析
#计算成交量加权平均价格
vwap = np.average(c, weights=v)print( "VWAP =", vwap)
#算术平均值函数
print( "mean =", np.mean(c))
#时间加权平均价格
t = np.arange(len(c))
print( "twap =", np.average(c, weights=t))
#寻找成交价格最大值和最小值
h,l=np.loadtxt('data.csv', delimiter=',', usecols=(4,5), unpack=True)
print( "highest =", np.max(h))
print( "lowest =", np.min(l))
print( (np.max(h) + np.min(l)) /2)
print( "Spread high price", np.ptp(h))#求取值范围,极差,最大值减最低值
print( "Spread low price", np.ptp(l))
统计分析
求中位数和方差
#统计分析
c=np.loadtxt('data.csv', delimiter=',', usecols=(6,), unpack=True)
print( "median =", np.median(c))#求中位数,收盘价
sorted = np.msort(c)
print( "sorted =", sorted)
N = len(c)
print( "middle =", sorted[(N - 1)/2])
print( "average middle =", (sorted[N /2] + sorted[(N - 1) / 2]) / 2)
print( "variance =", np.var(c)))#方差
print( "variance from definition =", np.mean((c - c.mean())**2))#方差计算公式
股票收益率分析
#股票收益率
c=np.loadtxt('data.csv', delimiter=',', usecols=(6,), unpack=True) #收盘价
returns = np.diff( c ) / c[ : -1]#股票收益率
print( "Standard deviation =", np.std(returns))
logreturns = np.diff( np.log(c) ) #对数收益率
posretindices = np.where(returns > 0)#收易率大于0
print( "Indices with positive returns", posretindices)

annual_volatility = np.std(logreturns)/np.mean(logreturns)
annual_volatility = annual_volatility / np.sqrt(1./252.)
print( "Annual volatility", annual_volatility) #年度波动率
print( "Monthly volatility", annual_volatility * np.sqrt(1./12.))#月度波动率
日期分析
#日期分析
from datetime import datetime
# Monday 0# Tuesday 1# Wednesday 2
# Thursday 3# Friday 4# Saturday 5# Sunday 6
def datestr2num(s):
      return datetime.strptime(s, "%d-%m-%Y").date().weekday() #日期格式转换
dates, close=np.loadtxt('data.csv', delimiter=',', usecols=(1,6),
converters={1: datestr2num}, unpack=True)
print( "Dates =", dates) #将日期转换成0-6
averages = np.zeros(5)
for i in range(5):
    indices = np.where(dates == i)
    prices = np.take(close, indices)
    avg = np.mean(prices)
    print( "Day", i, "prices", prices, "Average", avg)   #求出各个工作日的收盘价,和平均收盘价
    averages[i] = avg
top = np.max(averages)
print( "Highest average", top)#最高均值
print( "Top day of the week", np.argmax(averages)) #一周中的·第几天
bottom = np.min(averages)
print( "Lowest average", bottom)#最低均值
print( "Bottom day of the week", np.argmin(averages))
周汇总
 #周汇总
def datestr2num(s):
    return datetime.strptime(s, "%d-%m-%Y").date().weekday()
dates, open, high, low, close=np.loadtxt('data.csv', delimiter=',',          usecols=(1, 3, 4, 5, 6), converters={1: datestr2num}, unpack=True)
close = close[:16]
dates = dates[:16]
# get first Monday
first_monday = np.ravel(np.where(dates == 0))[0]
print( "The first Monday index is", first_monday)
# get last Friday
last_friday = np.ravel(np.where(dates == 4))[-1]
print( "The last Friday index is", last_friday)
weeks_indices = np.arange(first_monday, last_friday + 1)
print( "Weeks indices initial", weeks_indices)
weeks_indices = np.split(weeks_indices, 3)
print( "Weeks indices after split", weeks_indices)

def summarize(a, o, h, l, c):
    monday_open = o[a[0]]
    week_high = np.max( np.take(h, a) )
    week_low = np.min( np.take(l, a) )
    friday_close = c[a[-1]]
    return("APPL", monday_open, week_high, week_low, friday_close)
weeksummary = np.apply_along_axis(summarize, 1, weeks_indices, open, high, low, close)
print( "Week summary", weeksummary) #周汇总数据,成交最高价,成交最低价

np.savetxt("weeksummary.csv", weeksummary, delimiter=",", fmt="%s")
真实波动幅度均值
#真实波动幅度均值
h, l, c = np.loadtxt('data.csv', delimiter=',', usecols=(4, 5, 6), unpack=True)
N =20
h = h[-N:]
l = l[-N:]
print( "len(h)", len(h), "len(l)", len(l))
print( "Close", c)previousclose = c[-N -1: -1]
print( "len(previousclose)", len(previousclose))
print( "Previous close", previousclose)
truerange = np.maximum(h - l, h - previousclose, previousclose - l)
print( "True range", truerange) atr = np.zeros(N) atr[0] = np.mean(truerange)
for i in range(1, N):
    atr[i] = (N - 1) * atr[i - 1] + truerange[i]
    atr[i] /= N
    print( "ATR", atr)
指数移动平均线
x = np.arange(5)
print( "Exp", np.exp(x))
print( "Linspace", np.linspace(-1, 0, 5))
N = 5  weights = np.exp(np.linspace(-1., 0., N))
weights /= weights.sum()
print( "Weights", weights)
c = np.loadtxt('data.csv', delimiter=',', usecols=(6,), unpack=True)
ema = np.convolve(weights, c)[N-1:-N+1]
t = np.arange(N - 1, len(c))
plot(t, c[N-1:], lw=1.0)
plot(t, ema, lw=2.0)
show()
布林带
#布林带
N = 5
weights = np.ones(N) / N
print( "Weights", weights)
c = np.loadtxt('data.csv', delimiter=',', usecols=(6,), unpack=True)
sma = np.convolve(weights, c)[N-1:-N+1]
deviation = []C = len(c)
for i in range(N - 1, C):   if i + N < C:
    dev = c[i: i + N]   else:
    dev = c[-N:]
    averages = np.zeros(N)
    averages.fill(sma[i - N - 1])
    dev = dev - averages
    dev = dev ** 2
    dev = np.sqrt(np.mean(dev))
    deviation.append(dev)
deviation = 2 * np.array(deviation)
print( len(deviation), len(sma))upperBB = sma + deviationlowerBB = sma - deviation c_slice = c[N-1:]
between_bands = np.where((c_slice < upperBB) & (c_slice > lowerBB))
print( lowerBB[between_bands])
print( c[between_bands])
print( upperBB[between_bands])
between_bands = len(np.ravel(between_bands))
print( "Ratio between bands", float(between_bands)/len(c_slice))
t = np.arange(N - 1, C)
plot(t, c_slice, lw=1.0)
plot(t, sma, lw=2.0)
plot(t, upperBB, lw=3.0)
plot(t, lowerBB, lw=4.0)show()
线性模型
#线性模型
N = int(sys.argv[1])
c = np.loadtxt('data.csv', delimiter=',', usecols=(6,), unpack=True)
b = c[-N:]b = b[::-1]
print( "b", b) A = np.zeros((N, N), float)
print( "Zeros N by N", A)
for i in range(N):
   A[i, ] = c[-N - 1 - i: - 1 - i]
print( "A", A)(x, residuals, rank, s) = np.linalg.lstsq(A, b)
print( x, residuals, rank, s) print( np.dot(b, x))
#趋势线
def fit_line(t, y):
   A = np.vstack([t, np.ones_like(t)]).T
   return np.linalg.lstsq(A, y)[0]
h, l, c = np.loadtxt('data.csv', delimiter=',', usecols=(4, 5, 6), unpack=True)
pivots = (h + l + c) / 3print( "Pivots", pivots)
t = np.arange(len(c))
sa, sb = fit_line(t, pivots - (h - l))
ra, rb = fit_line(t, pivots + (h - l))
support = sa * t + sb
resistance = ra * t + rb
condition = (c > support) & (c < resistance)
print( "Condition", condition)
between_bands = np.where(condition)
print( support[between_bands])
print( c[between_bands])
print( resistance[between_bands])
between_bands = len(np.ravel(between_bands))
print( "Number points between bands", between_bands)
print( "Ratio between bands", float(between_bands)/len(c) )
print( "Tomorrows support", sa * (t[-1] + 1) + sb)
print( "Tomorrows resistance", ra * (t[-1] + 1) + rb)
a1 = c[c > support]a2 = c[c < resistance]
print( "Number of points between bands 2nd approach" ,len(np.intersect1d(a1, a2)))
plot(t, c)
plot(t, support)
plot(t, resistance)show()
data.csv我上传了,可以下载练习