import seaborn as sns
import matplotlib.pyplot as plt
import numpy as np
正态分布 norm
from scipy.stats import norm
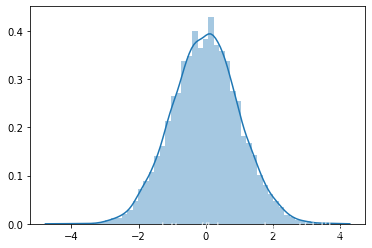
rvs 产生服从指定分布的随机数
x = norm.rvs(loc=0, scale=1, size=10000)
sns.distplot(x)
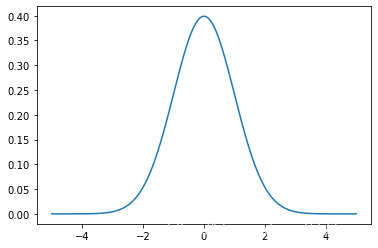
pdf 概率密度函数
norm.pdf(x=0, loc=0, scale=1)
0.3989422804014327
x = np.linspace(-5,5, 1000)
y = norm.pdf(x, loc=0, scale=1)
sns.lineplot(x,y)
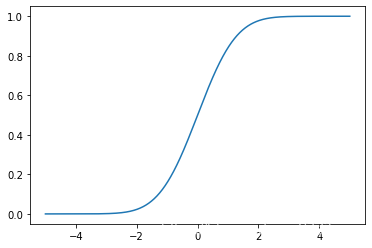
cdf 累计分布函数
norm.cdf(x=0, loc=0, scale=1)
0.5
x = np.linspace(-5,5, 1000)
y = norm.cdf(x, loc=0, scale=1)
sns.lineplot(x,y)
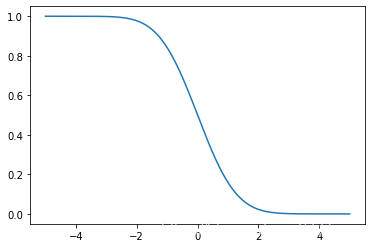
sf 残存函数(1-cdf)
x = np.linspace(-5,5, 1000)
y = norm.sf(x, loc=0, scale=1)
sns.lineplot(x,y)
ppf 下侧分位数函数(cdf的逆)
norm.ppf(q=0.975, loc=0, scale=1)
1.959963984540054
isf 上侧分位数函数(sf的逆)
norm.isf(q=0.975, loc=0, scale=1)
-1.959963984540054
其余常用分布
用法与norm大致相同
| 名称 | 含义 | |
|---|---|---|
| 0 | beta | beta分布 |
| 1 | f | F分布 |
| 2 | gamma | gam分布 |
| 3 | poisson | 泊松分布 |
| 4 | hypergeom | 超几何分布 |
| 5 | lognorm | 对数正态分布 |
| 6 | binom | 二项分布 |
| 7 | uniform | 均匀分布 |
| 8 | chi2 | 卡方分布 |
| 9 | cauchy | 柯西分布 |
| 10 | laplace | 拉普拉斯分布 |
| 11 | rayleigh | 瑞利分布 |
| 12 | t | 学生T分布 |
| 13 | norm | 正态分布 |
| 14 | expon | 指数分布 |