前言
本节学习对分类结果的评价
- 混淆矩阵
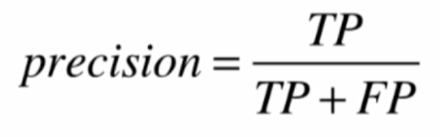
- 精确度
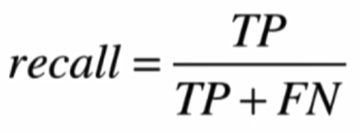
- 召回率
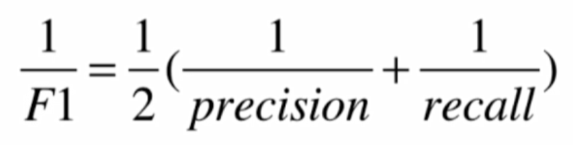
- F1
- ROC
1、原理
在数据极度偏斜的时候(skewed data)
只用分类准确度远远不够
需要有新的评价指标
-
混淆矩阵(confusion matrix)

-
精确率
-
召回率
-
F1:精准率和召回率的调和平均值
- ROC曲线:描述TPR和FPR之间的关系

具体选择哪些
具体情况具体分析
2、实现
import numpy as np
import matplotlib.pyplot as plt
from sklearn import datasets
from sklearn.model_selection import train_test_split
from sklearn.linear_model import LogisticRegression

"""实现混淆矩阵"""
# 数据
digits = datasets.load_digits()
X = digits.data
y = digits.target.copy()
# 使得数据极度偏斜
y[digits.target==9] = 1
y[digits.target!=9] = 0
X_train, X_test, y_train, y_test = train_test_split(X, y, random_state=666)
# 逻辑回归
log_reg = LogisticRegression()
log_reg.fit(X_train, y_train)
print(log_reg.score(X_test, y_test)) #准确率
y_log_predict = log_reg.predict(X_test)

# TN
def TN(y_true, y_predict):
    assert len(y_true) == len(y_predict)
    return np.sum((y_true == 0) & (y_predict == 0))
print(TN(y_test, y_log_predict))
# FP
def FP(y_true, y_predict):
    assert len(y_true) == len(y_predict)
    return np.sum((y_true == 0) & (y_predict == 1))
print(FP(y_test, y_log_predict))
# FN
def FN(y_true, y_predict):
    assert len(y_true) == len(y_predict)
    return np.sum((y_true == 1) & (y_predict == 0))
print(FN(y_test, y_log_predict))
# TP
def TP(y_true, y_predict):
    assert len(y_true) == len(y_predict)
    return np.sum((y_true == 1) & (y_predict == 1))
print(TP(y_test, y_log_predict))

# 混淆矩阵
def confusion_matrix(y_true, y_predict):
    return np.array([
        [TN(y_true, y_predict), FP(y_true, y_predict)],
        [FN(y_true, y_predict), TP(y_true, y_predict)]
    ])
print(confusion_matrix(y_test, y_log_predict))
# 精确率
def precision_score(y_true, y_predict):
    tp = TP(y_true, y_predict)
    fp = FP(y_true, y_predict)
    try:
        return tp / (tp + fp)
    except:
        return 0.0
print(precision_score(y_test, y_log_predict))
# 召回率
def recall_score(y_true, y_predict):
    tp = TP(y_true, y_predict)
    fn = FN(y_true, y_predict)
    try:
        return tp / (tp + fn)
    except:
        return 0.0
print(recall_score(y_test, y_log_predict))
# F1
def f1_score(precision, recall):
    try:
        return 2 * precision * recall / (precision + recall)
    except:
        return 0.0
print(f1_score(precision_score(y_test, y_log_predict),recall_score(y_test, y_log_predict)))
# TPR
def TPR(y_true, y_predict):
    tp = TP(y_true, y_predict)
    fn = FN(y_true, y_predict)
    try:
        return tp / (tp + fn)
    except:
        return 0.
print(TPR(y_test, y_log_predict))
# FPR
def FPR(y_true, y_predict):
    fp = FP(y_true, y_predict)
    tn = TN(y_true, y_predict)
    try:
        return fp / (fp + tn)
    except:
        return 0.
print(FPR(y_test, y_log_predict))

""" 使用scikit库实现混淆矩阵 """
# 混淆矩阵
from sklearn.metrics import confusion_matrix
confusion_matrix(y_test, y_log_predict)
# 精确率
from sklearn.metrics import precision_score
precision_score(y_test, y_log_predict)
# 召回率
from sklearn.metrics import recall_score
recall_score(y_test, y_log_predict)
# F1
from sklearn.metrics import f1_score
f1_score(y_test, y_log_predict)
# Precision-Recall曲线
from sklearn.metrics import precision_recall_curve
decision_scores = log_reg.decision_function(X_test)
precisions, recalls, thresholds = precision_recall_curve(y_test, decision_scores)
plt.plot(thresholds, precisions[:-1])
plt.plot(thresholds, recalls[:-1])
plt.show()
plt.plot(precisions, recalls)
plt.show()
# ROC
from sklearn.metrics import roc_curve
fprs, tprs, thresholds = roc_curve(y_test, decision_scores)
plt.plot(fprs, tprs)
plt.show()
# ROC_AUC,面积
from sklearn.metrics import roc_auc_score
roc_auc_score(y_test, decision_scores)
Precision-Recall曲线

ROC曲线

结语
学习了对分类结果的评价