QCustomPlot开发
01、QCustomPlot简介
QCustomPlot 是一个用于科学绘图的 QT 第三方库,可以用于常见的二维图像绘制,比如函数曲线、参数方程曲线、热力图、柱状图、箱线图、极坐标绘图等。该库由德国人 Emanuel Eichhammer 开发,经历了多次版本迭代,支持跨平台,开源遵循 GNU GPL 协议,也可以联系作者获得该库的商业许可证(Commercial License)。
1.1 帮助文档
QCustomPlot提供了在线和离线两个版本的帮助文档
- 在线版:https://www.qcustomplot.com/documentation/index.html
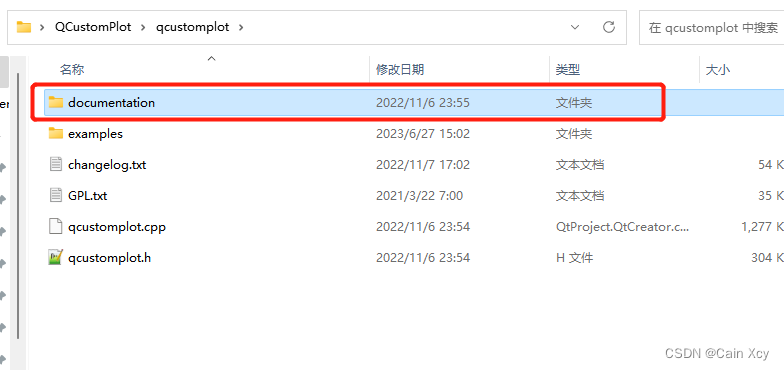
- 离线版:下载QCustomPlot压缩之后可以在里面看见,如下图:
1.2 下载&使用
QCustomPlot有开发版本和发行版本两种,开发版本适合阅读其实现思路、学习其源码的人群,GitLab地址如下:
https://gitlab.com/DerManu/QCustomPlot
如果只是为了使用其功能开发项目的话,使用其官网的发行版本使用,即可,可结合网上的学习笔记和提供的帮助文档,地址如下:
https://www.qcustomplot.com/
如果开发过程中遇到问题,网上没有找到合适的解答方式,可以前往QCustomPlot的论坛看一看,或许有你要的解决方案,地址如下:
https://www.qcustomplot.com/index.php/support/forum
关于库的使用,如果使用发行版本的话,直接下载解压,然后将里面的 qcustomplot.cpp和qcustomplot.h复制到项目文件下面即可,如下图所示:

关于QCustomPlot的简单介绍废话到这里,本章只将我项目中使用到的一些方法简单示例一下。
02、QCustomPlot项目使用笔记
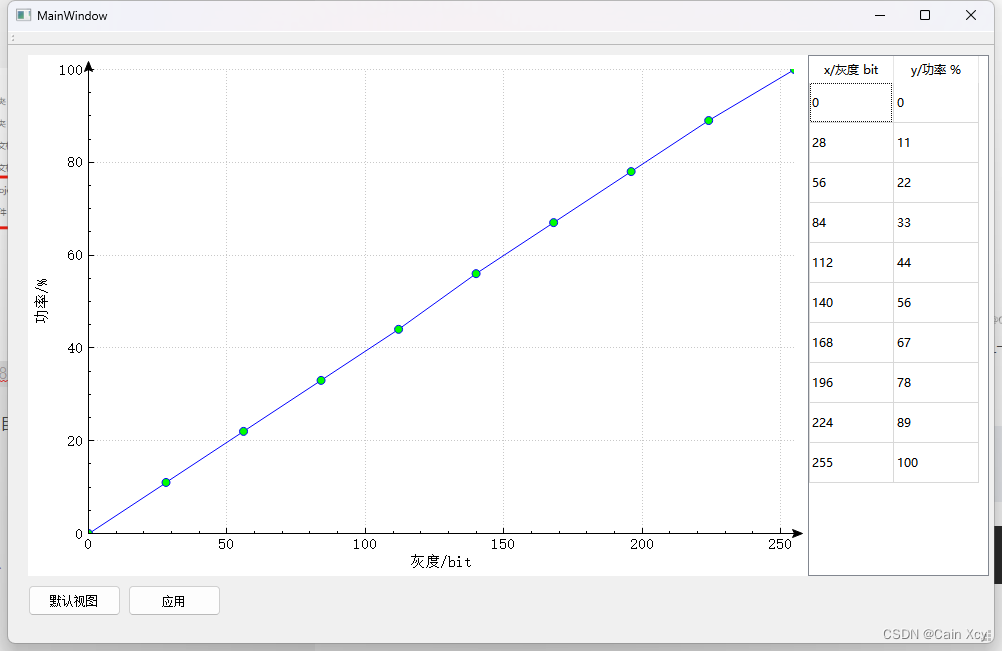
需求/功能: 实现一个功率/灰度折线图,提供操作折线、操作数据表格(QTableWidget)的一些功能。
界面如下:
// .pro文件 加上printsupport
greaterThan(QT_MAJOR_VERSION, 4): QT += widgets printsupport
2.1 创建QCustomPlot
- 坐标系
坐标系,在QCustomPlot中有一对x/y坐标系,分别以左下为原点或者以右上为原点
// 设置坐标轴的范围
ui->widget->xAxis->setRange(0,255);  // 下边
ui->widget->xAxis2->setRange(0,255); // 上边

ui->widget->yAxis->setRange(0,100);  // 左边
ui->widget->yAxis2->setRange(0,100); // 右边

// 设置X/Y标题
ui->widget->xAxis->setLabel("灰度/bit");
ui->widget->yAxis->setLabel("功率/%");

// 设置坐标轴的结束箭头
ui->widget->xAxis->setUpperEnding(QCPLineEnding::esSpikeArrow);
ui->widget->xAxis->setUpperEnding(QCPLineEnding::esSpikeArrow);
说明:
1、ui->widget 等同于 QCustomPlot,我在界面放置了一个QWidget控件,然后通过提升为的方式提升为QCustomPlot,可以参考一篇博客:QCustomPlot通过QWidge提升的方式 ,当然使用下面这种方式也是一样的效果,不过,这个时候你就要设置其大小和位置了,在布局中。
// .h
QCustomPlot* plot;

// .cpp构造函数中
plot = new QCustomPlot(this);
// 设置位置和大小
plot->setGeometry(x,y,w,h);
/*
*  参数说明:
*  x: 放置在父窗口的x坐标
*  y: 放置在父窗口的y坐标
*  w: 创建的plot宽度
*  h:创建的plot高度
*/
2、xAxis/xAxis2分别是表示X轴的上下边,yAxis/yAxis2分别表示Y轴的左右边
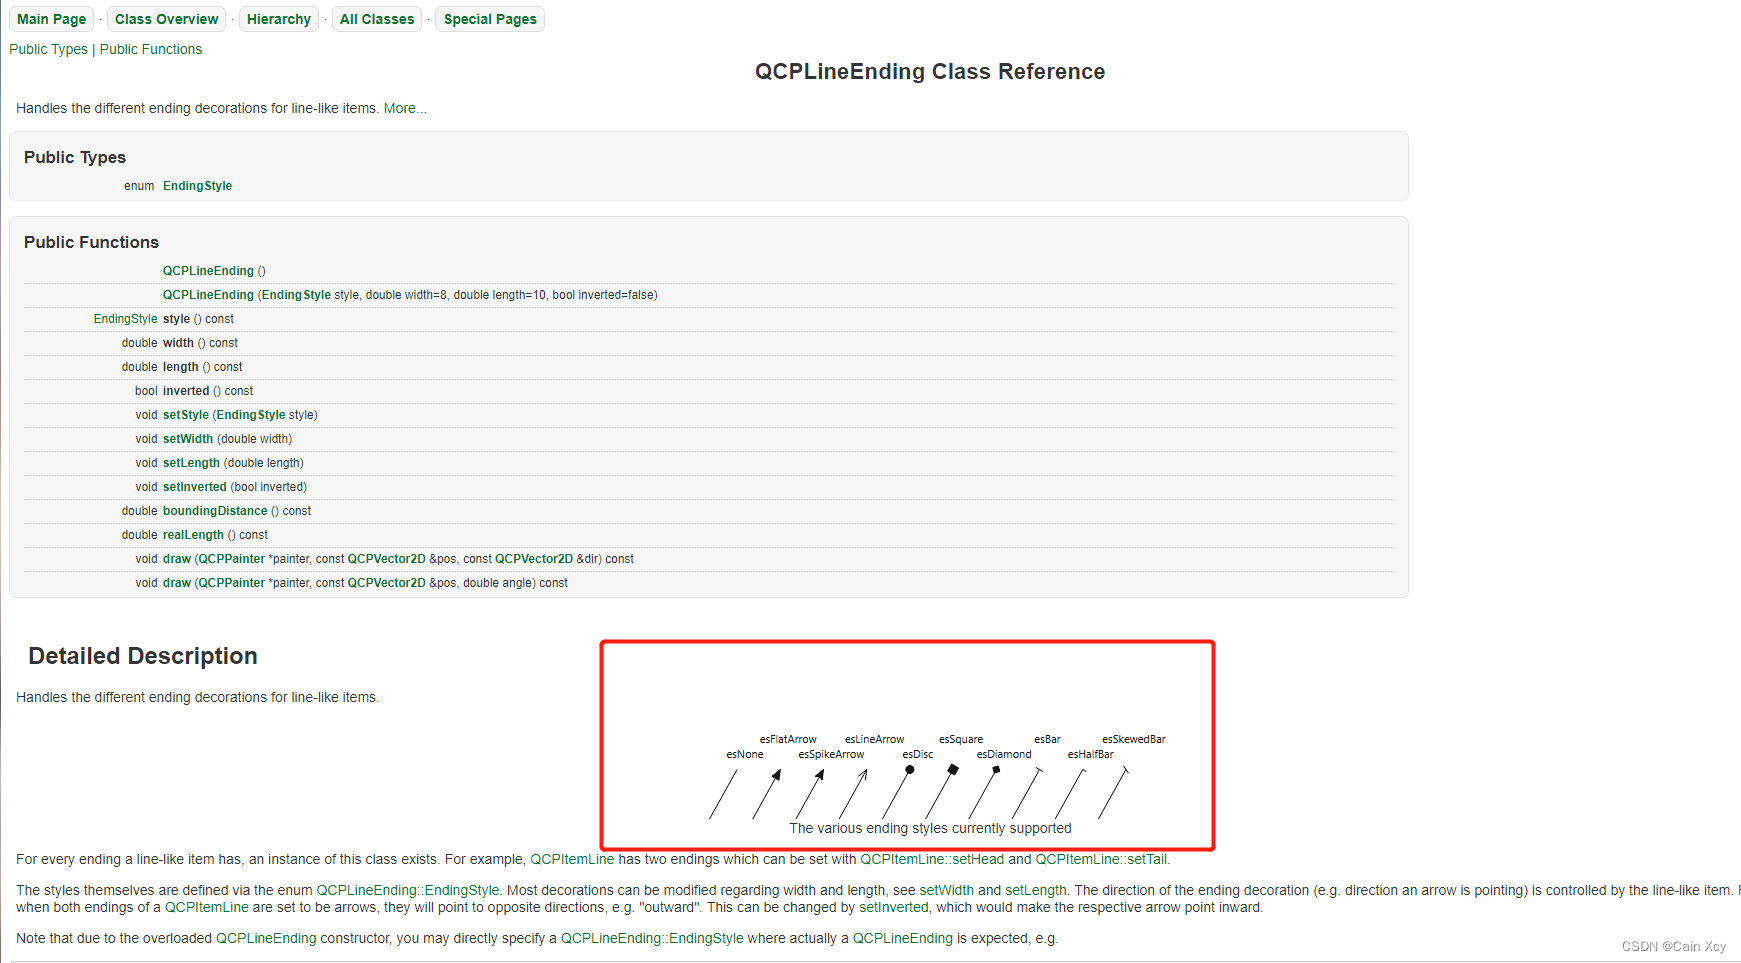
3、setUpperEnding表示设置坐标轴箭头的属性,可以参考官方文档如下图:
4、 setLabel就是设置显示在坐标轴旁边的标题。
- 图形与散点
// 添加图形
    ui->widget->addGraph(0);

    // 创建一个散点图形
    graphType = ui->widget->addGraph();
    // 设置散点样式
    QCPScatterStyle scatterStyle;
    scatterStyle.setShape(QCPScatterStyle::ssCircle);  // 圆形
    scatterStyle.setSize(8);  // 设置圆形大小为5
    scatterStyle.setBrush(Qt::green); // 设置填充颜色为绿色
    graphType->setScatterStyle(scatterStyle);  // 应用散点样式
ps: QCustom显示的线段和点都是基于一个QCPGraph图层来显示,只有添加了这个才能在这上面显示点或者线或者其他图。
// 创建n个图层
plot->addGraph(0);
plot->addGraph(1);
// ......
plot->addGraph(n);
操作的时候只需要确定是在哪个图层上更改,就可以在上面显示了。
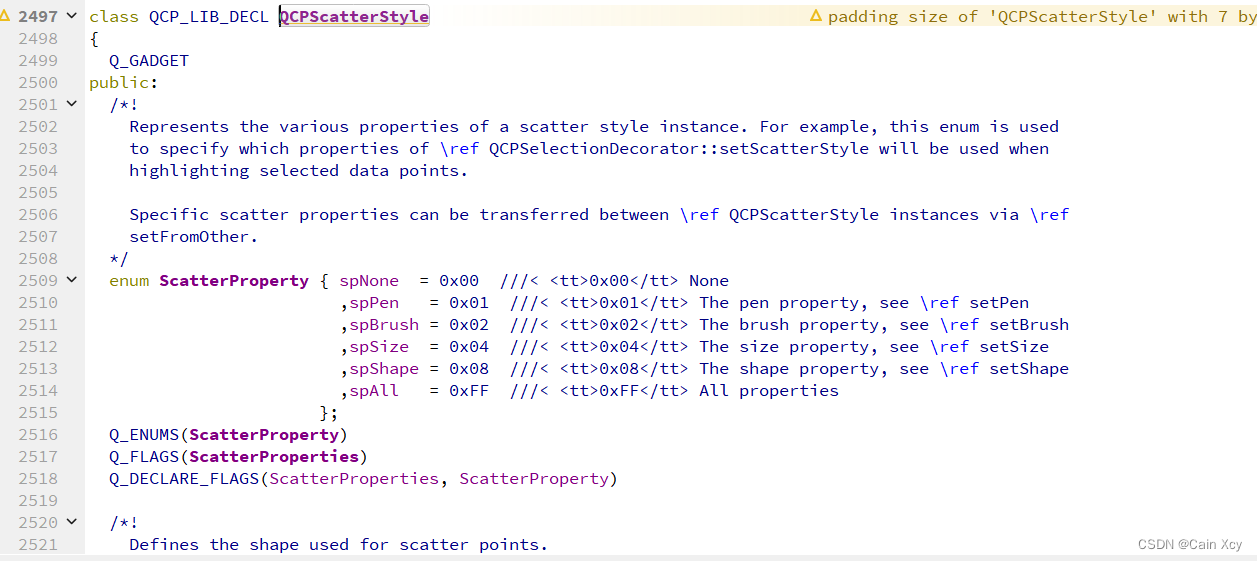
散点的操作就很多了,上面我只是使用了其中一部分,都有对应的注释,这里不再赘述,如果想了解更多可以查看这个类:
- 事件响应
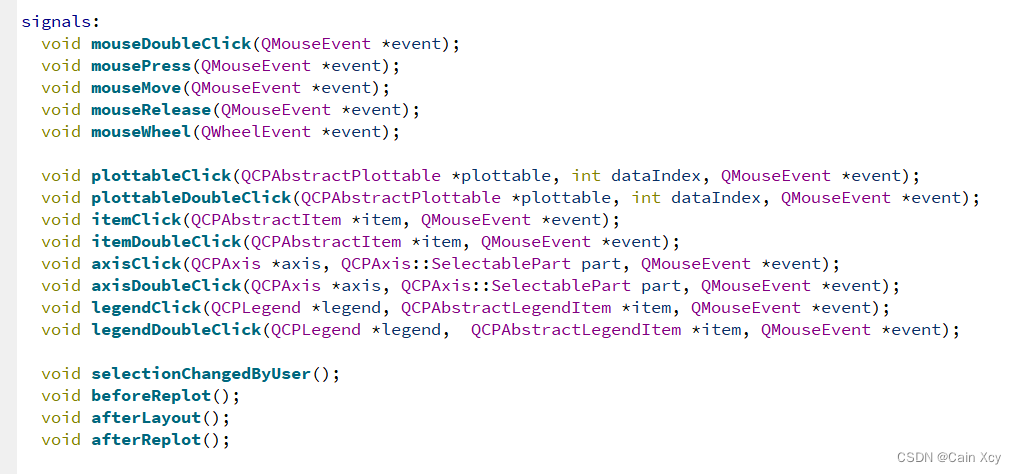
根据QCustomPlot中的信号,就能触发我们想要的操作。例如:
// 绑定鼠标双击事件
connect(ui->widget,&QCustomPlot::mouseDoubleClick,this,&MainWindow::handleDoubleClick);
// 绑定鼠标单击事件
connect(ui->widget,&QCustomPlot::mousePress,this,&MainWindow::handleMousePress);
// 绑定鼠标移动事件(需要开启鼠标追踪)
connect(ui->widget,&QCustomPlot::mouseMove,this,&MainWindow::handleMouseMove);
// 绑定鼠标释放事件
connect(ui->widget,&QCustomPlot::mouseRelease,this,&MainWindow::handleMouseRelease);
// 绑定滚轮滚动事件
connect(ui->widget,&QCustomPlot::mouseWheel,this,&MainWindow::handleMouseWheel);

// 在调用事件绑定之前开启鼠标追踪
setMouseTracking(true);
03、源代码
MainWindow.h
#ifndef MAINWINDOW_H
#define MAINWINDOW_H

#include <QMainWindow>
#include <QMouseEvent>
#include <QWheelEvent>
#include <QDebug>
#include <QVector>
#include <QMessageBox>
// 创建保存excel功能相关头文件   QAxObject需在.pro中添加QT       += axcontainer
#include <QDir>
#include <QAxObject>
#include <QVariantList>
#include <QVariantMap>

// 添加图形操作类
#include "qcustomplot.h"
#include "xlsxdocument.h"

namespace Ui {


class MainWindow;
}

#define INTPOINT int

// 自定义点结构体
typedef struct RKQPoint
{


    int point_x;
    qreal point_y;
}RKQPoint;

class MainWindow : public QMainWindow
{


    Q_OBJECT

public:
    explicit MainWindow(QWidget *parent = nullptr);
    ~MainWindow();

public:
    // 创建QCustomPlot视图
    void CreateCustomPlot();

    // 创建TabelWidget表格
    void CreateTableView();

    // 显示当前坐标点信息
    void showCurrentPointCoor(QPointF point);

    // 设置功率、灰度最大最小值
    void setGrayPowerMaxMin(int _GrayMin = 0, int _GrayMax = 255, int _PowerMin = 0, int _PowerMax = 100);

    // 获取功率、灰度最大最小值
    void getGrayPowerMaxMin(int& _GrayMin, int& _GrayMax, int& _PowerMin, int& _PowerMax);

    // 清空视图,并重新生成新的视图(用于刷新视图的时候调用)
    void clearViewOResetView();

    // 根据最大值,最小值更新表格
    void updateTableViewByGrayPowerMinMax(INTPOINT _showPoint = 10);

    // 获取灰度功率映射数据
    bool getGrayPowerVector(QVector<double>& gray, QVector<double>& power) {

     gray = GrayVec; power = PowerVec; }

    // 缩放之后,恢复默认视图的接口
    void resetView();

    /*
     *  function: 将线性数据存储进excel表格,会自动在路径下生成一个PGFile文件夹,并将excel表格数据存放其中
     *  _strFilePath: 保存文件的路径
     *  _strFileName: 保存文件名
    */
    bool saveDataToExcel(const QString _strFilePath, QString _strFileName);

    // 拖拽点逻辑(暂不启用)
    //bool dragPointForView(QMouseEvent* event);

    // 获取当前图形数据(暂不使用)
    //bool getGraphData(QVector<double>& _vecX, QVector<double>& _vecY);

    // 根据相邻点之间数值,重新计算整段功率曲线的功率分布
    bool CalcPowerValueByPAP();
    void getPAPValue(RKQPoint _first, RKQPoint _second);

    // 刷新TableWidget视图数据(暂不使用)
    //void refreshTableView();

public slots:
    void handleDoubleClick(QMouseEvent *event);
    void handleMousePress(QMouseEvent *event);
    void handleMouseMove(QMouseEvent *event);
    void handleMouseRelease(QMouseEvent *event);
    void handleMouseWheel(QWheelEvent *event);

    // 表格相关
    void modifyTablebPowerData(int row, int column);
    void cellDoubleClickFunction(int row, int column);  // 双击单元格之后触发的操作

private slots:
    void on_pushButton_resetView_clicked();

    void on_pushButton_apply_clicked();

    void on_pushButton_save_clicked();

private:
    // 功率最大值/最小值
    int m_nPowerMax;
    int m_nPowerMin;
    // 灰度最大值/最小值
    int m_nGrayMax;
    int m_nGrayMin;
    // 默认显示10个点(舍弃添加点功能)
    INTPOINT m_nNodeCount;
    // 列表显示QVector
    QVector<RKQPoint> m_showVec;
    QVector<RKQPoint> m_calcVec;
    // 数据存储的QVector,里面细分了10个点中间的所有灰度点
    QVector<RKQPoint> m_saveVec;

private:
    Ui::MainWindow *ui;
    // 添加散点
    QCPGraph* graphType;

    // 鼠标事件的状态量
    bool bPressState;
    bool bMoveState;
    bool bReleaseState;

    // 是否在点上或者点误差范围附近
    bool bPointOK;

    //  拖动点操作的坐标记录
    QPointF pressPoint;
    QPoint releasePoint;

    // 区分单击与双击事件的执行逻辑,释放按理想状态执行
    QDateTime firstPressTime;  // 第一次单击的时间
    QDateTime secondPressTime; // 第二次单击的时间
    bool bPressStateTRUE;

    QDateTime releaseTime;  // 释放的时间

    // 图形对象数据存储
    QVector<double> GrayVec;
    QVector<double> PowerVec;
    // 实际数据写入
    QVector<RKQPoint> pointData;
};

#endif // MAINWINDOW_H
MainWindow.cpp
#include "mainwindow.h"
#include "ui_mainwindow.h"

MainWindow::MainWindow(QWidget *parent) :
    QMainWindow(parent),
    m_nNodeCount(10),
    bPressState(false),
    bMoveState(false),
    bReleaseState(true),
    bPointOK(false),
    bPressStateTRUE(true),
    ui(new Ui::MainWindow)
{


    ui->setupUi(this);

    // 设置参数
    setGrayPowerMaxMin();

    // 鼠标追踪启用
    setMouseTracking(true);
    // 创建plot
    CreateCustomPlot();
    // 创建表格
    CreateTableView();
}

MainWindow::~MainWindow()
{


    delete ui;
}

void MainWindow::CreateCustomPlot()
{


    // 设置横坐标轴的范围
    ui->widget->xAxis->setRange(0,255);
    // 设置纵坐标轴的范围
    ui->widget->yAxis->setRange(0,100);

    // 设置坐标轴结束箭头
    ui->widget->xAxis->setUpperEnding(QCPLineEnding::esSpikeArrow);
    ui->widget->yAxis->setUpperEnding(QCPLineEnding::esSpikeArrow);

    // 设置X/Y标题
    ui->widget->xAxis->setLabel("灰度/bit");
    ui->widget->yAxis->setLabel("功率/%");

    // 添加图形
    ui->widget->addGraph(0);

    // 创建一个散点图形
    graphType = ui->widget->addGraph();
    // 设置散点样式
    QCPScatterStyle scatterStyle;
    scatterStyle.setShape(QCPScatterStyle::ssCircle);  // 圆形
    scatterStyle.setSize(8);  // 设置圆形大小为5
    scatterStyle.setBrush(Qt::green); // 设置填充颜色为绿色
    graphType->setScatterStyle(scatterStyle);  // 应用散点样式

    // 设置可以缩放,对应鼠标滚轮
    ui->widget->setInteraction(QCP::iRangeZoom);

//    ui->widget->setInteractions(QCP::iRangeDrag | QCP::iRangeZoom | QCP::iSelectAxes |
//                                QCP::iSelectLegend | QCP::iSelectPlottables);

    // 使用OpenGL绘制
//    ui->widget->setOpenGl(true);

    // 绑定图形操作函数
    connect(ui->widget,&QCustomPlot::mouseDoubleClick,this,&MainWindow::handleDoubleClick);
    connect(ui->widget,&QCustomPlot::mousePress,this,&MainWindow::handleMousePress);
    connect(ui->widget,&QCustomPlot::mouseMove,this,&MainWindow::handleMouseMove);
    connect(ui->widget,&QCustomPlot::mouseRelease,this,&MainWindow::handleMouseRelease);
    connect(ui->widget,&QCustomPlot::mouseWheel,this,&MainWindow::handleMouseWheel);
}

void MainWindow::CreateTableView()
{


    ui->tableWidget->setColumnCount(2);  // 设置2列
    ui->tableWidget->setRowCount(10);   // 设置256行

    // 设置表头内容
    QStringList header;
    header<< "x/灰度 bit" << "y/功率 %";
    ui->tableWidget->setHorizontalHeaderLabels(header);

    // 设置内容显示宽高
    ui->tableWidget->horizontalHeader()->setDefaultSectionSize(85);
    ui->tableWidget->verticalHeader()->setDefaultSectionSize(40);

    // 去掉第一列的序列号
    ui->tableWidget->verticalHeader()->setVisible(false);

    // 设置水平滚动条的样式
    ui->tableWidget->horizontalScrollBar()->setStyleSheet("QScrollBar{background:transparent; height:12px;}"
                                                          "QScrollBar::handle{background:lightgray; border:2px solid transparent; border-radius:5px;}"
                                                          "QScrollBar::handle:hover{background:gray;}"
                                                          "QScrollBar::sub-line{background:transparent;}"
                                                          "QScrollBar::add-line{background:transparent;}");

    // 设置垂直滚动条的样式
    ui->tableWidget->verticalScrollBar()->setStyleSheet("QScrollBar{background:transparent; width: 12px;}"
                                                        "QScrollBar::handle{background:lightgray; border:2px solid transparent; border-radius:5px;}"
                                                        "QScrollBar::handle:hover{background:gray;}"
                                                        "QScrollBar::sub-line{background:transparent;}"
                                                        "QScrollBar::add-line{background:transparent;}");

    // 奇偶行底色不同(暂不使用)
    //    QPalette pal;
    //    pal.setColor(QPalette::Base, QColor(120, 120, 120));
    //    pal.setColor(QPalette::AlternateBase, QColor(100, 100, 100));
    //    ui->tableWidget->setPalette(pal);
    //    ui->tableWidget->setAlternatingRowColors(true);

    updateTableViewByGrayPowerMinMax();

    // 与图形界面相关的操作
    connect(ui->tableWidget,&QTableWidget::cellChanged,this,&MainWindow::modifyTablebPowerData);
    connect(ui->tableWidget,&QTableWidget::cellDoubleClicked,this,&MainWindow::cellDoubleClickFunction);
}

void MainWindow::showCurrentPointCoor(QPointF point)
{


    QString str = QString("灰度: " + QString::number(point.x()) + "bit" + "\n功率: " + QString::number(point.y()) + "%");

    QToolTip::showText(cursor().pos(),str,ui->widget);

    // 添加到视图中显示  QCPItemText默认是不可见的
    ui->widget->replot();
}

void MainWindow::setGrayPowerMaxMin(int _GrayMin, int _GrayMax, int _PowerMin, int _PowerMax)
{


    // 异常错误
    if(_GrayMin < 0 || _GrayMax > 255 || _PowerMin < 0 || _PowerMax > 100) {


        QMessageBox::information(this,QStringLiteral("错误信息"),QStringLiteral("灰度范围0~255,功率范围0~100,请检查错误!"));
        return;
    }

    m_nGrayMin = _GrayMin;
    m_nGrayMax = _GrayMax;
    m_nPowerMin = _PowerMin;
    m_nPowerMax = _PowerMax;
}

void MainWindow::getGrayPowerMaxMin(int &_GrayMin, int &_GrayMax, int &_PowerMin, int &_PowerMax)
{


    _GrayMin = m_nGrayMin;
    _GrayMax = m_nGrayMax;
    _PowerMin = m_nPowerMin;
    _PowerMax = m_nPowerMax;
}

void MainWindow::clearViewOResetView()
{


    ui->widget->clearGraphs(); // 清空所有存在的视图

    // 创建一个散点图形
    graphType = ui->widget->addGraph();

    // 重新生成并设置样式,否则调用会报错
    graphType = ui->widget->addGraph();

    // 设置散点样式
    QCPScatterStyle scatterStyle;
    scatterStyle.setShape(QCPScatterStyle::ssCircle);  // 圆形
    scatterStyle.setSize(8);  // 设置圆形大小为5
    scatterStyle.setBrush(Qt::green); // 设置填充颜色为绿色
    graphType->setScatterStyle(scatterStyle);  // 应用散点样式

    // 设置可以缩放,对应鼠标滚轮
    ui->widget->setInteraction(QCP::iRangeZoom);
}

void MainWindow::updateTableViewByGrayPowerMinMax(int _showPoint)
{


    m_showVec.clear();  // 清空视图刷新的数据
    m_calcVec.clear();
    RKQPoint point;  // 定义点结构体

    int GrayDiff = m_nGrayMax - m_nGrayMin;
    int PowerDiff = m_nPowerMax - m_nPowerMin;

    int GrayStep;
    qreal PowerStep;
    // 初始化显示点数据
    if(_showPoint == 10) {


        GrayStep = GrayDiff / (_showPoint - 1);
        PowerStep = (double)PowerDiff / (_showPoint - 1);
    } else {


        //预留,以后showPoint不为10的时候处理数据
    }

    QString yDoubleString;
    int tmpPowerMin = m_nPowerMin; // 临时存储
    int tmpPowerMax = m_nPowerMax;
    for(int i = 0; i < _showPoint; i++) {


        if(m_nGrayMax == 255 && m_nPowerMax == 100)
        {


            if(i == (_showPoint - 1)) {


                // 最后一个,灰度直接为255,因为整除不一定能刚好达到255
                point.point_x = m_nGrayMax;
                // double类型,转换精度
                yDoubleString = QString::number((double)tmpPowerMax, 'f', 2);
                point.point_y = yDoubleString.toDouble();
                m_showVec.push_back(point);
                break;
            }
        }

        point.point_x = m_nGrayMin + GrayStep * i;
        yDoubleString = QString::number(round(tmpPowerMin + (PowerStep * i)), 'f', 2);
        point.point_y = yDoubleString.toDouble();
        m_showVec.push_back(point);
        m_calcVec.push_back(point);
    }

    clearViewOResetView();

    // 显示数据点
    int nCount = 0;
    for(RKQPoint tmp : m_showVec) {


        // 直接插入值,一个一个插入
        QTableWidgetItem* item1 = new QTableWidgetItem(tr("%1").arg(tmp.point_x));
        ui->tableWidget->setItem(nCount,0,item1);

        QTableWidgetItem* item2 = new QTableWidgetItem(tr("%1").arg(tmp.point_y));
        item2->setFlags(item2->flags() & ~Qt::ItemIsEditable);  // 功率不可编辑
        ui->tableWidget->setItem(nCount,1,item2);

        graphType->addData(tmp.point_x,tmp.point_y);

        nCount++;
    }

    // 重绘图形
    ui->widget->replot();

    CalcPowerValueByPAP();  // 执行完之后,计算所有点,存储
}

//bool MainWindow::dragPointForView(QMouseEvent* event)
//{


//    QPoint tmp = event->pos();
//    // 转换坐标系
//    double x = ui->widget->xAxis->pixelToCoord(tmp.x());
//    double y = ui->widget->yAxis->pixelToCoord(tmp.y());
//    // 记录松开鼠标的坐标
//    releasePoint.setX(x);
//    releasePoint.setY(y);

//    // 1、先获取数据存储
//    bool bRet = getGraphData(GrayVec,PowerVec);
//    if(!bRet) {


//        QMessageBox::information(this,QStringLiteral("错误信息"),QStringLiteral("获取存储数据失败"));
//        return false;
//    }

//    if(!bPressState && !bReleaseState && !bPointOK) {


//        // 2、获取要修改点的索引
//        int index = -1;
//        index = GrayVec.indexOf(pressPoint.x());
//        if(index == -1) {


//            QMessageBox::information(this,QStringLiteral("错误信息"),QStringLiteral("获取索引失败"));
//            return false;
//        }

//        // 3、修改图形数据
//        GrayVec[index] = releasePoint.x();
//        PowerVec[index] = releasePoint.y();

//        // 4、更新视图和数据
//        graphType->setData(GrayVec,PowerVec);
//        ui->widget->replot();
//    }

//    return true;
//}

//bool MainWindow::getGraphData(QVector<double>& _vecX, QVector<double>& _vecY)
//{


//    // 清空
//    _vecX.clear();
//    _vecY.clear();
//    // 创建图形中间层迭代器
//    QCPGraphDataContainer::const_iterator it = graphType->data()->begin();

//    if(graphType->dataCount() <= 0) {


//        return false;
//    }

//    for(it; it != graphType->data()->end(); ++it) {


//        double grayValue = it->key;
//        double powerValue = it->value;
//        // 添加进入数据存储器
//        _vecX.push_back(grayValue);
//        _vecY.push_back(powerValue);
//    }

//    return true;
//}

void MainWindow::resetView()
{


    ui->widget->xAxis->setRange(0,255);
    ui->widget->yAxis->setRange(0,100);
    ui->widget->replot();
}

bool MainWindow::saveDataToExcel(const QString _strFilePath, QString _strFileName)
{


    // 检查路径下是否存在PGFile文件夹,存在则跳过,不存在就创建
    QString folderPath = _strFilePath + QString("/PGFile");
    qDebug()<< folderPath;

    // 创建QDir对象
    QDir dir;

    // 检查文件夹是否存在
    if(dir.exists(folderPath)) {


        qDebug()<< "文件夹已存在,跳过,请忽略错误";
    } else {


        // 尝试创建文件夹
        if(dir.mkpath(folderPath)) {


            // success
        } else {


            QMessageBox::information(this,QStringLiteral("错误提示"),QStringLiteral("PGFile文件夹创建失败"));
            return false;
        }
    }

    // 创建excel文件名
    QString excelName = folderPath + QString("/") + _strFileName;

#if 1   // 使用xlsx可以不依赖wps或者office,但是QAxObject依赖,并且很卡顿
    // 创建xlsx文件
    QXlsx::Document xlsx;

    RKQPoint writePoint;
    // 遍历需要写入的文件
    for(int i = 0; i < m_saveVec.size(); i++) {


        // 创建A行
        QString aString = QString("A%1").arg(i+1);
        xlsx.write(aString, m_saveVec[i].point_x);

        // 创建B行
        QString bString = QString("B%1").arg(i+1);
        xlsx.write(bString, m_saveVec[i].point_y);
    }

    // 写入excel文件
    xlsx.saveAs(excelName);
#else
    // 创建Excel应用对象
    QAxObject* excel = new QAxObject("Excel.Application");
    if(excel) {


        // 打开Excel文件
        QAxObject* workBooks = excel->querySubObject("workBooks");
        QAxObject* workBook = workBooks->querySubObject("Open(const QString&)",excelName);

        if(workBook) {


            // 获取第一个工作表
            QAxObject* workSheets = workBook->querySubObject("workSheets");
            QAxObject* workSheet = workSheets->querySubObject("Item(int)",1);

            if(workSheet) {


                // 将数据转换为QVariantList和QVariantMap
                QVariantList rows;
                for(int i = 0; i < m_saveVec.size(); ++i) {


                    QVariantMap row;
                    row["Gray"] = m_saveVec[i].point_x;
                    row["Power"] = m_saveVec[i].point_y;
                    rows.append(row);
                }

                // 写入数据到Excel表
                for(int n = 0; n < m_saveVec.size(); ++n) {


                    QAxObject* range = workSheet->querySubObject("Cells(int,int)",n+1, 1);
                    range->dynamicCall("SetValue(const QVariant&)",m_saveVec[n].point_x);
                    delete range;

                    range = workSheet->querySubObject("Cells(int,int)",n+1, 2);
                    range->dynamicCall("SetValue(const QVariant&)",m_saveVec[n].point_y);
                    delete range;
                }

                // 保存Excel文件
                workBook->dynamicCall("SaveAs(const QString&)",excelName);

                workSheet->dynamicCall("Activate()");
                workBook->dynamicCall("Close()");
                excel->dynamicCall("Quit()");

                delete workSheet;
                delete workSheets;
                delete workBook;
            }
        }

        delete workBooks;
        delete excel;
    }
#endif

    qDebug()<< "保存成功!";
    return true;
}

bool MainWindow::CalcPowerValueByPAP()
{


    /*
    * 此函数会计算GrayMin~GrayMax和PowerMin~PowerMax之间界面上显示Point数目统计段数,根据段数
    * 线性分配两点之间的具体功率数值,然后存储到指定vector中,假设我们点与点
    * 之间所有的功率线段都是均分(暂不考虑实际情况)
    */

    m_saveVec.clear();  // 先清空,防止上一次的数据干扰这一次的校正数据

    int nStage = graphType->dataCount() - 1; // 实际的段数
    qDebug()<< "nStage: " << nStage;
    int nCount = 0;  // 初始计数

    // 获取图形坐标点数据
//    QVector<RKQPoint> points;
//    for(int i = 0; i < m_showVec.size(); i++) {


//        RKQPoint tmp;
//        tmp.point_x = m_showVec[i].point_x;
//        qDebug()<< "tmp.point_x: " << tmp.point_x;
//        tmp.point_y = m_showVec[i].point_y;
//        qDebug()<< "tmp.point_y: " << tmp.point_y;
//        points.push_back(tmp);
//    }

    for(int i = 0; i < m_calcVec.size()-1; i++) {


        // 获取每一段的首尾点进行线性运算
        RKQPoint firstPoint,secondPoint;
        firstPoint = m_calcVec[i];
        qDebug()<< "m_showVec_firstPoint.x: " << m_calcVec[i].point_x << "m_showVec_firstPoint.y: " << m_calcVec[i].point_y;
        secondPoint = m_calcVec[i+1];
        qDebug()<< "m_showVec_secondPoint.x: " << m_calcVec[i+1].point_x << "m_showVec_secondPoint.y: " << m_calcVec[i+1].point_y;
        qDebug()<< "\n\n";
        getPAPValue(firstPoint,secondPoint);
    }

    /*  暂不刷新,table只显示10个节点
    // 执行完成,刷新table列表
    refreshTableView();*/
}

void MainWindow::getPAPValue(RKQPoint _first, RKQPoint _second)
{


    qreal fx = _first.point_x;
    qreal fy = _first.point_y;
    qreal sx = _second.point_x;
    qreal sy = _second.point_y;
    // 获取处理后的数值
    int nFx = (int)fx;
    int nSx = (int)sx;
    int nCount = 0;

    int averageNum = nSx - nFx; // 均值个数
    qreal diffValue = sy - fy;  // 差值(有可能为负数)
    // 转化为2位有效小数
    qreal tmpValue = diffValue / averageNum;
    QString meanValueString = QString::number(tmpValue, 'f', 2);
    qreal meanValue = meanValueString.toFloat();

    RKQPoint tmpPoint;

    for(int i = nFx; i <= nSx; i++,nCount++) {


        qreal tmp_y = fy + (nCount * meanValue);
        QString tmp_yS = QString::number(tmp_y, 'f', 2);
        tmpPoint.point_x = nFx + nCount;
        tmpPoint.point_y = tmp_yS.toFloat();
        m_saveVec.push_back(tmpPoint);
    }
}

//void MainWindow::refreshTableView()
//{


//    ui->tableWidget->clear();  // 先清空列表
//    // 设置表头内容
//    QStringList header;
//    header<< "x/灰度 bit" << "y/功率 %";
//    ui->tableWidget->setHorizontalHeaderLabels(header);

//    for(int i = 0; i < pointData.size(); i++) {


//        // 刷新第一列
//        QTableWidgetItem* item = new QTableWidgetItem(tr("%1").arg(pointData[i].point_x));
//        item->setFlags(item->flags() & ~Qt::ItemIsEditable);  // 清除单元格的可编辑标志
//        ui->tableWidget->setItem(i,0,item);

//        QTableWidgetItem* item2 = new QTableWidgetItem(tr("%1").arg(pointData[i].point_y));
//        ui->tableWidget->setItem(i,1,item2);
//    }
//}

void MainWindow::handleDoubleClick(QMouseEvent *event)
{


//    // 获取鼠标双击事件的坐标
//    QPoint pos = event->pos();

//    // 将坐标转换为图形坐标系的坐标
//    double x = ui->widget->xAxis->pixelToCoord(pos.x());
//    double y = ui->widget->yAxis->pixelToCoord(pos.y());

//    graphType->addData(x,y);

//    // 重绘图形
//    ui->widget->replot();
}

void MainWindow::handleMousePress(QMouseEvent *event)
{


//    if(firstPressTime.isNull()) {


//        // 第一次单击
//        firstPressTime = QDateTime::currentDateTime();
//    } else {


//        // 第二次单击
//        secondPressTime = QDateTime::currentDateTime();
//        qint64 interval = firstPressTime.msecsTo(secondPressTime);
//        if(interval <= 500) {


//            bPressStateTRUE = false;  // false: 双击  true: 单击
//            return;
//        }

//        // 重置第一次单击的时间和次数
//        firstPressTime = QDateTime();
//    }

//    // 状态量转换
//    bPressState = true;
//    bReleaseState = true;

//    QPoint currentPos = event->pos();
//    // 转换为图形坐标
//    double curX = ui->widget->xAxis->pixelToCoord(currentPos.x());
//    double curY = ui->widget->yAxis->pixelToCoord(currentPos.y());

//    QPointF point;

//    // 遍历所有存在的散点,判断是否当前坐标与散点坐标重叠,重叠则表示在散点上
//    QCPDataContainer<QCPGraphData>::const_iterator it;
//    double epsilon = 0.5f;  // 允许存在的误差范围

//    for(it = graphType->data()->begin(); it != graphType->data()->end(); ++it) {


//        double x = it->key;
//        double y = it->value;

//        point.setX(x);
//        point.setY(y);

//        if(qAbs(curX - x) <= epsilon || qAbs(curY - y) <= epsilon) {


//            // 在点上方
//            showCurrentPointCoor(point);
//            bPointOK = true;  // 将点状态转换
//            pressPoint = point;  // 获取拉点前的坐标
//        } else {


//           // 不在散点上方,TODO: 暂不处理
//        }
//    }
}

void MainWindow::handleMouseMove(QMouseEvent *event)
{


    bMoveState = true;
    QPoint mousePos = event->pos();

    QCPAbstractPlottable* plottable = ui->widget->plottableAt(mousePos);
    // 转换为图形坐标
    double curX = ui->widget->xAxis->pixelToCoord(mousePos.x());
    double curY = ui->widget->yAxis->pixelToCoord(mousePos.y());

    QPointF point;

    // 遍历所有存在的散点,判断是否当前坐标与散点坐标重叠,重叠则表示在散点上
    QCPDataContainer<QCPGraphData>::const_iterator it;
    double epsilon = 0.9f;  // 允许存在的误差范围

    for(it = graphType->data()->begin(); it != graphType->data()->end(); ++it) {


        double x = it->key;
        double y = it->value;

        point.setX(x);
        point.setY(y);

        if((qAbs(curX - x) <= epsilon || qAbs(curY - y) <= epsilon ) && plottable) {


            // 在点上方
            showCurrentPointCoor(point);
//            bPointOK = true;  // 将点状态转换
//            pressPoint = point;  // 获取拉点前的坐标
//            // 状态量转换
//            bPressState = true;
//            bReleaseState = true;
        } else {


           // 不在散点上方,TODO: 暂不处理
//            // 状态量转换
//            bPressState = false;
//            bReleaseState = false;
        }
    }
}

void MainWindow::handleMouseRelease(QMouseEvent *event)
{


//    releaseTime = QDateTime::currentDateTime();
//    qint64 val = firstPressTime.msecsTo(releaseTime);
//    bReleaseState = false;
//    bPressState = false;
//    bPointOK = false;

//    if(val <= 300 || !bPressStateTRUE) {


//        // 双击不予理会,直接退出
//        return;
//    }

//    if(!dragPointForView(event)) {


//        return;
//    } else {


//        // 我们认为点与点之间都是均分的,所以,点与点之间的数值要重新分配(QVector)
//        CalcPowerValueByPAP();
//    }
}

void MainWindow::handleMouseWheel(QWheelEvent *event)
{


}

void MainWindow::modifyTablebPowerData(int row, int column)
{


    QString modifiedData;
    QTableWidgetItem* item = ui->tableWidget->item(row,column);
    if(item) {


        // 获取修改后的数据
        modifiedData = item->text();
    }

    // 获取当前行对应的序列
    for(int i = 0; i < m_showVec.size(); i++) {


        if(i == row) {


            m_showVec[i].point_x = modifiedData.toFloat();
//            CalcPowerValueByPAP();
            return;
        }
    }
}

void MainWindow::cellDoubleClickFunction(int row, int column)
{


}

void MainWindow::on_pushButton_resetView_clicked()
{


    resetView();
}

void MainWindow::on_pushButton_apply_clicked()
{


    // test apply gray、power newData
    setGrayPowerMaxMin(40,220,30,90);
    updateTableViewByGrayPowerMinMax();  // 更新视图和plot
}

void MainWindow::on_pushButton_save_clicked()
{


    // 获取exe路径
    QString exePath = QCoreApplication::applicationFilePath();
    exePath.remove(exePath.lastIndexOf("/"), exePath.length() - exePath.lastIndexOf("/"));
    QString fileName("2023_07_07.xlsx");

    bool bRet = saveDataToExcel(exePath,fileName);
    if(!bRet) {


        qDebug()<< "error";
    } else {


        qDebug()<< "on_pushButton_save_clicked successful";
    }
}
.pro文件
#-------------------------------------------------
#
# Project created by QtCreator 2023-07-03T14:36:06
#
#-------------------------------------------------

QT       += core gui axcontainer xlsx

greaterThan(QT_MAJOR_VERSION, 4): QT += widgets printsupport

DEFINES += QCUSTOMPLOT_USE_OPENGL

LIBS += -lopengl32

TARGET = Demp
TEMPLATE = app

# The following define makes your compiler emit warnings if you use
# any feature of Qt which has been marked as deprecated (the exact warnings
# depend on your compiler). Please consult the documentation of the
# deprecated API in order to know how to port your code away from it.
DEFINES += QT_DEPRECATED_WARNINGS

# You can also make your code fail to compile if you use deprecated APIs.
# In order to do so, uncomment the following line.
# You can also select to disable deprecated APIs only up to a certain version of Qt.
#DEFINES += QT_DISABLE_DEPRECATED_BEFORE=0x060000    # disables all the APIs deprecated before Qt 6.0.0

CONFIG += c++11

SOURCES += \
        main.cpp \
        mainwindow.cpp \
        qcustomplot.cpp

HEADERS += \
        mainwindow.h \
        qcustomplot.h

FORMS += \
        mainwindow.ui

# Default rules for deployment.
qnx: target.path = /tmp/$${

    TARGET}/bin
else: unix:!android: target.path = /opt/$${

    TARGET}/bin
!isEmpty(target.path): INSTALLS += target