- 了解volatility
1.Linux Memory Extractor 参考此链接
A Loadable Kernel Module (LKM) which allows for volatile memory acquisition from Linux and Linux-based devices, such as Android. This makes LiME unique as it is the first tool that allows for full memory captures on Android devices. It also minimizes its interaction between user and kernel space processes during acquisition, which allows it to produce memory captures that are more forensically sound than those of other tools designed for Linux memory acquisition.
调试步骤:
~/Documents/work/code/LiME/src$ make
make -C /lib/modules/4.19.37/build M="/home/Documents/work/code/LiME/src" modules
make[1]: Entering directory `/home/Documents/work/code/linux/linux-4.19.37'
  CC [M]  /home/Documents/work/code/LiME/src/tcp.o
  CC [M]  /home/Documents/work/code/LiME/src/disk.o
  CC [M]  /home/Documents/work/code/LiME/src/main.o
  CC [M]  /home/Documents/work/code/LiME/src/hash.o
  CC [M]  /home/Documents/work/code/LiME/src/deflate.o
  LD [M]  /home/Documents/work/code/LiME/src/lime.o
  Building modules, stage 2.
  MODPOST 1 modules
  CC      /home/Documents/work/code/LiME/src/lime.mod.o
  LD [M]  /home/Documents/work/code/LiME/src/lime.ko
make[1]: Leaving directory `/home/Documents/work/code/linux/linux-4.19.37'
strip --strip-unneeded lime.ko
mv lime.ko lime-4.19.37.ko
~/Documents/work/code/LiME/src$ sudo insmod ./lime-4.19.37.ko "path=dump.mem format=lime timeout=0"
2.volatility
2.1.Install 安装参考此链接
2.1.Building a Profile
A profle is a collection of the VTypes, overlays, and object classes for a specifc operating system version and hardware architecture (x86, x64, ARM). In addition to these components, a profle also includes the following:
- Metadata: Data such as the operating system’s name (i.e., “windows”, “mac”, or “linux”), the kernel version, and build numbers
- System call information: Indexes and names of system calls
- Constant values: Global variables that can be found at hard-coded addresses in some operating systems
- Native types: Low-level types for native languages (usually C), including the sizes for integers, longs, and so on
- System map: Addresses of critical global variables and functions (Linux and
Mac only)
Navigate to volatility/tools/linux and type the following:
1.sudo make -C /lib/modules/$(uname -r)/build CONFIG_DEBUG_INFO=y M=$PWD modules
2.dwarfdump -di ./module.o > module.dwarf
3.sudo zip volatility/plugins/overlays/linux/Ubuntu1404-419.zip tools/linux/module.dwarf /boot/System.map-4.19.37
or sudo zip Debian4908.zip module.dwarf /boot/System.map-$(uname -r)
4.cp Debian4908.zip ../../plugins/overlays/linux/
然后执行:
python vol.py --info
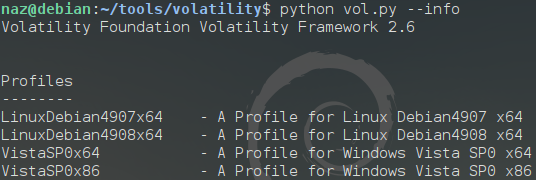
Now when running --info we should see our newly created Linux Profile(s) LinuxDebian4908x64 as available. The archive we created will be prepended with Linux and appended with x64 dependent on the architecture type.

2.2.Memory Analysis with Volatility
Once everything is set up correctly and we’ve acquired a forensic image using LiME. We can start our analysis with Volatility.
An example command using options -f memory file, --profile profile name and linux_banner plugin would look something like this:
python vol.py --file=…/…/LiME/src/dump.mem --profile=LinuxUbuntu1404-419x64 linux_psscan
3.Linux Command Reference
3.1.linux_pslist
The linux_pslist plugin enumerates processes by walking the active process list pointed to by the global init_task variable. The init_task variable is statically allocated within the kernel, initialized at boot, has a PID of 0, and has a name of swapper.
python vol.py --file=…/…/LiME/src/dump.mem --profile=LinuxUbuntu1404-419x64 linux_pslist
3.2.linux_pstree
help visualize the parent/child relationships.
$ python vol.py --profile=LinuxDebian-3_2x64 -f debian.lime linux_pstree
3.3.Process Address Space
The mm member of task_struct is of type mm_struct and it tracks the memory regions of a process. The following output shows several of the most important members for memory forensics.
>>> dt("mm_struct")
The key points are these:
- mmap and mm_rb: These members store the individual process memory mappings as a linked list and red-black tree, respectively.
- pgd: The address of the process’ DTB. This is the member that populates the DTB column of linux_pslist and enables access to the process’ address space.
- owner: A back pointer to the task_struct that owns this mm_struct. On the kernels in which this member is enabled and the SLAB allocator is in use, it can serve as an alternative source of process listings because mm_struct structures are tracked by the cache.618 Part III: Linux Memory Forensics
- start_code and end_code: Pointers to the beginning and end of the process’ executable code.
- start_data and end_data: Pointers to the beginning and end of the process’ data.
- start_brk and brk: Pointers to the beginning and end of the process’ heap.
- start_stack: A pointer to the beginning of the process’ stack. No pointer is kept
to the end of the stack because it will fluctuate on every function call. - arg_start and arg_end: Pointers to the beginning and end of the command-line arguments.
- env_start and env_end: Pointers to the beginning and end of the process’ environment variables.
3.3.1.Enumerating Process Mappings
Two members of the mm_struct hold the set of a process’ mappings. The frst, mmap, is a linked list of vm_area_struct structures (one structure for each mapping). The other is mm_rb, which stores the same vm_area_struct structures, but in a red-black tree, so that the kernel can quickly fnd mappings during page faults or when a new memory range needs to be allocated. The tree is sorted by the starting address of each region, which enables the kernel to quickly query the region associated with an address.
~/Documents/work/code/linux/volatility$ python vol.py --file=../../LiME/src/dump.mem --profile=LinuxUbuntu1404-419x64 linux_volshellVolatility Foundation Volatility Framework 2.6.1

Current context: process init, pid=1 DTB=0xb4444000
Welcome to volshell! Current memory image is:
file:///Documents/work/code/LiME/src/dump.mem
To get help, type 'hh()'
>>> dt("vm_area_struct")
 'vm_area_struct' (200 bytes)
0x0   : vm_start                       ['unsigned long']
0x8   : vm_end                         ['unsigned long']
0x10  : vm_next                        ['pointer', ['vm_area_struct']]
0x18  : vm_prev                        ['pointer', ['vm_area_struct']]
0x20  : vm_rb                          ['rb_node']
0x38  : rb_subtree_gap                 ['unsigned long']
0x40  : vm_mm                          ['pointer', ['mm_struct']]
0x48  : vm_page_prot                   ['pgprot']
0x50  : vm_flags                       ['LinuxPermissionFlags', {'bitmap': {'x': 2, 'r': 0, 'w': 1}}]
0x58  : shared                         ['__unnamed_0x20ab']
0x78  : anon_vma_chain                 ['list_head']
0x88  : anon_vma                       ['pointer', ['anon_vma']]
0x90  : vm_ops                         ['pointer', ['vm_operations_struct']]
0x98  : vm_pgoff                       ['unsigned long']
0xa0  : vm_file                        ['pointer', ['file']]
0xa8  : vm_private_data                ['pointer', ['void']]
0xb0  : swap_readahead_info            ['__unnamed_0x228']
0xb8  : vm_policy                      ['pointer', ['mempolicy']]
0xc0  : vm_userfaultfd_ctx             ['vm_userfaultfd_ctx']
- /proc/1/maps
- linux_proc_maps plugin walks the task_struct->mm->mmap list of each process and reports the region-specifc data.
~/Documents/work/code/linux/volatility$ python vol.py --file=../../LiME/src/dump.mem --profile=LinuxUbuntu1404-419x64 linux_proc_maps -p 1
Volatility Foundation Volatility Framework 2.6.1
Offset             Pid      Name                 Start              End                Flags               Pgoff Major  Minor  Inode      File Path
------------------ -------- -------------------- ------------------ ------------------ ------ ------------------ ------ ------ ---------- ---------
0xffff94c8b59d0000        1 init                 0x00005652dff6e000 0x00005652dffac000 r-x                   0x0      8      1     393283 /
0xffff94c8b59d0000        1 init                 0x00005652e01ac000 0x00005652e01ae000 r--               0x3e000      8      1     393283 /
0xffff94c8b59d0000        1 init                 0x00005652e01ae000 0x00005652e01af000 rw-               0x40000      8      1     393283 /
0xffff94c8b59d0000        1 init                 0x00005652e1860000 0x00005652e1a0b000 rw-                   0x0      0      0          0 [heap]
0xffff94c8b59d0000        1 init                 0x00007fc3f864e000 0x00007fc3f8658000 r-x                   0x0      8      1    1847072 /
0xffff94c8b59d0000        1 init                 0x00007fc3f8658000 0x00007fc3f8857000 ---                0xa000      8      1    1847072 /
0xffff94c8b59d0000        1 init                 0x00007fc3f8857000 0x00007fc3f8858000 r--                0x9000      8      1    1847072 /
0xffff94c8b59d0000        1 init                 0x00007fc3f8858000 0x00007fc3f8859000 rw-                0xa000      8      1    1847072 /
0xffff94c8b59d0000        1 init                 0x00007fc3f8859000 0x00007fc3f8864000 r-x                   0x0      8      1    1847060 /
0xffff94c8b59d0000        1 init                 0x00007fc3f8864000 0x00007fc3f8a63000 ---                0xb000      8      1    1847060 /
0xffff94c8b59d0000        1 init                 0x00007fc3f8a63000 0x00007fc3f8a64000 r--                0xa000      8      1    1847060 /
0xffff94c8b59d0000        1 init                 0x00007fc3f8a64000 0x00007fc3f8a65000 rw-                0xb000      8      1    1847060 /
0xffff94c8b59d0000        1 init                 0x00007fc3f8a65000 0x00007fc3f8a7c000 r-x                   0x0      8      1    1847076 /
0xffff94c8b59d0000        1 init                 0x00007fc3f8a7c000 0x00007fc3f8c7b000 ---               0x17000      8      1    1847076 /
0xffff94c8b59d0000        1 init                 0x00007fc3f8c7b000 0x00007fc3f8c7c000 r--               0x16000      8      1    1847076 /
0xffff94c8b59d0000        1 init                 0x00007fc3f8c7c000 0x00007fc3f8c7d000 rw-               0x17000      8      1    1847076 /
3.3.2.Recovering Sections of Memory
During analysis, you will often want to extract the memory mappings of a process. To assist with this effort, Volatility provides the linux_dump_maps plugin.
python vol.py --profile=LinuxDebian-3_2x64 -f debian.lime linux_dump_map
-p 1 -s 0x400000 -D dump
Volatility Foundation Volatility Framework 2.4
Task VM Start VM End Length Path
-------- ------------------ ------------------ ------- ----
1 0x0000000000400000 0x0000000000409000 0x9000 dump/task.1.0x400000.vma
$ file dump/task.1.0x400000.vma
dump/task.1.0x400000.vma: ELF 64-bit LSB executable, x86-64, version 1 (SYSV),
dynamically linked (uses shared libs), stripped
- “–p 1” option flters the plugin to process 1.
- “–s 0x400000” option tells the plugin to dump only the one range that starts at 0x400000
3.3.3.Analyzing Command-line Arguments
As previously demonstrated, the linux_pslist plugin gathers the name of the running process from the comm member of task_struct. Unfortunately, this buffer is limited to 16 bytes, which truncates long program names, and does not give any indication about which directory the application is running from or which options were passed to the program on startup.
To recover this additional information, you can use the linux_psaux plugin. The plugin gathers arguments by frst switching to the process’ address space through the use of the task_struct.get_process_address_space() function and then reading from the address pointed to by mm_struct->arg_start (the start of the command-line arguments on the process’ stack)
zhaoxiao@zhaoxiao:~/Documents/work/code/linux/volatility$ python vol.py --file=../../LiME/src/dump.mem --profile=LinuxUbuntu1404-419x64 linux_psaux
Volatility Foundation Volatility Framework 2.6.1
Pid    Uid    Gid    Arguments
1      0      0      /sbin/init splash
2      0      0      [kthreadd]
3      0      0      [rcu_gp]
4      0      0      [rcu_par_gp]
6      0      0      [kworker/0:0H]
8      0      0      [mm_percpu_wq]
9      0      0      [ksoftirqd/0]
10     0      0      [rcu_sched]
11     0      0      [rcu_bh]
12     0      0      [migration/0]
13     0      0      [kworker/0:1]
14     0      0      [cpuhp/0]
15     0      0      [cpuhp/1]
3.3.4.Process Environment Variables
$ python vol.py --profile=LinuxDebian-3_2x64 -f debian.lime linux_psenv
This output shows several items of interest:
-
Kernel threads don’t have environment variables: As previously mentioned, some malware will attempt to blend their processes in with kernel threads. You can check for this behavior by looking at the presence (or absence) of environment variables. If variables exist, it isn’t a real kernel thread.
-
https://github.com/volatilityfoundation/volatility/wiki/Linux-Command-Reference
2.4.Linux Volshell 参考此链接
To get the process started, simply run the “linux_volshell” plugin with no arguments.
$python vol.py --file=../../LiME/src/dump.mem --profile=LinuxUbuntu1404-419x64 linux_volshell
Volatility Foundation Volatility Framework 2.6.1
Current context: process init, pid=1 DTB=0xb4444000
Welcome to volshell! Current memory image is:
file:///home/zhaoxiao/Documents/work/code/LiME/src/dump.mem
To get help, type 'hh()'
>>>
This drops you into a Python shell. At this point you have full access to the Volatility namespace as well as all of Python. If you type hh() you are given a help menu which displays the volshell-specific plugins.
The following output shows select members of the task_struct structure:
>>> dt("task_struct")
refer to
- https://github.com/504ensicsLabs/LiME
- https://markuta.com/live-memory-acquisition-on-linux-systems/
- https://github.com/volatilityfoundation/volatility/wiki/Installation
- https://www.youtube.com/watch?v=qoplmHxmOp4
- The Art of Memory Forensics book
- https://countuponsecurity.com/2019/10/14/notes-on-linux-memory-analysis-lime-volatility-and-lkms/
