目录
2.1.1 Magnet RAM Capture获取内存镜像
2.1.2 AccessData FTK Imager软件获取内存镜像
一、基本概念
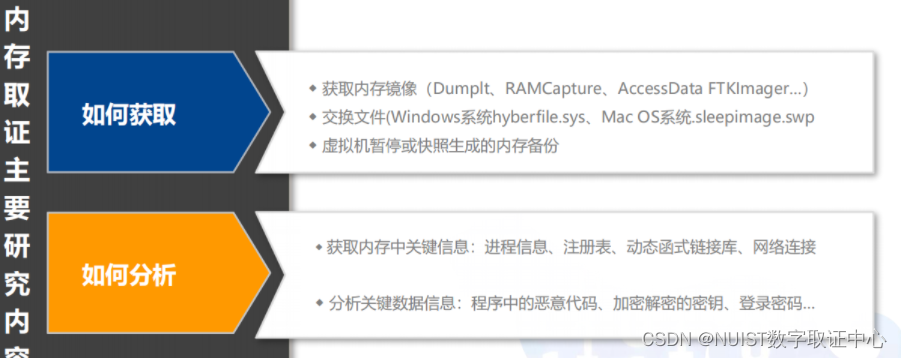
内存取证是对传统磁盘取证的补充,攻击者通过隐藏或删除攻击痕迹 的手段, 使得传统的对硬盘的取证获得的信息变得越来 越困难。同时,磁盘中的数据加密技术也越来 越普及,比如 EFS、Bitlocker 和 TrueCrypt 加密等等,此 时就涉及到了内存取证,内存取证是指从计算机物理内存和页面交换文件中查找、 提取、分析易失性证据,是对传统基于硬盘中数据取证的重要补充,也是对抗网 络攻击或网络犯罪的有力武器。内存取证有着速度快,镜像占用空间小等优势。
内存取证的优势
- 符合传统物证技术的要求
- 内存取证能够评估计算在线证据的可信性
- 内存取证最大限度地减少对目标系统的影响
注意:
内存镜像和磁盘分区镜像是不一样的。计算机内主要的存储部件是内存和磁盘,磁盘中存储着各种数据,而存储的程序是必须加载到内存中才能运行(即程序在内存中运行)。
- 磁盘分区镜像文件后缀有*.dd、*.E01、*. qcow2等。
- 内存镜像文件后缀有*.raw、*.mem、*.dd等。
二、运行内存镜像的获取
2.1 Windows内存镜像获取
当拿到嫌疑人电脑后,有以下常见的获取物理内存的方法:
(1)内存获取软件获取
(2)直接内存访问(DMA)方式获取.
在Windows电脑处于可进入系统桌面下,可以使用内存获取软件获取内存镜像,常见的内存获取软件有Dumplt、Magnet RAM Capture、AccessData FTK Image等。
2.1.1 Magnet RAM Capture获取内存镜像
运行软件后,可选择分段大小,之后选内存镜像保存路径,点击“start”后,软件自动获取物理内存镜像。

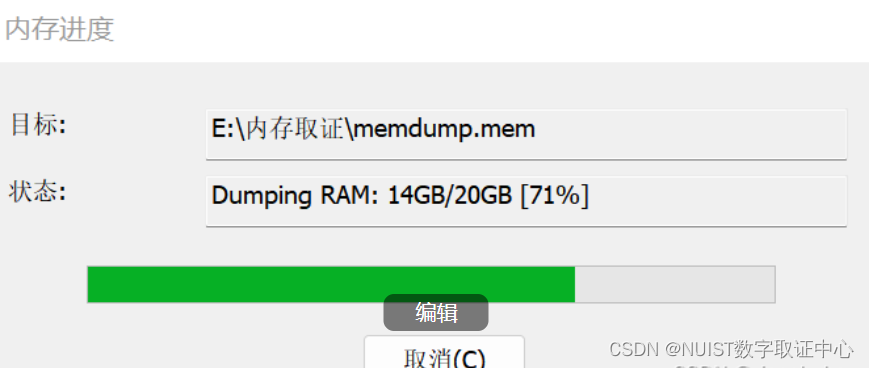
2.1.2 AccessData FTK Imager软件获取内存镜像
点击工具栏获取内存图标或选择“File”->“Capture Memory”。点击“Browse”选择内存镜像保存路径,可自行修改内存镜像文件名称,默认名称为“memdump.mem”。点击“Capture Memory”开始制作镜像,制作完成后可在相应路径中找到制作的内存镜像文件。

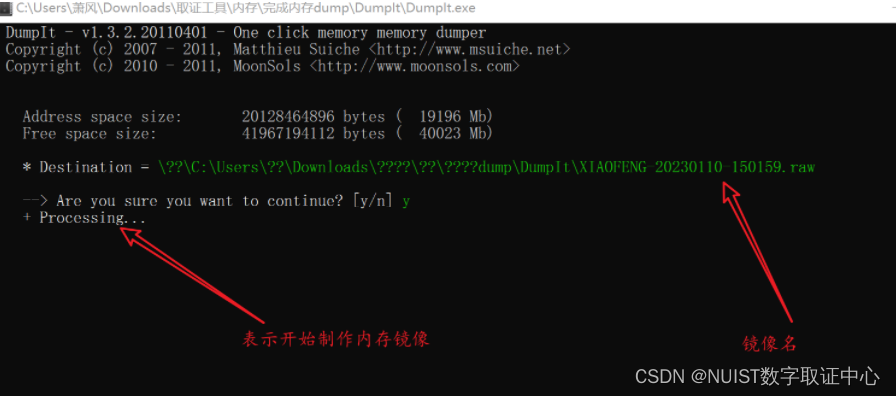
2.1.3 DumpIt软件获取内存镜像
双击软件即可运行,输入“y”,即开始制作当前机器的内存镜像。内存镜像默认保存在“DumpIt软件所在的目录”,镜像名格式默认为“主机名+当前时间”。
2.1.4 额外知识补充:
- 断电情况下:Windows还使用页交换文件(Pagefile.sys)来协助内存的工作,当内存不满足系统所需的情况下,会释放部分内存数据到Pagefile.sys文件中,因此,当设备断电后,若无法拿到内存镜像,可以通过分析Pagefile.sys文件获取有价值的内存数据。
- 休眠情况下:当Windows系统处于休眠状态下,系统会在磁盘中生成一个休眠文件(Hiberfil.sys)用于存放内存中的数据,当计算机重新加电时,又将休眠文件中的数据重新写到物理内存中 ,这个文件也会包含很多价值的内存数据。
- powercfg -a查询是否支持休眠,
- powercfg -h off,即可关闭休眠功能,
- powercfg -h on,就能开启休眠功能。

2.2 Linux\Mac OS 下内存获取方法
lmg-master:GitHub - halpomeranz/lmg: Script for automating Linux memory capture and analysis (配合LiME获取镜像,简化操作)
将lmg-master内文件放入LiME的src文件夹,运行sudo ./lmg 搞定。
三、内存信息取证与分析
3.1 volatility安装
Volatility Framework 是一个完全开放的内存分析工具集,基于GNU GPL2 许可,以python 语言进行编写。由于Volatility 是一款开源免费的工具,无需花任何钱即可进行内存数据的高级分析,此外代码开源的特点,遇到一些无法解决的问题时,还可以对源代码进行修改或扩展功能。Volatility官网https://www.volatilityfoundation.org/
3.1.1 Windows
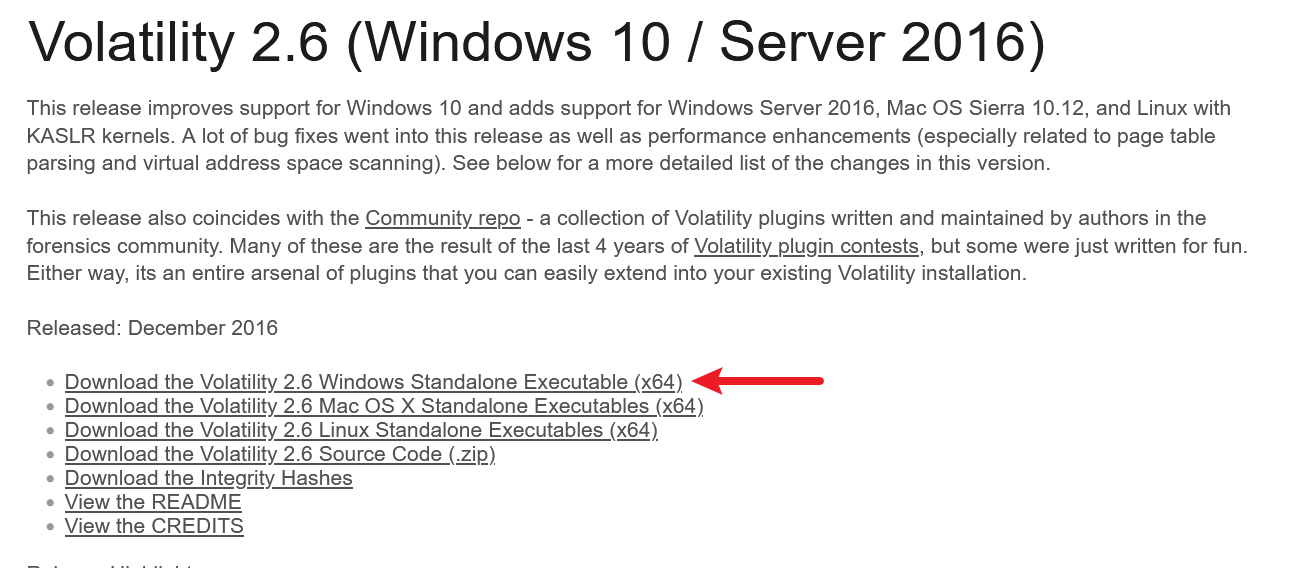
直接官网安装:Volatility 2.6 Release
解压后如下:
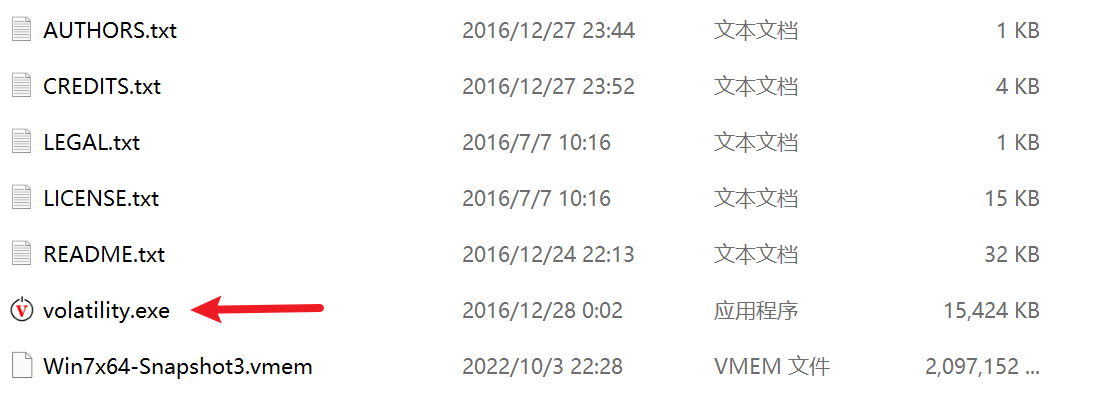
命令行打开,进入到该目录,运行volatility.exe(命令格式请往下看)

3.1.2 Linux
GitHub下载项目包:
GitHub - volatilityfoundation/volatility: An advanced memory forensics framework解压项目包:
unzip volatility-master.zip安装crypto依赖包:
pip install pycrypto安装失败参考:python2安装pycrypto_python2 pycrypto_xxL7-的博客-CSDN博客
安装distorm3依赖包:
pip install distorm3
3.2 内存取证命令
命令格式
vol.py -f [镜像] --profile=[操作系统] [插件]
- windows中把
vol.py换成volatility.exe即可- windows中配合
find命令来匹配关键字- Linux中配合
grep命令来匹配关键字
3.2.1 获取镜像信息
vol.py -f Win7x64.vmem imageinfo
这一步主要是为了获取操作系统信息,在Suggested Profile(s)参数处会给出可能的操作系统,一般第一个就是正确的操作系统。

3.2.2 查看用户
vol.py -f Win7x64.vmem --profile=Win7SP1x64 printkey -K "SAM\Domains\Account\Users\Names"
通过注册表项中的SAM键查看该计算机创建的用户信息

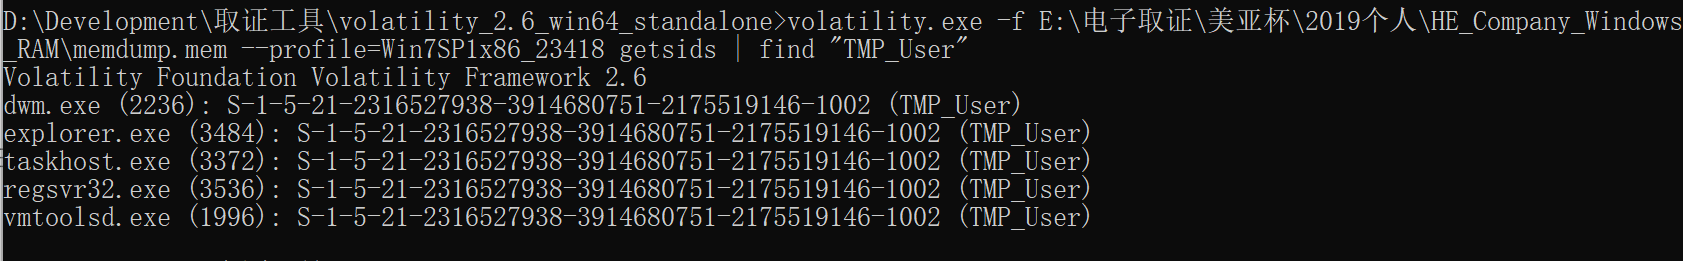
3.2.3 查看用户SID
volatility.exe -f 镜像 --profile=操作系统 getsids | find "用户名"Windows中使用volatility配合find命令使用来匹配关键字
3.2.4 查看用户名密码
vol.py -f Win7x64.vmem --profile=Win7SP1x64 hashdump- 显示的格式是:用户名:RID:LM hash:NTLM hash:::

3.2.5 查看LSA密钥信息
vol.py -f Win7x64.vmem --profile=Win7SP1x64 lsadump

3.2.6 查看系统浏览器的浏览记录
vol.py -f Win7x64.vmem --profile=Win7SP1x64 iehistory

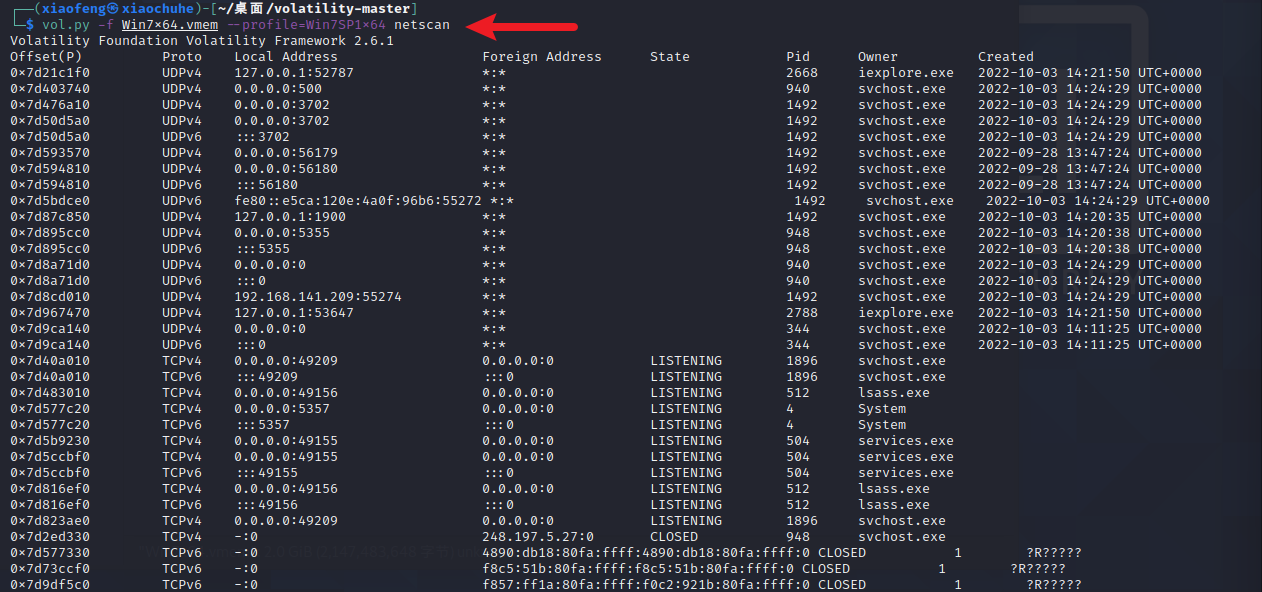
3.2.7 查看网络连接情况
vol.py -f Win7x64.vmem --profile=Win7SP1x64 netscan也可能是connscanconnections
3.2.8 查看服务
vol.py -f Win7x64.vmem --profile=Win7SP1x64 svcscan

3.2.9 查看进程
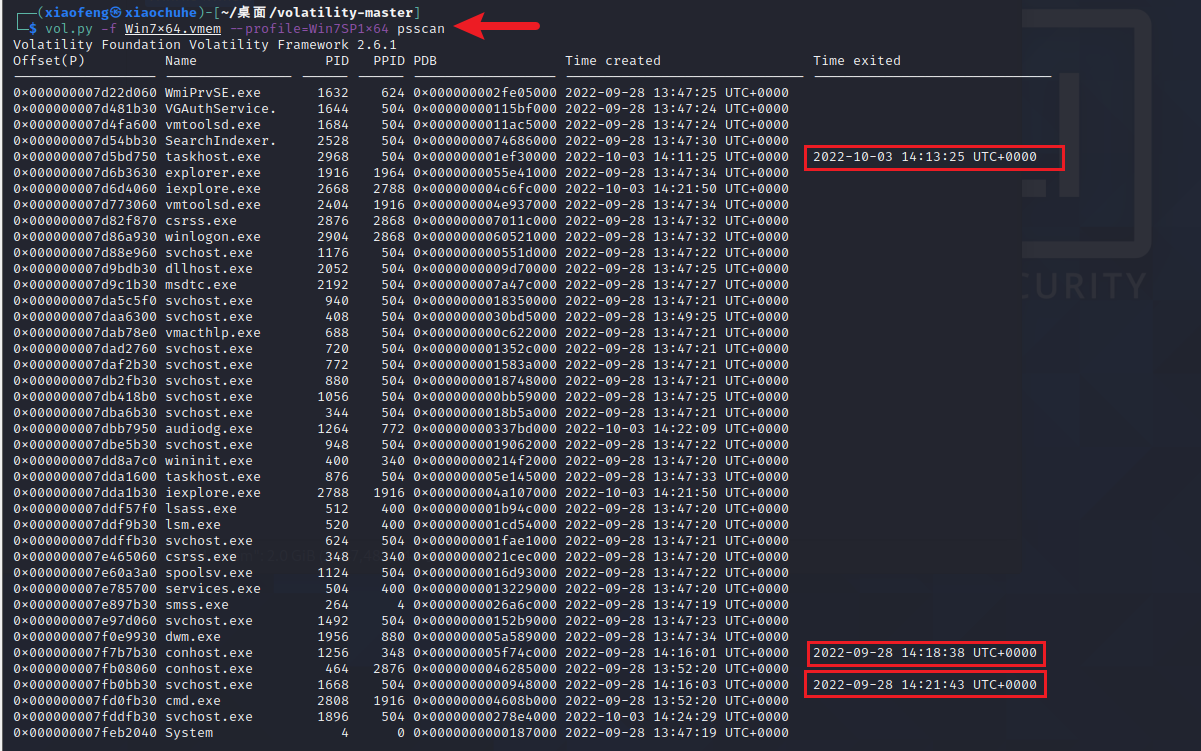
vol.py -f Win7x64.vmem --profile=Win7SP1x64 pslist

vol.py -f Win7x64.vmem --profile=Win7SP1x64 psscan可以找到已经终止/不活动的进程以及杯rootkit隐藏或解链的进程
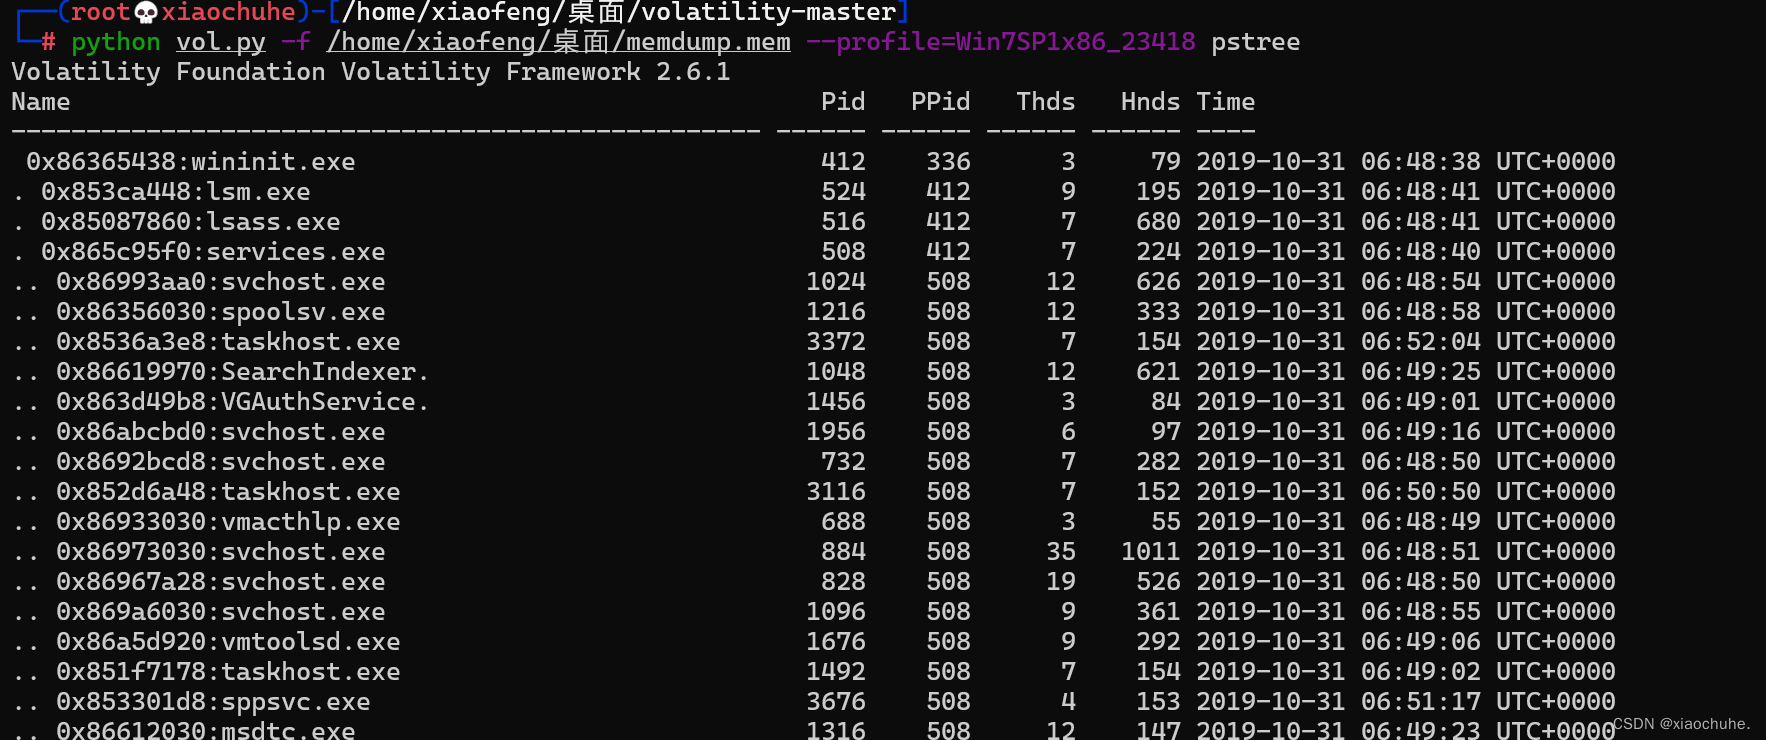
3.2.10查看进程树:
vol.py -f Win7x64.vmem --profile=Win7SP1x64 pstree
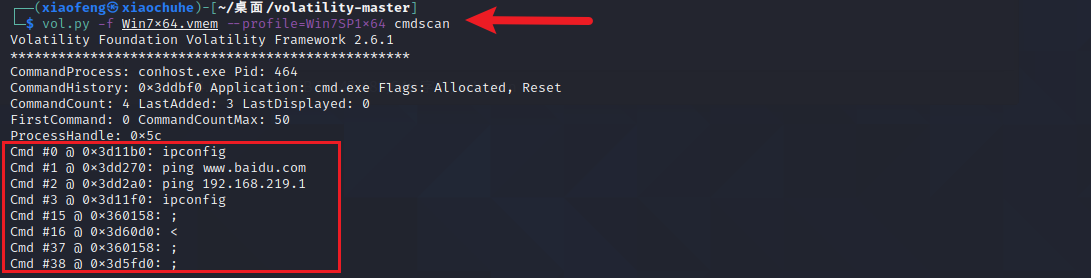
3.2.11 查看cmd历史命令
vol.py -f Win7x64.vmem --profile=Win7SP1x64 cmdscan
3.2.12 查看文件
vol.py -f Win7x64.vmem --profile=Win7SP1x64 filescan
3.2.13 获取主机名
vol.py -f Win7x64.vmem --profile=Win7SP1x64 printkey -K "ControlSet001\Control\ComputerName\ComputerName"
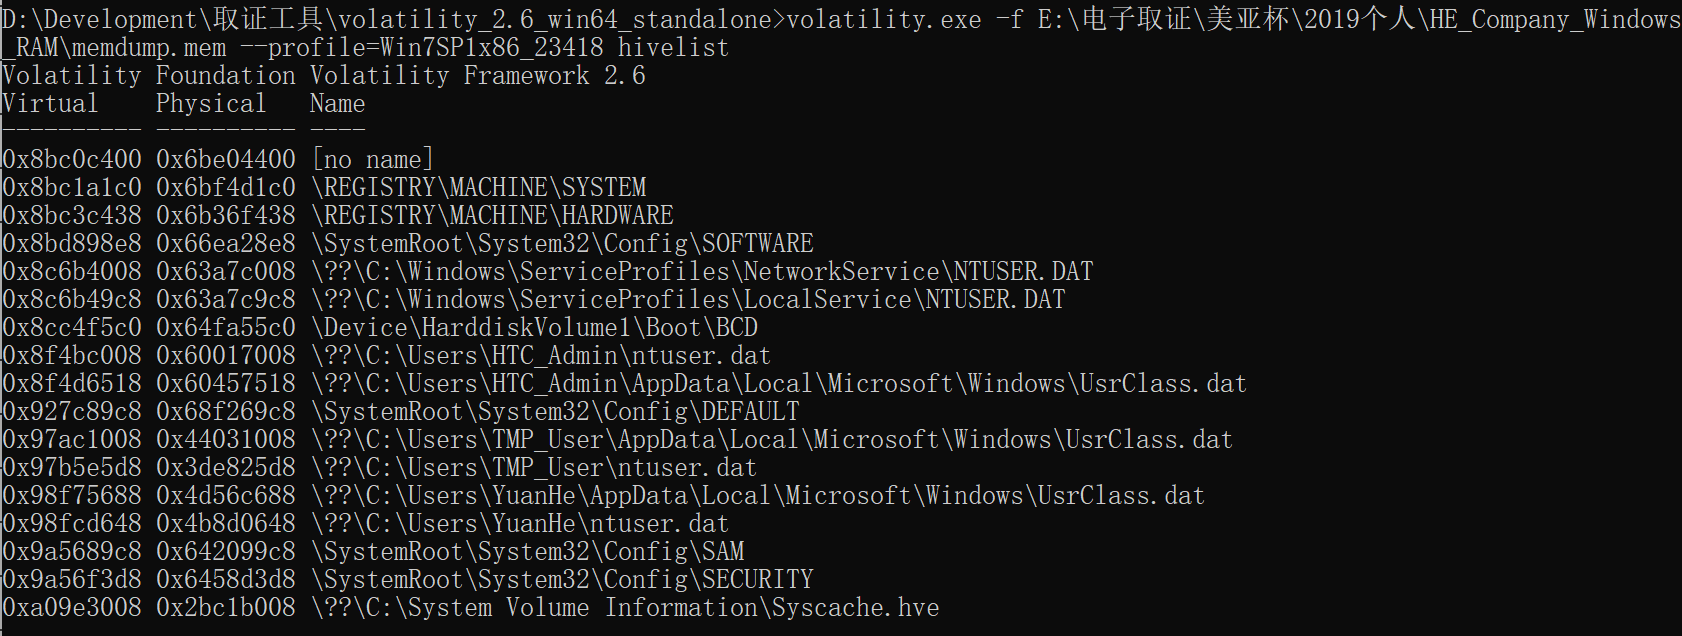
3.2.14 查看注册表配置单元
vol.py -f 镜像 --profile=操作系统 hivelist可以查看道注册表信息及其虚拟地址和物理地址
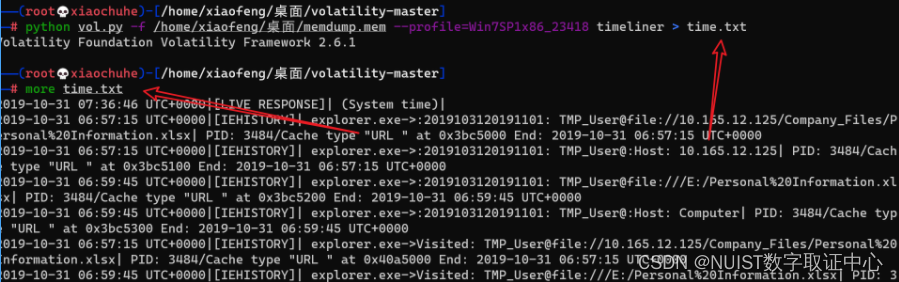
3.2.15 事件时间线信息
vol.py -f Win7x64.vmem --profile=Win7SP1x64 timeliner
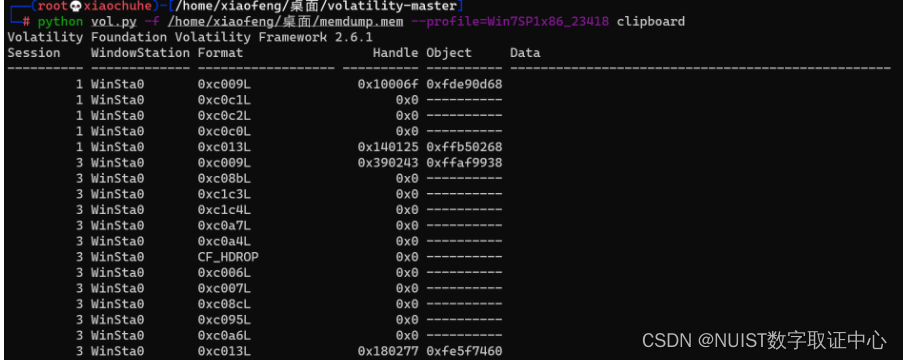
3.2.16 查看剪切板信息
vol.py -f Win7x64.vmem --profile=Win7SP1x64 clipboard
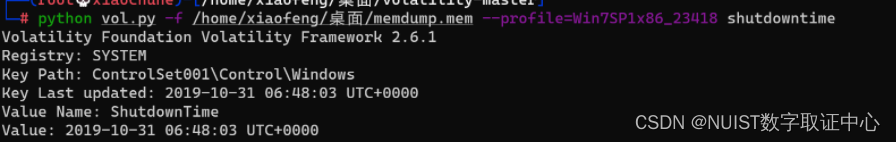
3.2.17 系统最后一次关机时间
vol.py -f Win7x64.vmem --profile=Win7SP1x64 shutdowntime