使用 Docker 部署 Prometheus + Grafana 监控平台
默认docker 已经安装好,我使用的是CentOS7
注意一定要开启服务器对应的端口
1. 安装Prometheus
docker run -itd --name=prometheus --restart=always -p 9090:9090 prom/prometheus

访问:http://ip:9090
2.安装Grafana
#这里的$PWD就是你的当前位置,我当前位置在/root,那么grafana-storage就会生成在/root下
docker run -itd --name=grafana \
> --restart=always \
> -p 3000:3000 \
> -v $PWD/grafana-storage:/var/lib/grafana \
> grafana/grafana

访问:http://ip:3000
账号密码都是admin
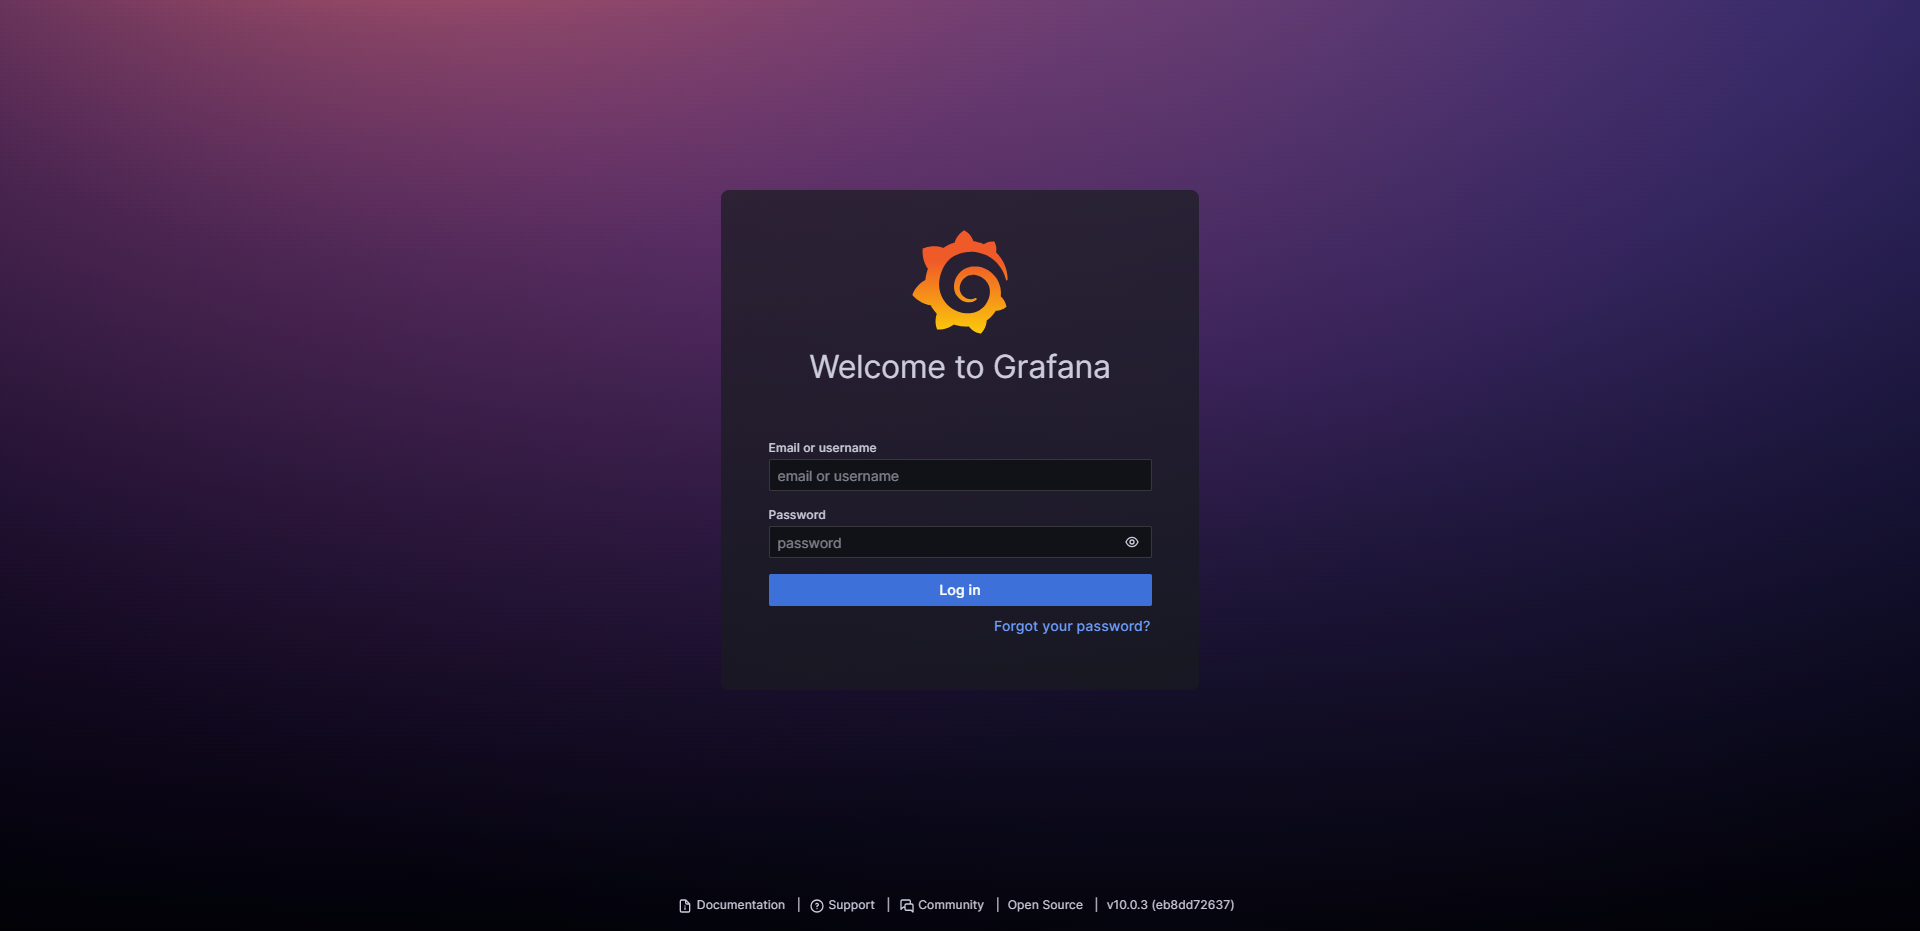
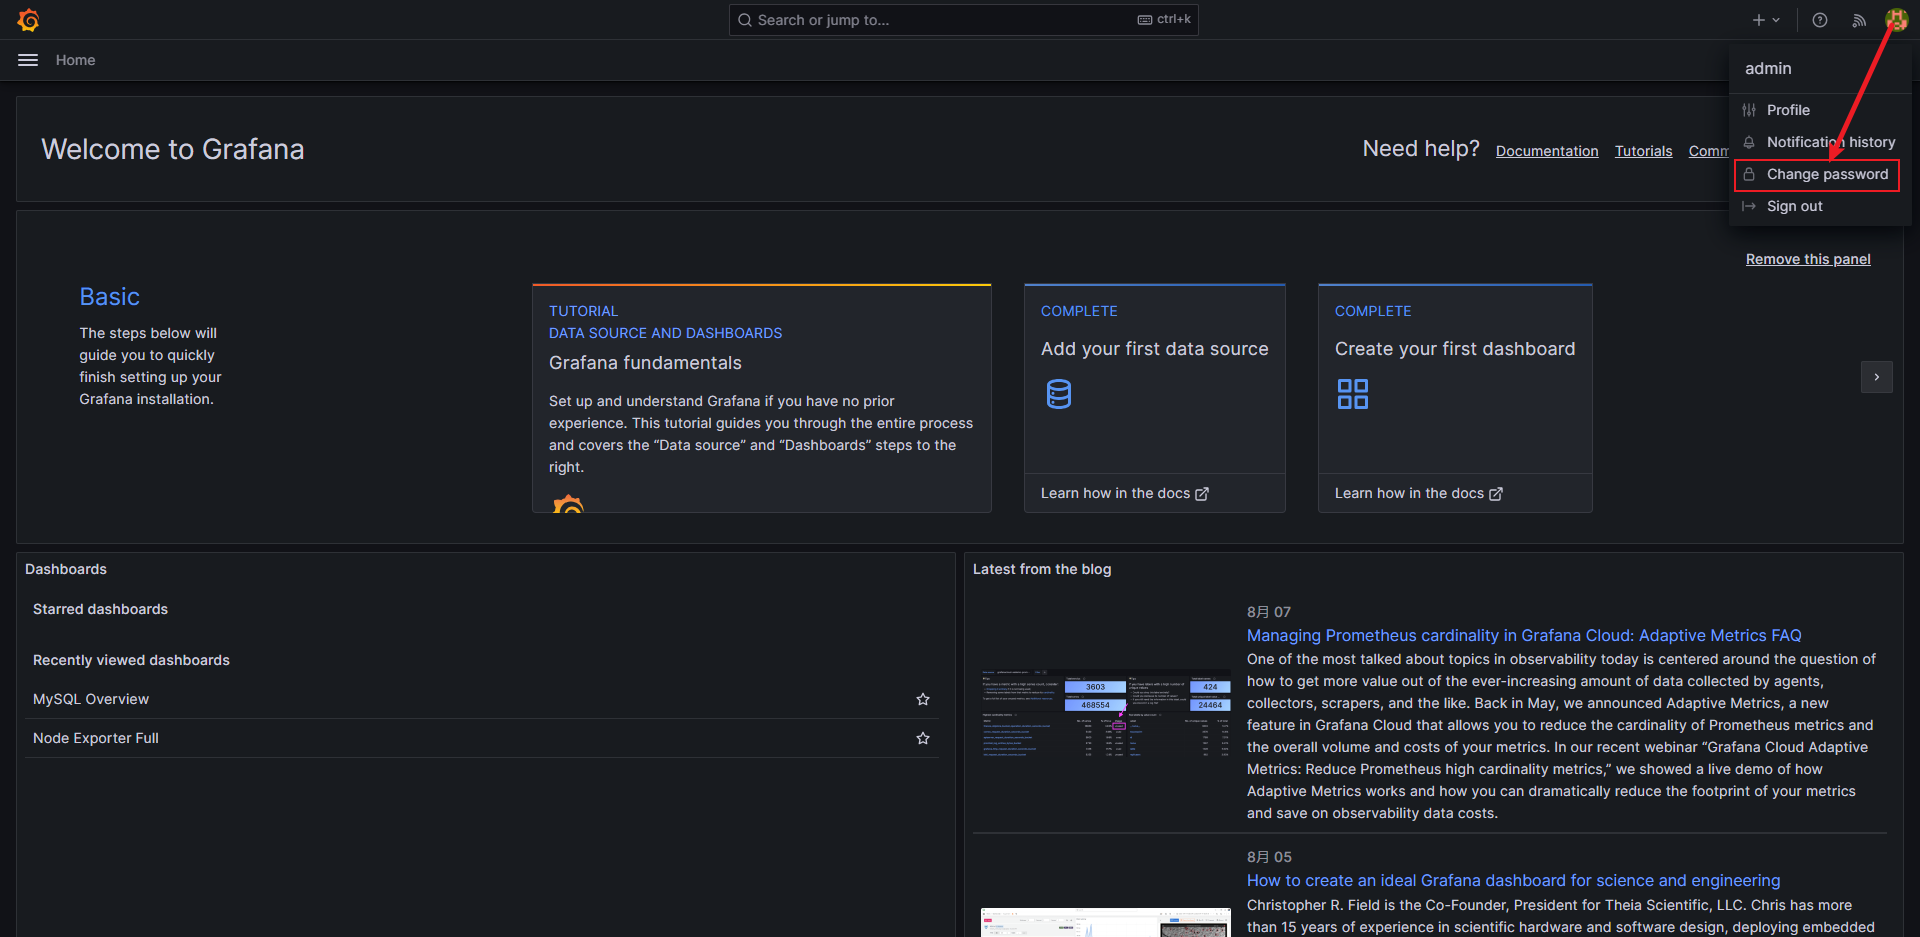
登录进来后此处可以修改密码
3. 安装Node_exporter
因为Prometheus 本身不具备监控功能,所以想要通过Prometheus 收集数据的话,需要安装对应的exporter。
docker run -itd --name=node-exporter \
--restart=always \
-p 9100:9100 \
-v "/proc:/host/proc:ro" \
-v "/sys:/host/sys:ro" \
-v "/:/rootfs:ro" \
prom/node-exporter

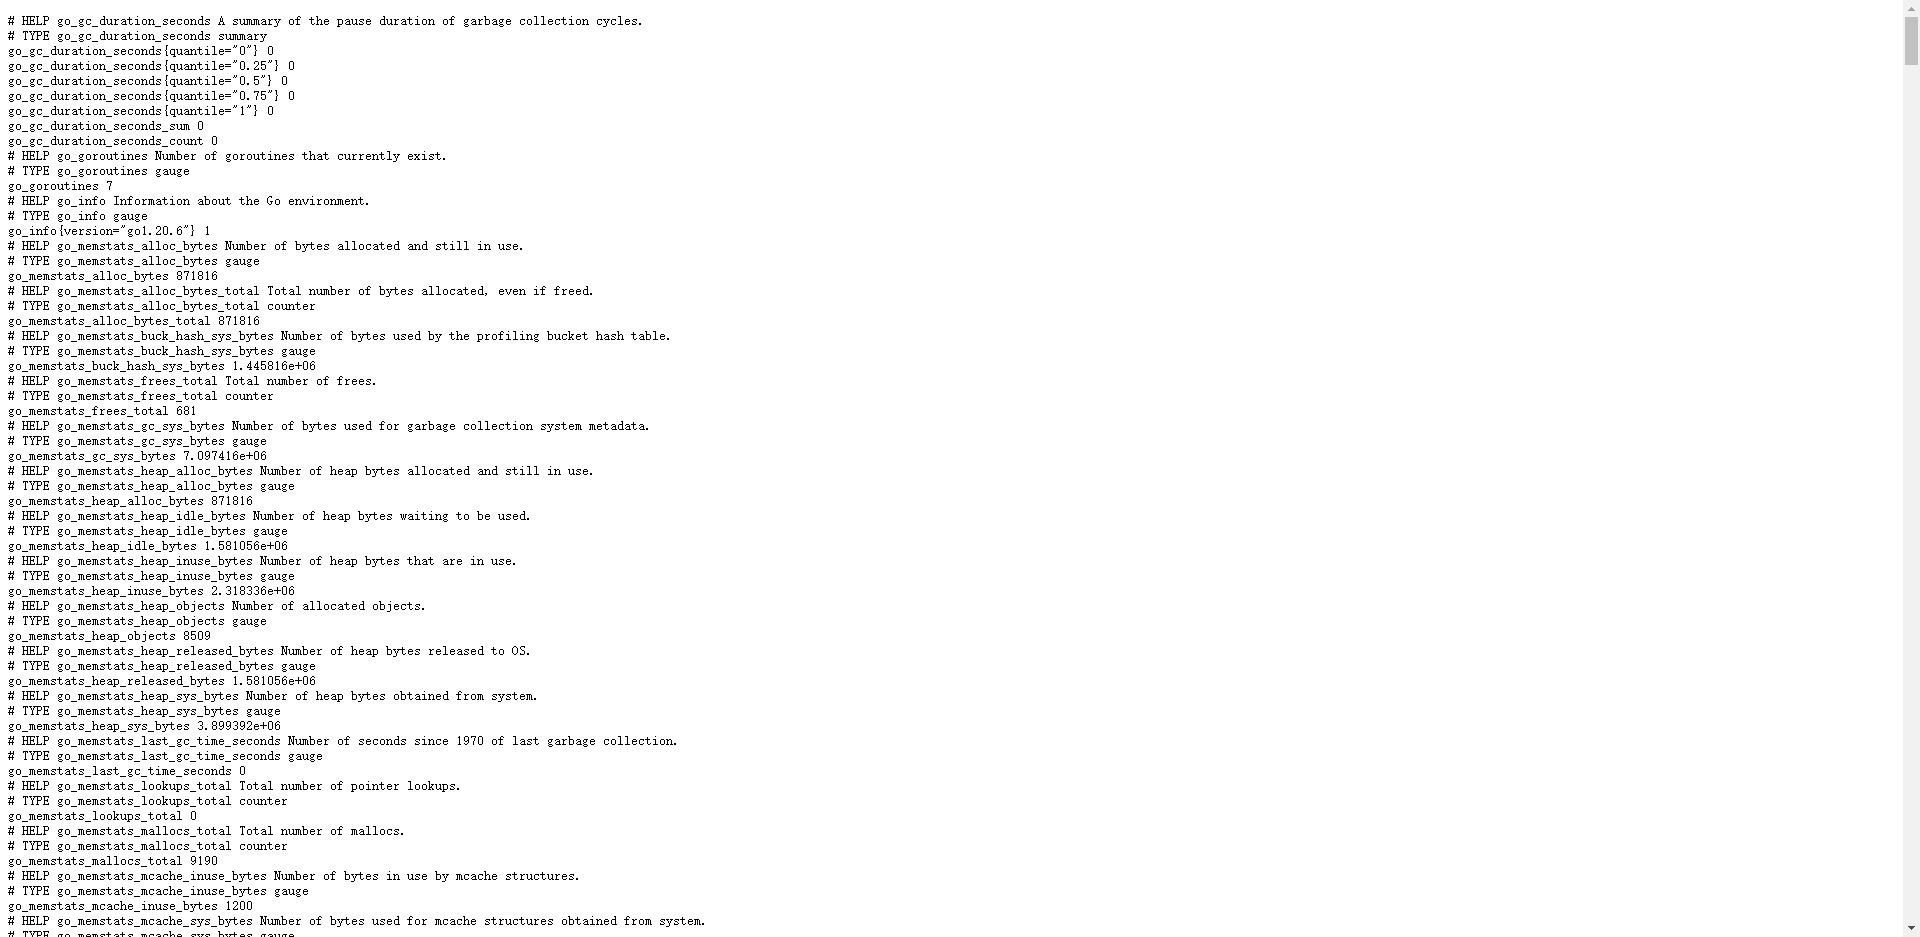
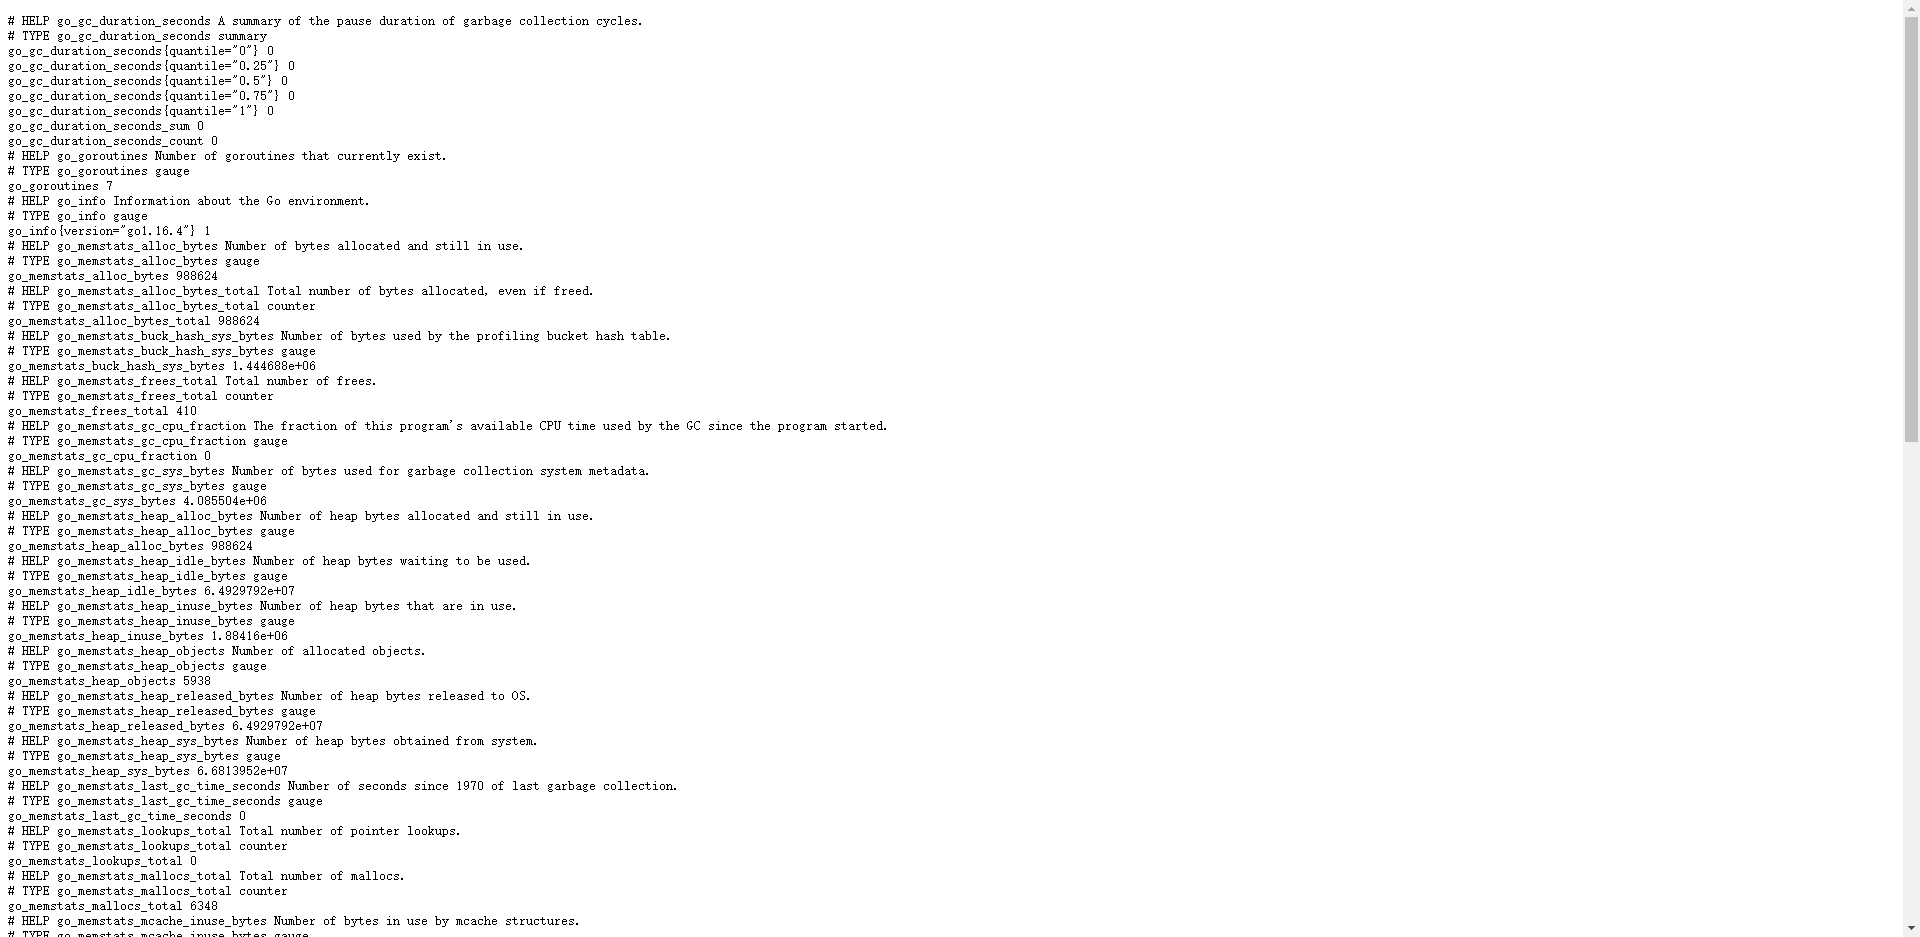
http://ip:9100/metrics
4. 配置 Prometheus 监控Node节点
4.1 修改Prometheus主配置文件
先将配置文件拷贝出来
#  $PWD 当前目录在/root
docker cp prometheus:/etc/prometheus/prometheus.yml $PWD

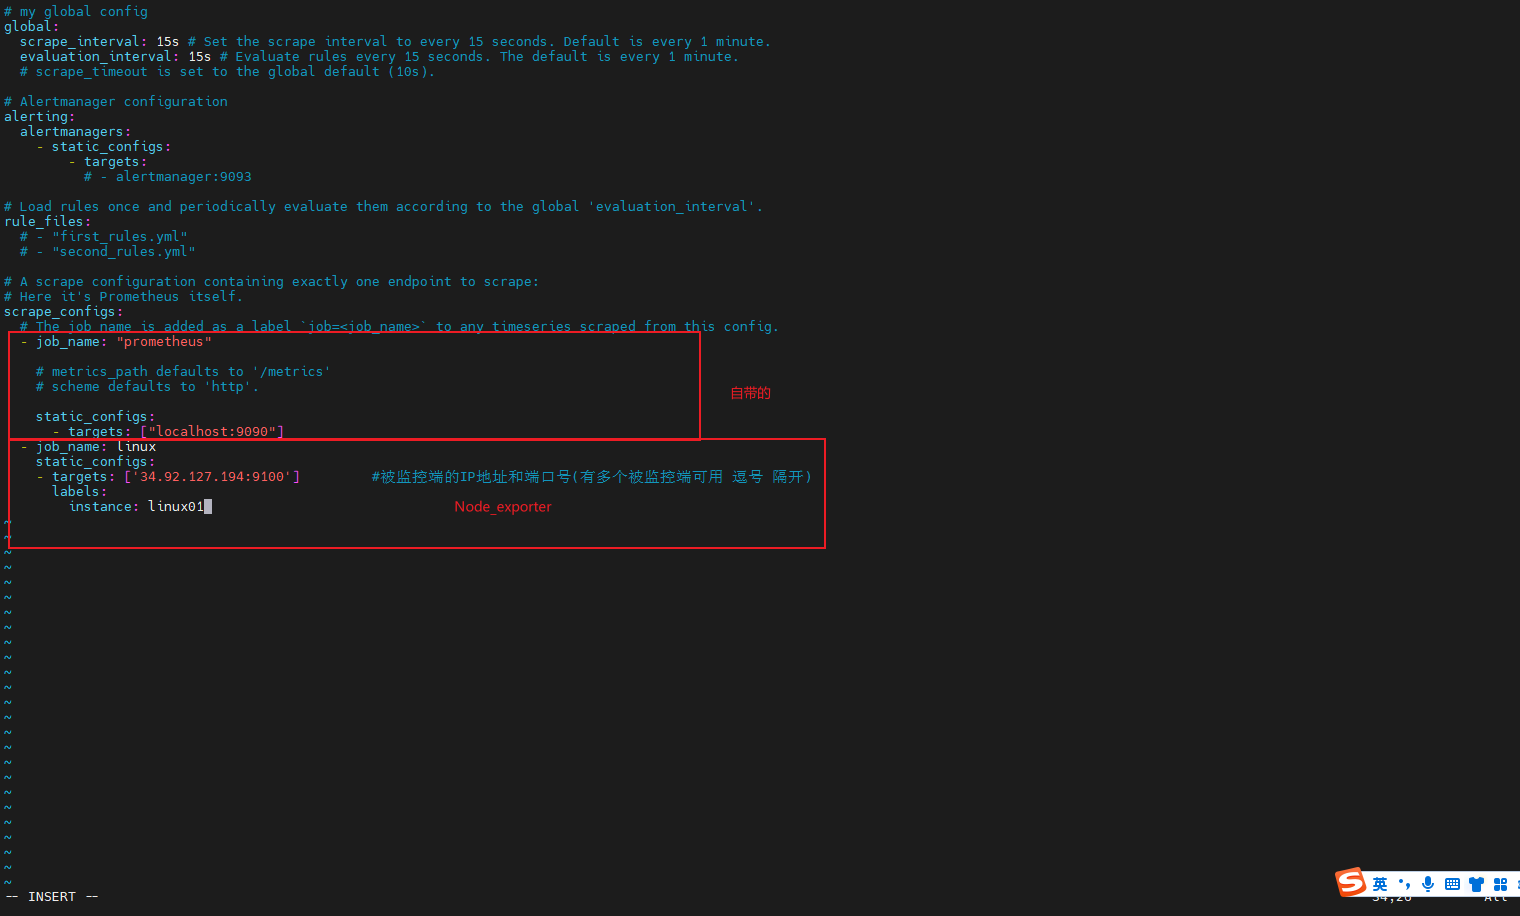
在Prometheus配置文件按以下内容修改:
# my global config
global:
  scrape_interval: 15s # Set the scrape interval to every 15 seconds. Default is every 1 minute.
  evaluation_interval: 15s # Evaluate rules every 15 seconds. The default is every 1 minute.
  # scrape_timeout is set to the global default (10s).

# Alertmanager configuration
alerting:
  alertmanagers:
    - static_configs:
        - targets:
          # - alertmanager:9093

# Load rules once and periodically evaluate them according to the global 'evaluation_interval'.
rule_files:
  # - "first_rules.yml"
  # - "second_rules.yml"

# A scrape configuration containing exactly one endpoint to scrape:
# Here it's Prometheus itself.
scrape_configs:
  # The job name is added as a label `job=<job_name>` to any timeseries scraped from this config.
  - job_name: "prometheus"

    # metrics_path defaults to '/metrics'
    # scheme defaults to 'http'.

    static_configs:
      - targets: ["localhost:9090"]
  - job_name: linux
    static_configs:
    - targets: ['Node_exporter所在ip:9100']         #被监控端的IP地址和端口号(有多个被监控端可用 逗号 隔开)
      labels:
        instance: linux01  #示例名称随便起
修改完成后在拷贝回去
docker cp $PWD/prometheus.yml prometheus:/etc/prometheus/prometheus.yml
重启prometheus,使配置生效
docker restart prometheus
5. 配置prometheus+Grafana
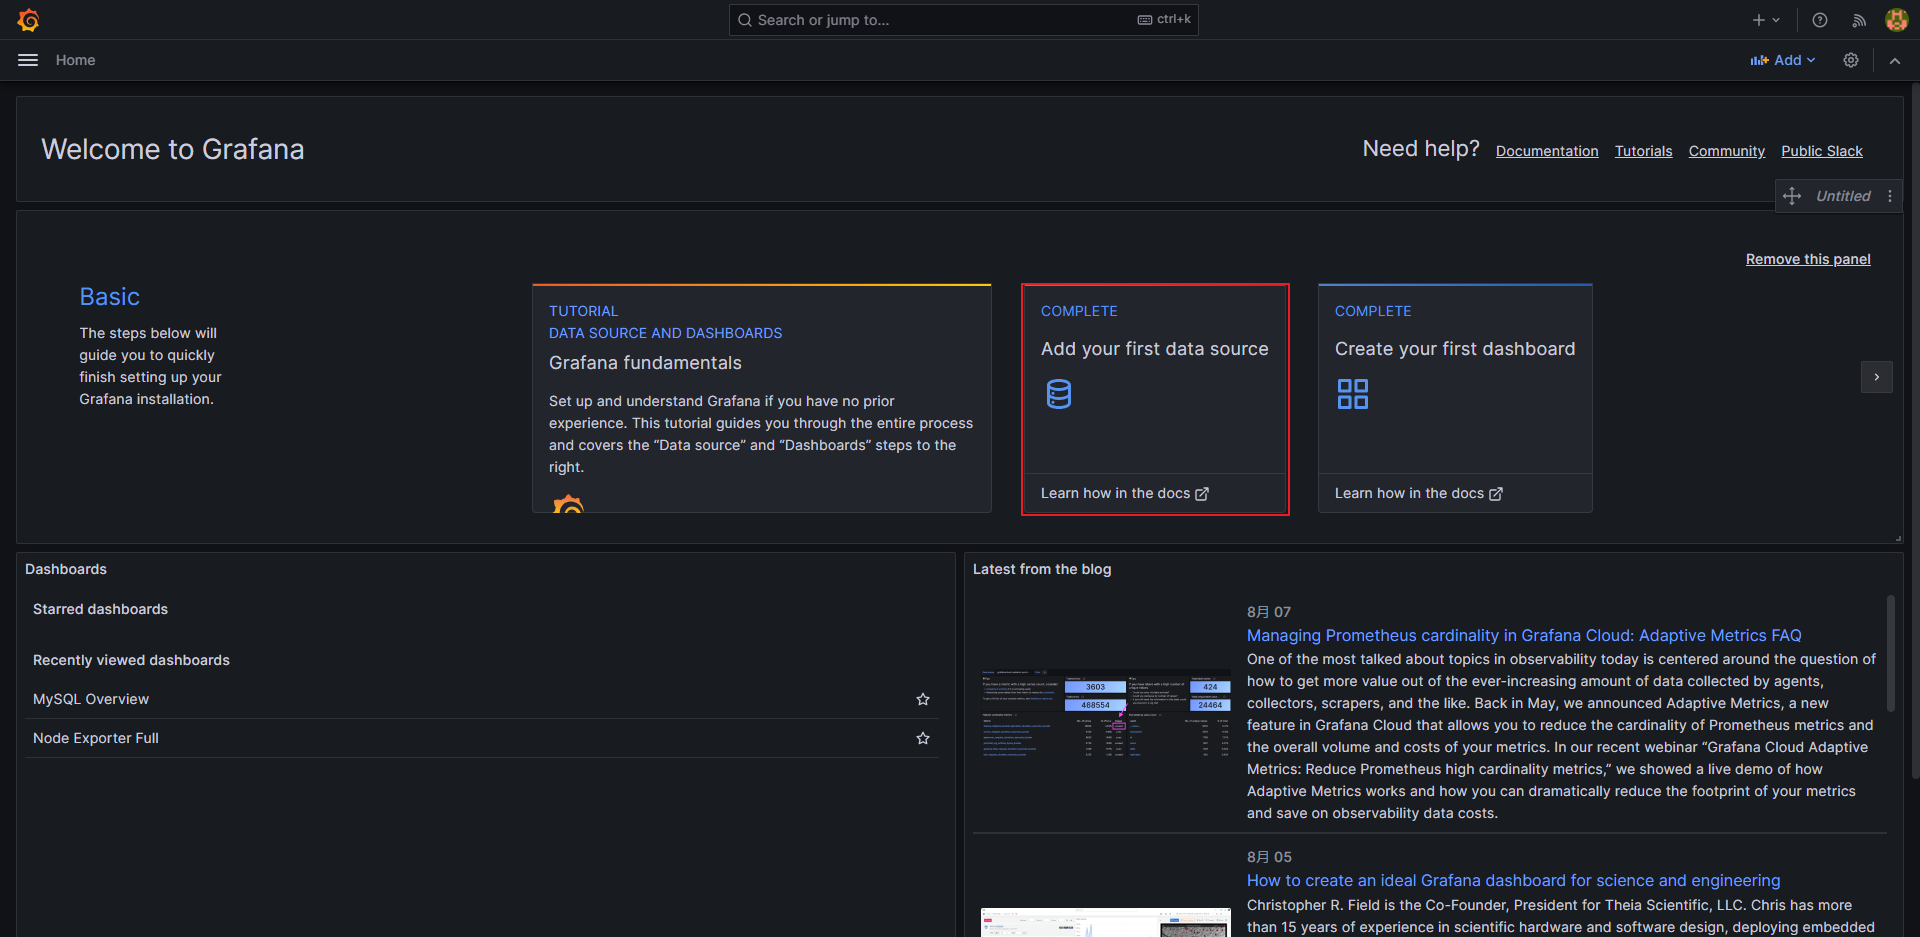
使用浏览器访问http:/ /ip:3000来将Node节点监控
-
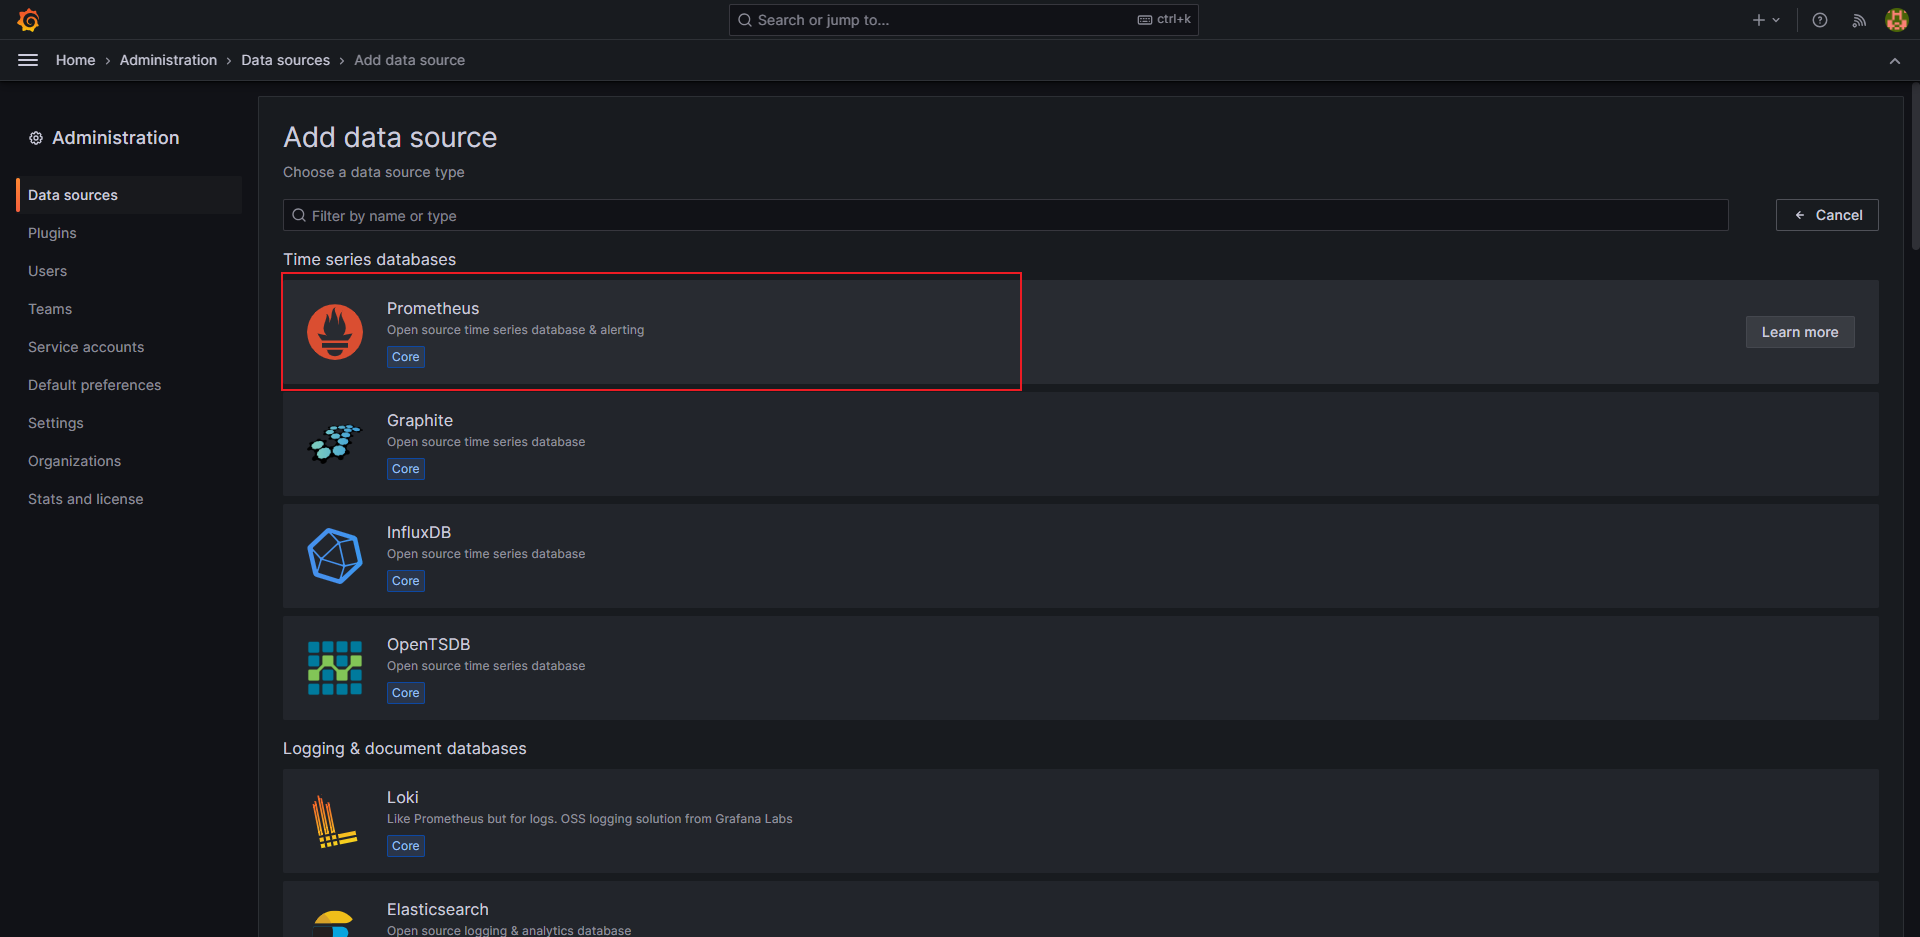
添加数据源
-
选择prometheus数据源
-
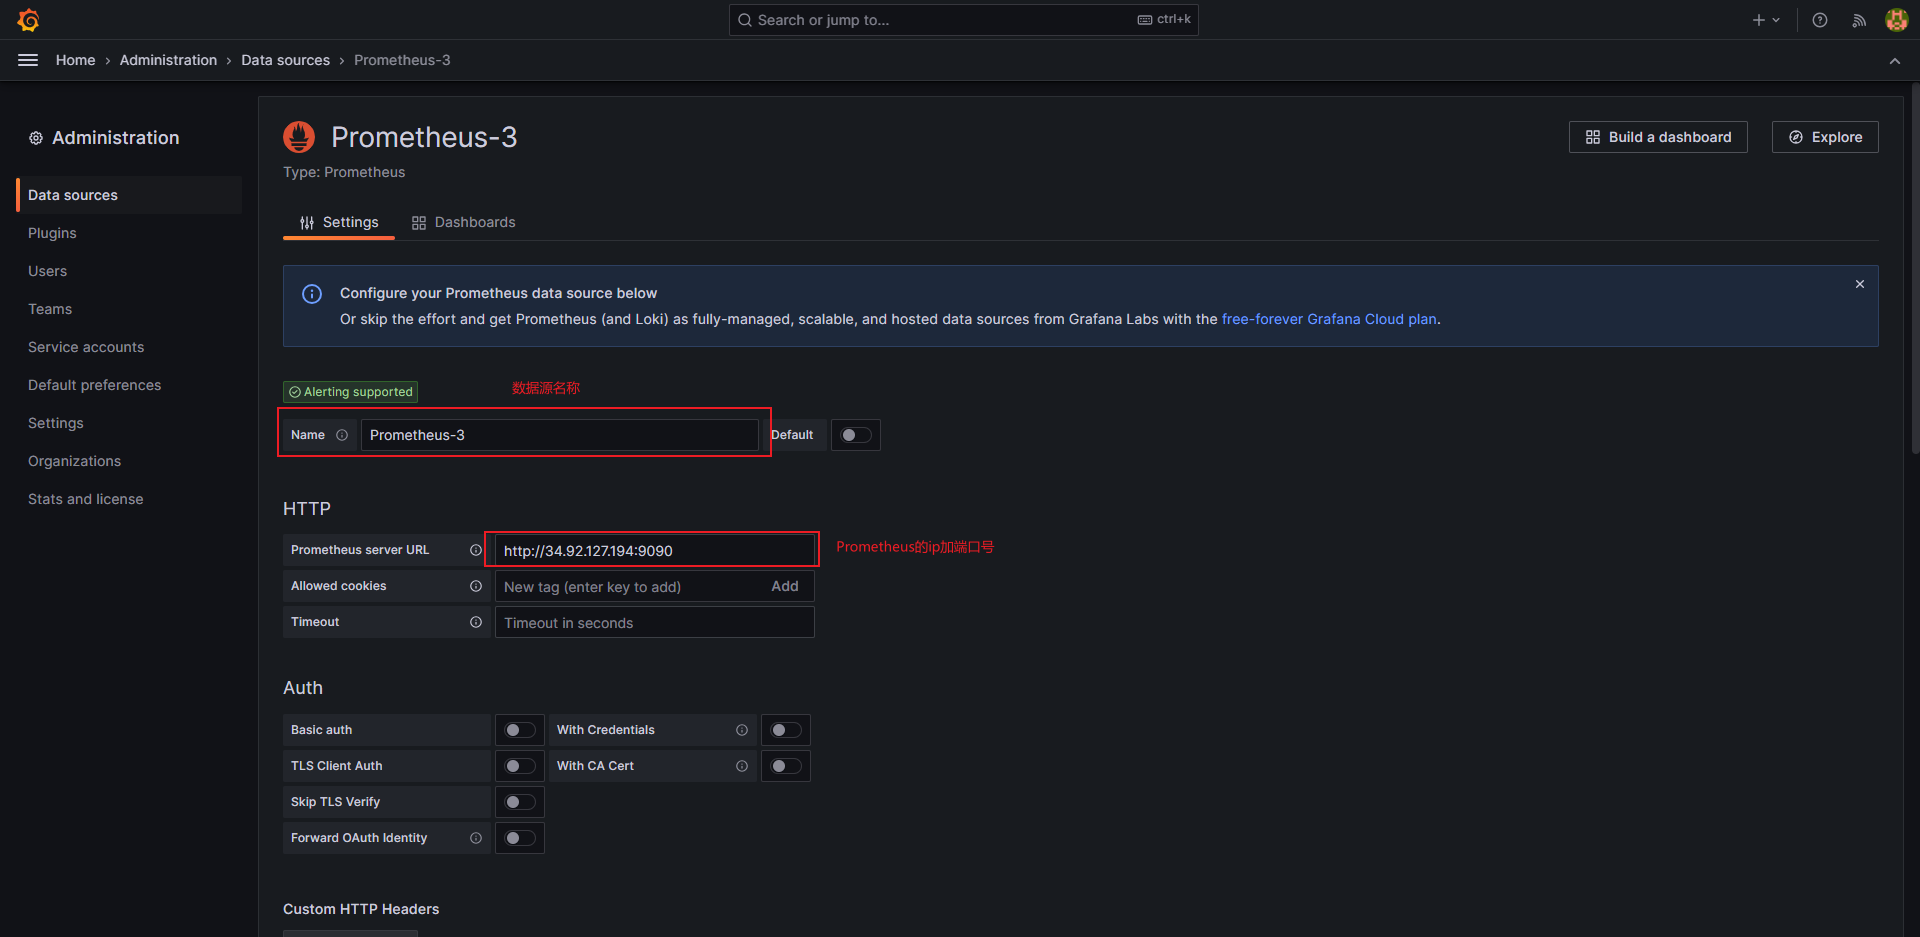
配置数据源
-
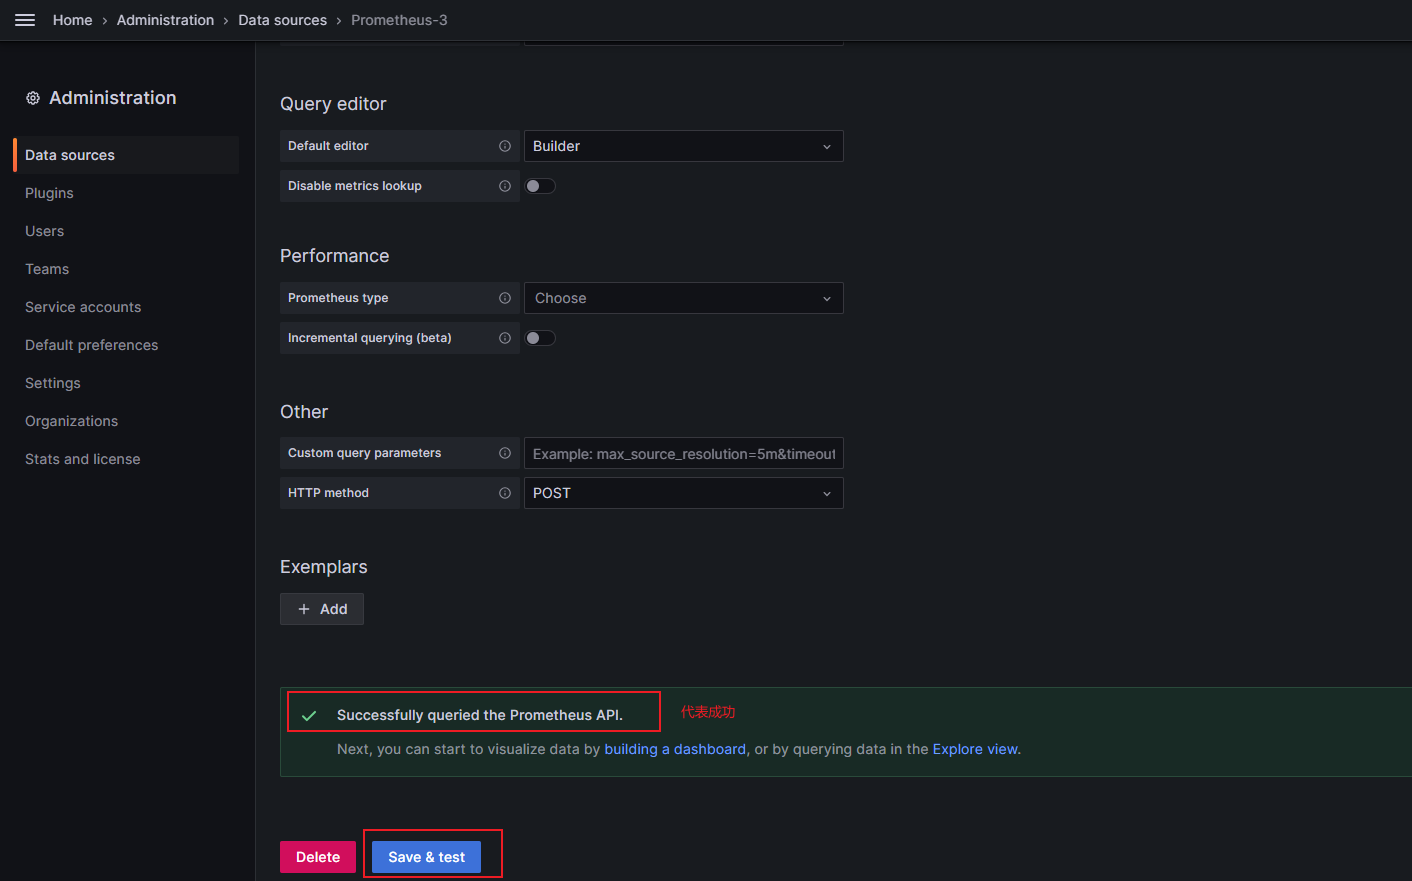
滑动到底部保存
-
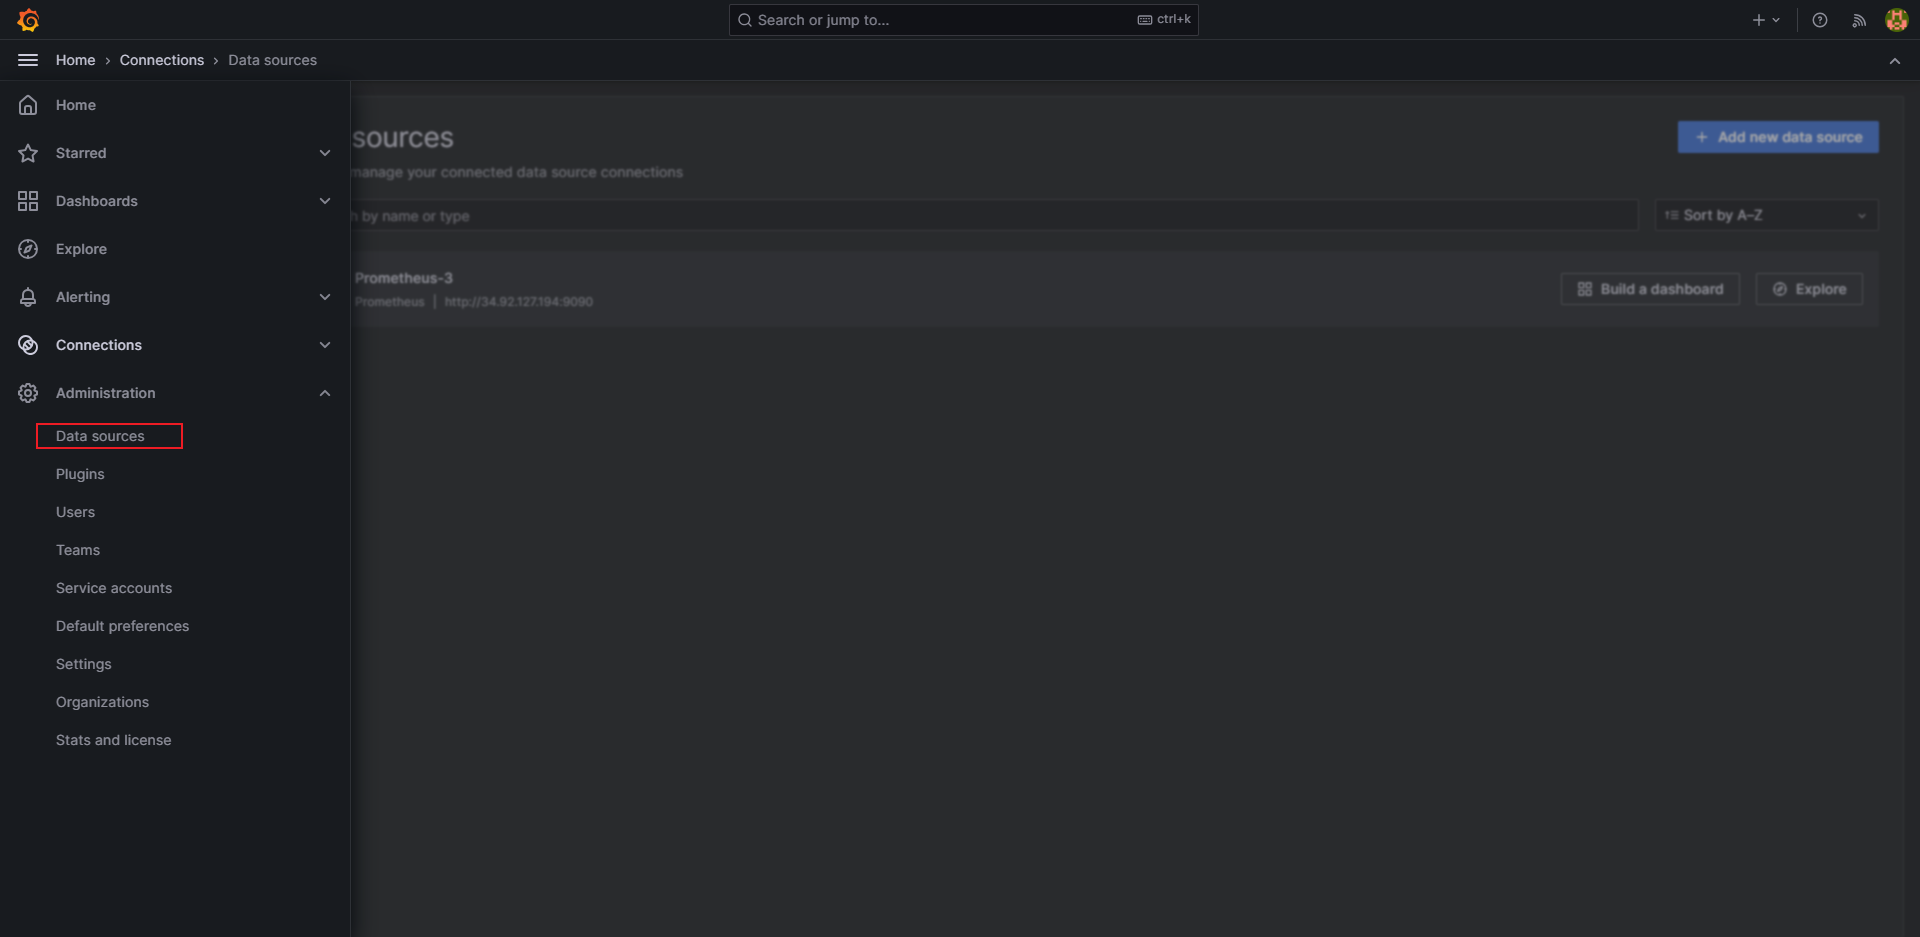
找到我们配置的数据源
-
为该数据源 导入仪表盘,当然你可以用自己创建
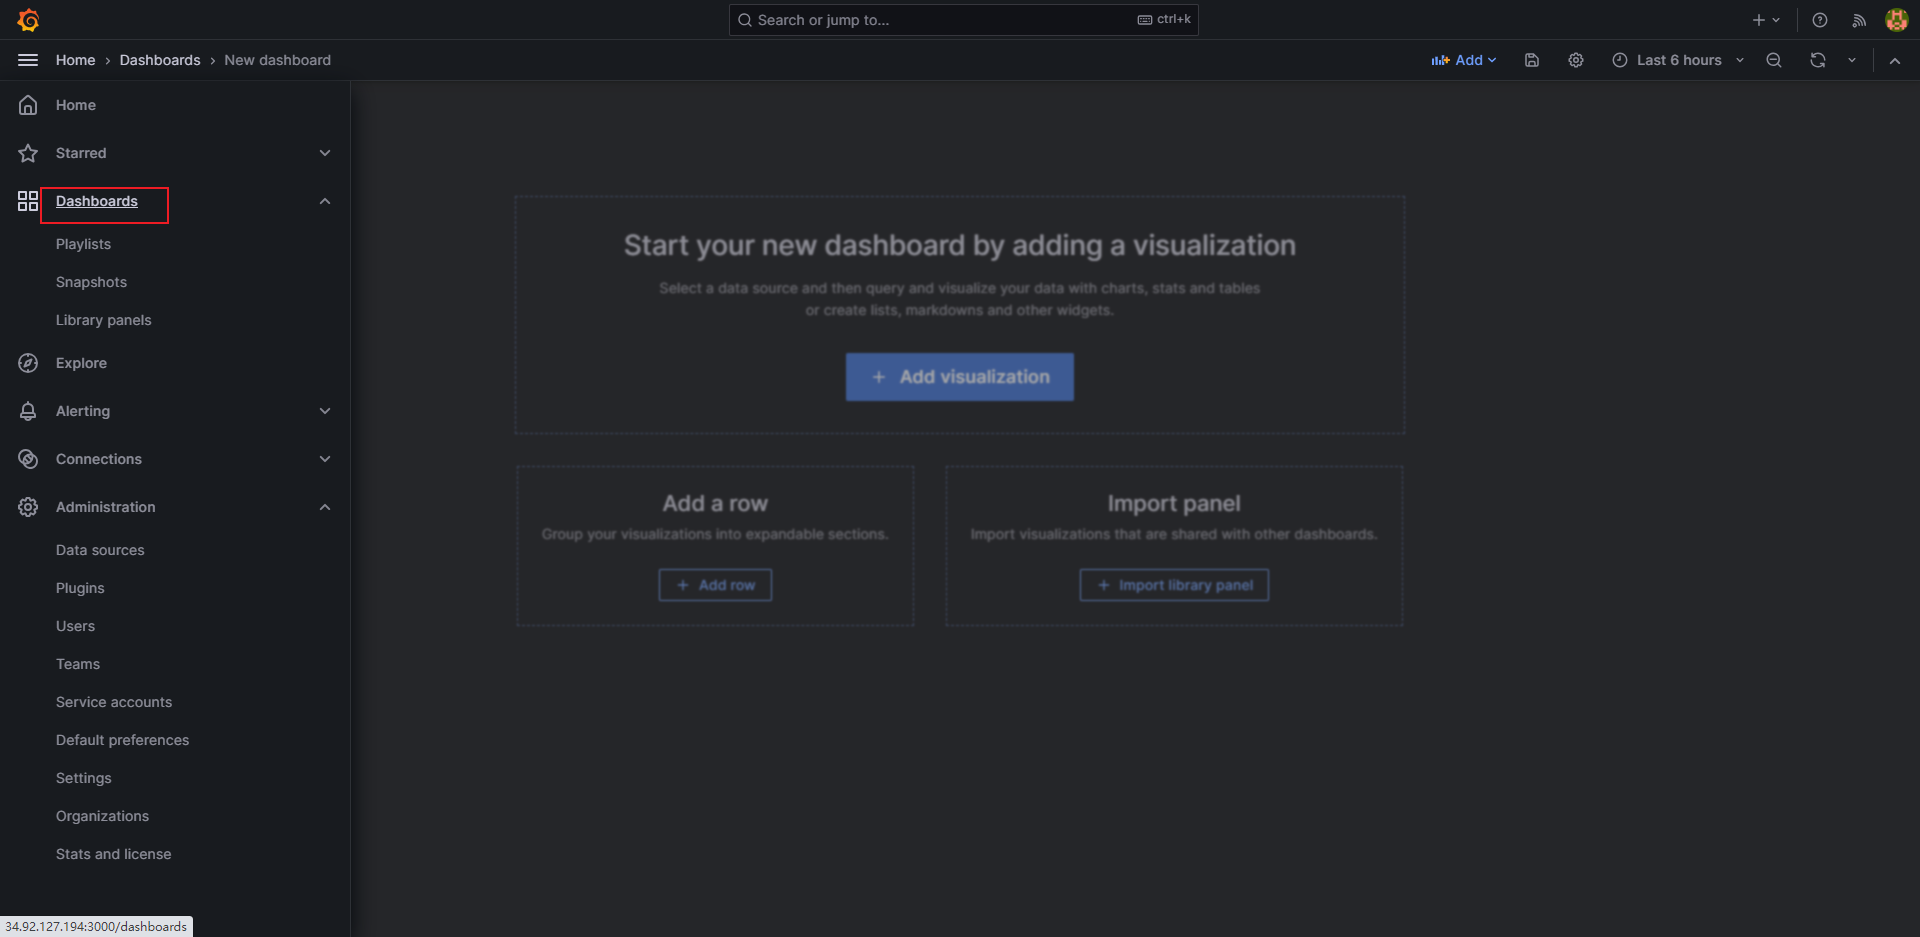
-
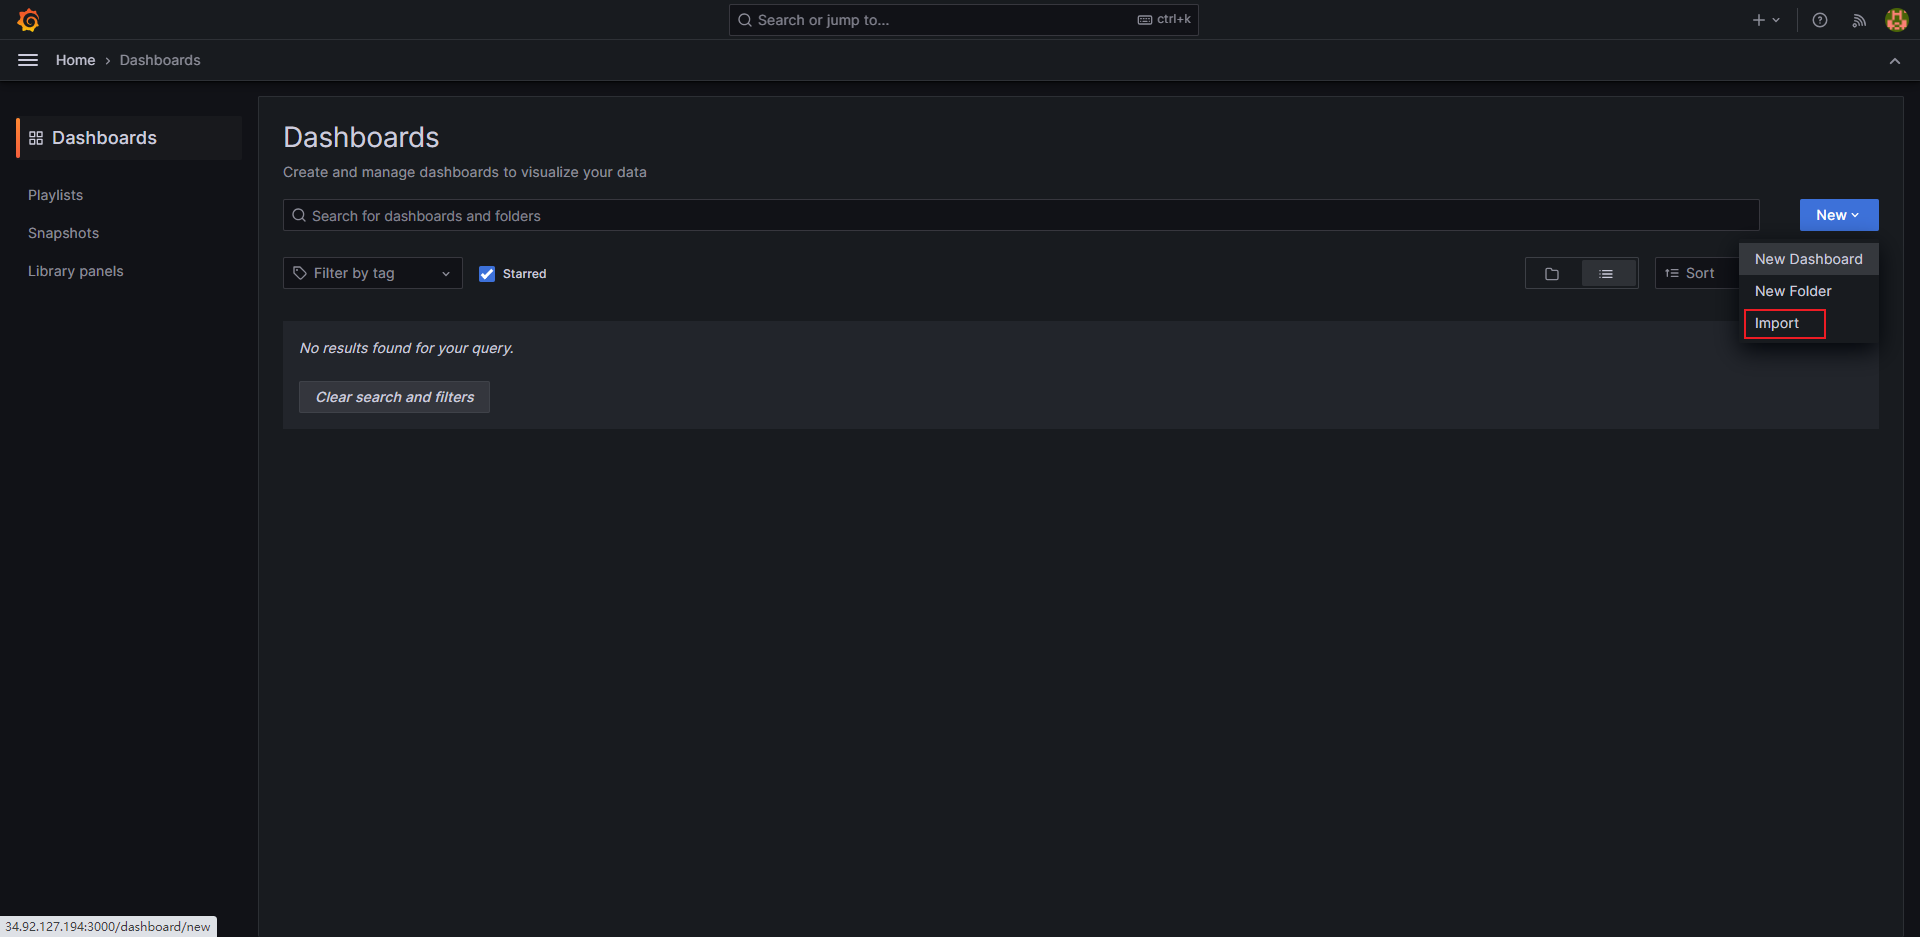
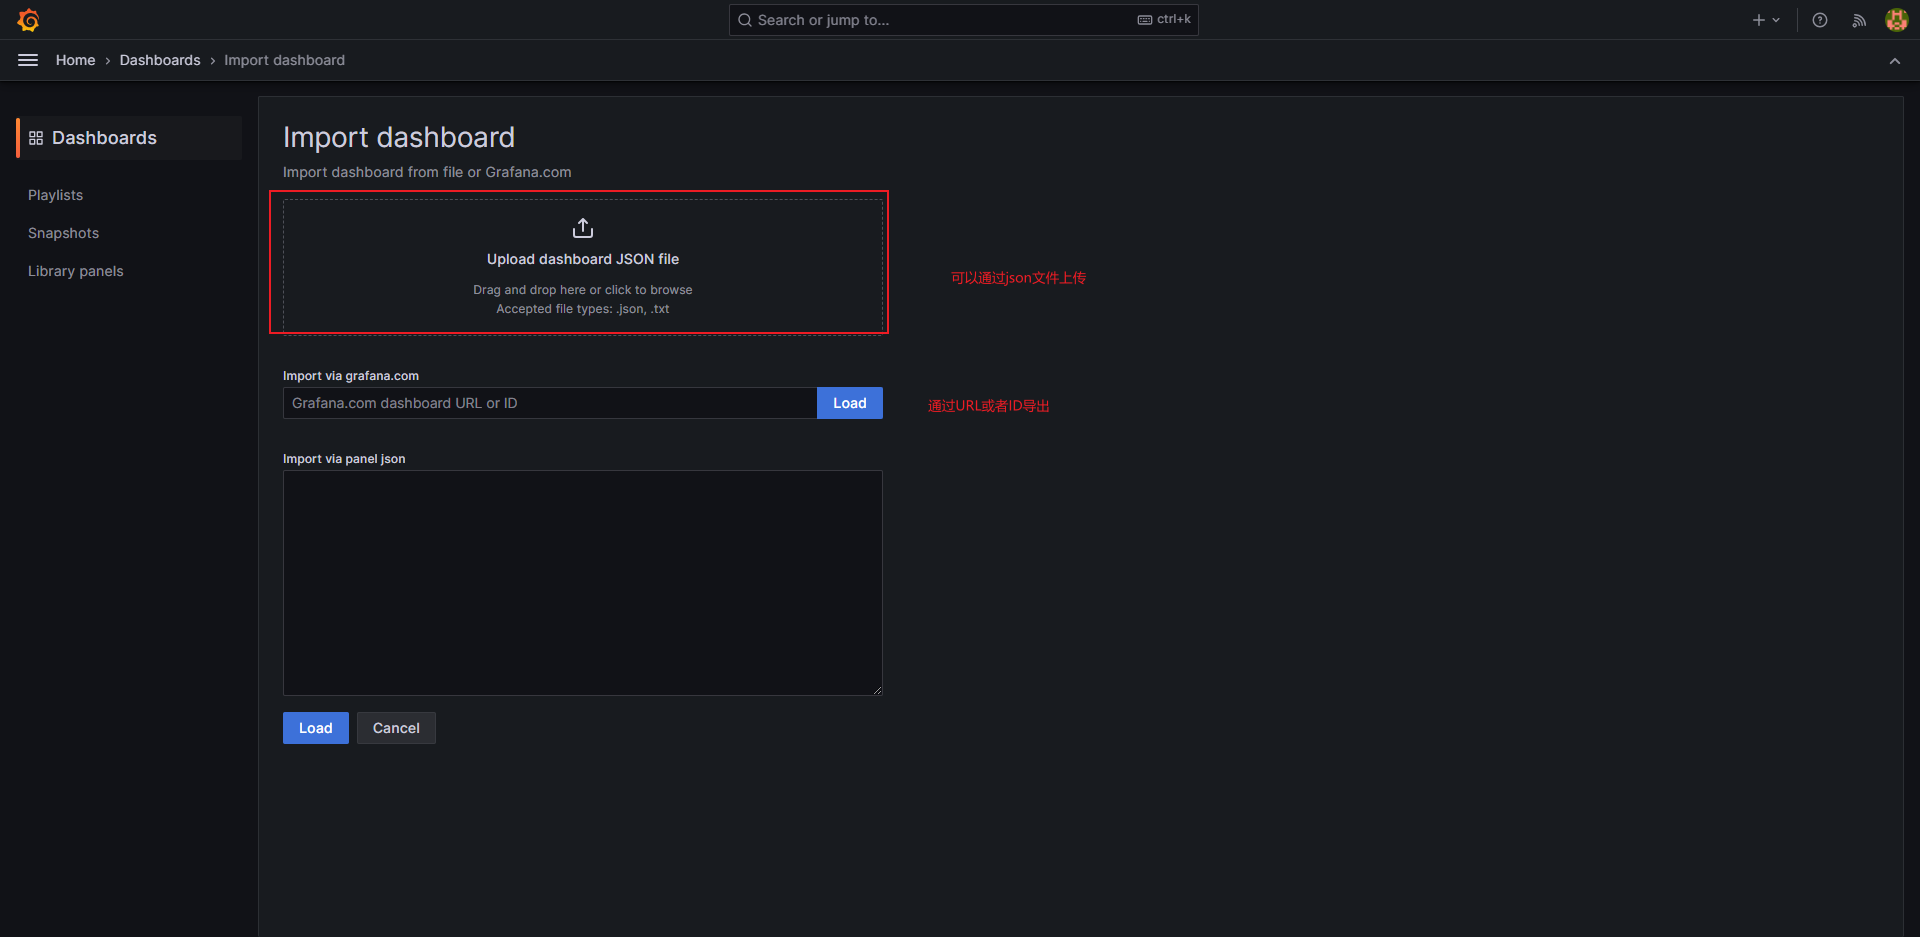
导入仪表盘
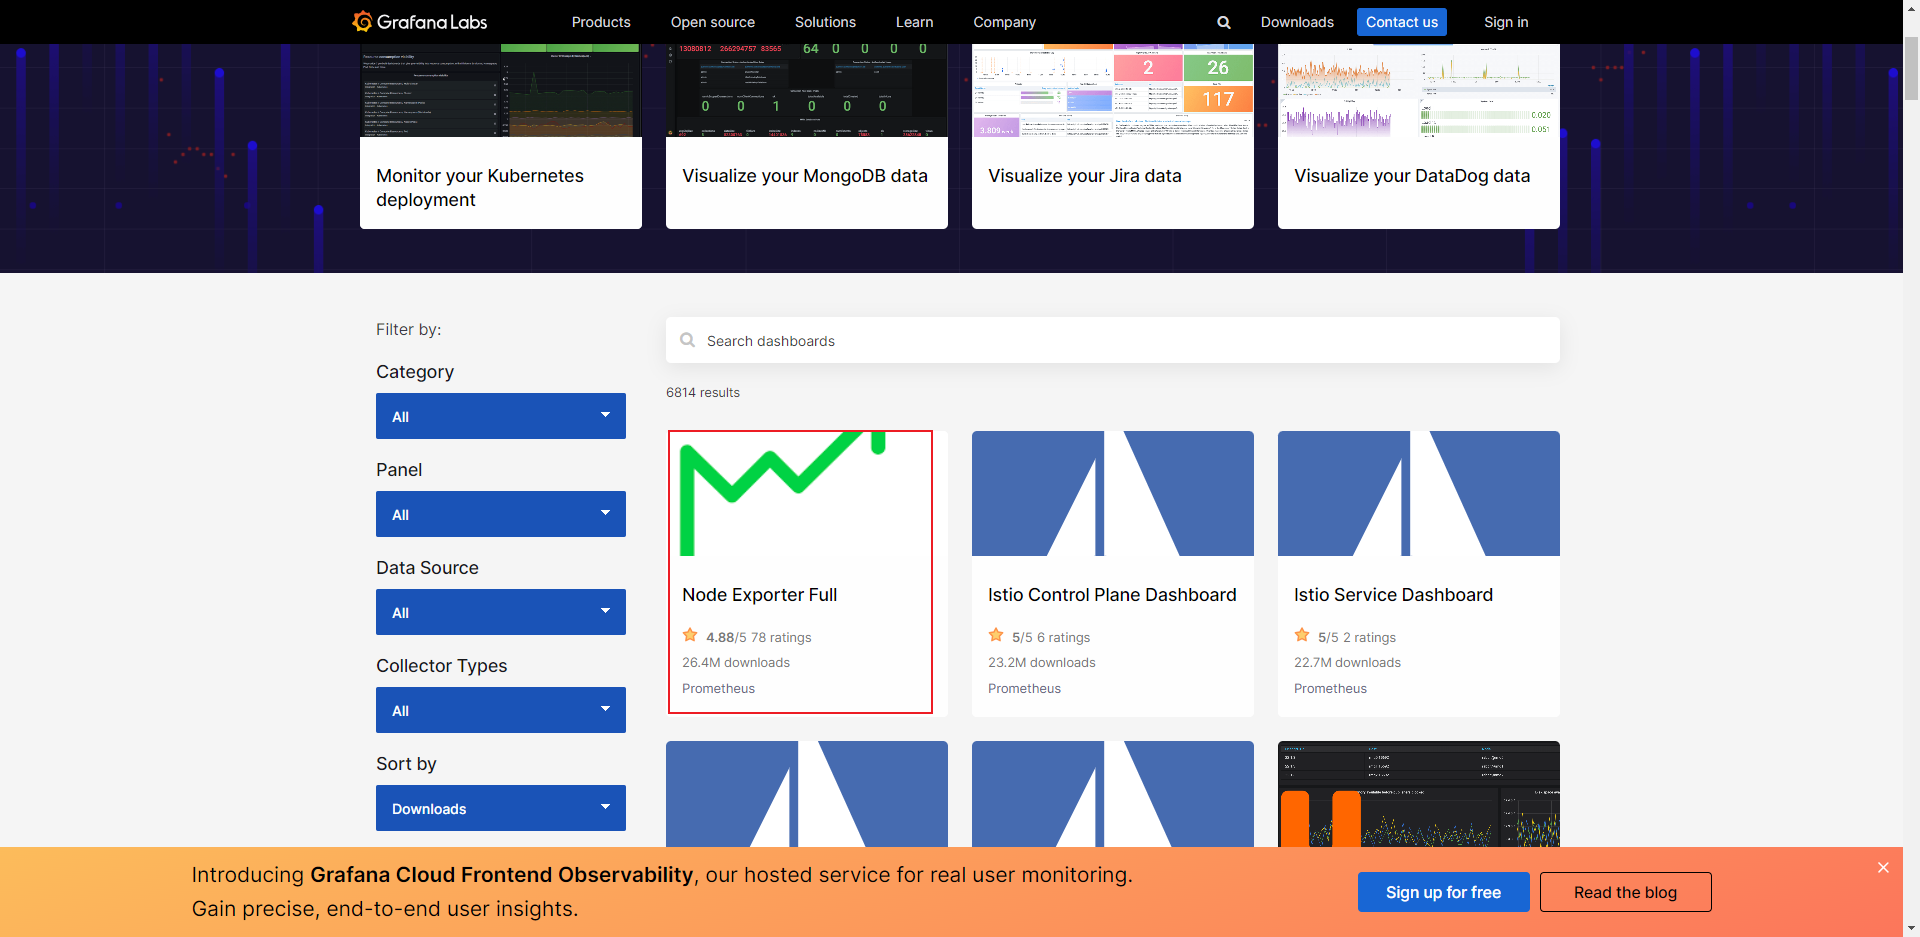
模板网站https://grafana.com/grafana/dashboards/
打开模板网站找到自己喜欢的仪表盘导入即可
因为我们现在只导出了Node_exporter,所以找Node_exporter仪表盘就行了
复制仪表盘id
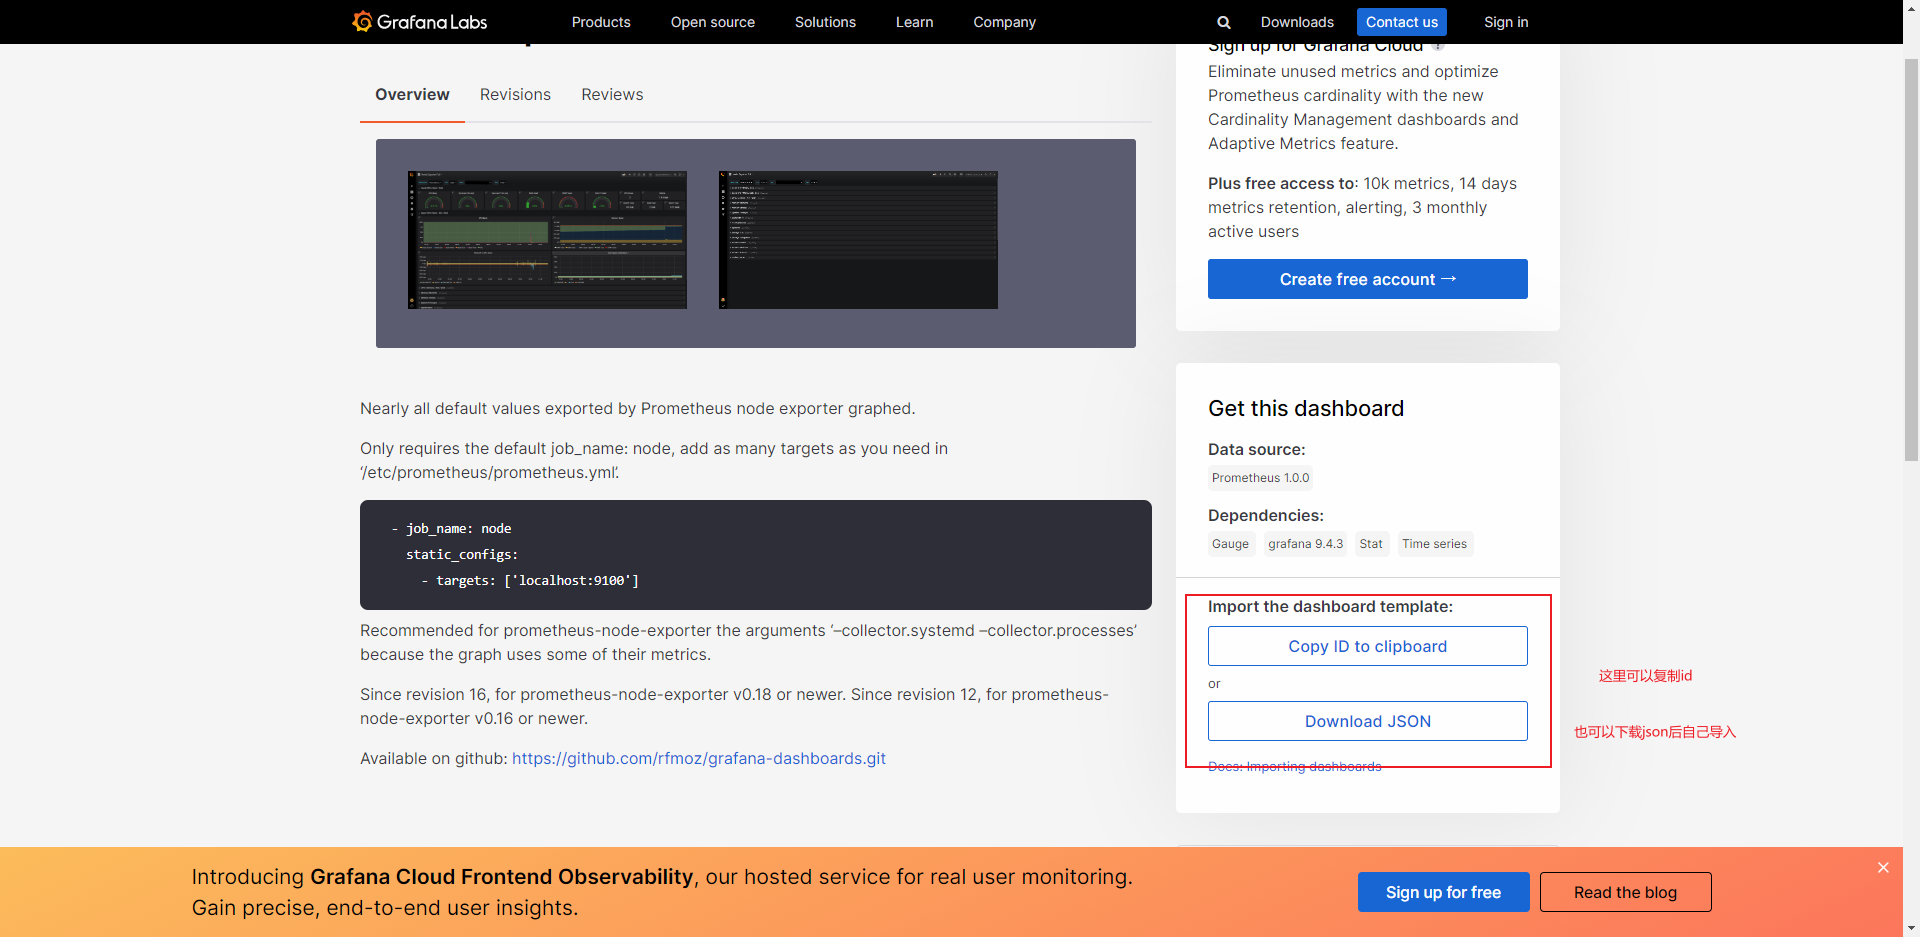
粘贴回来导入

-
为仪表板选择数据源
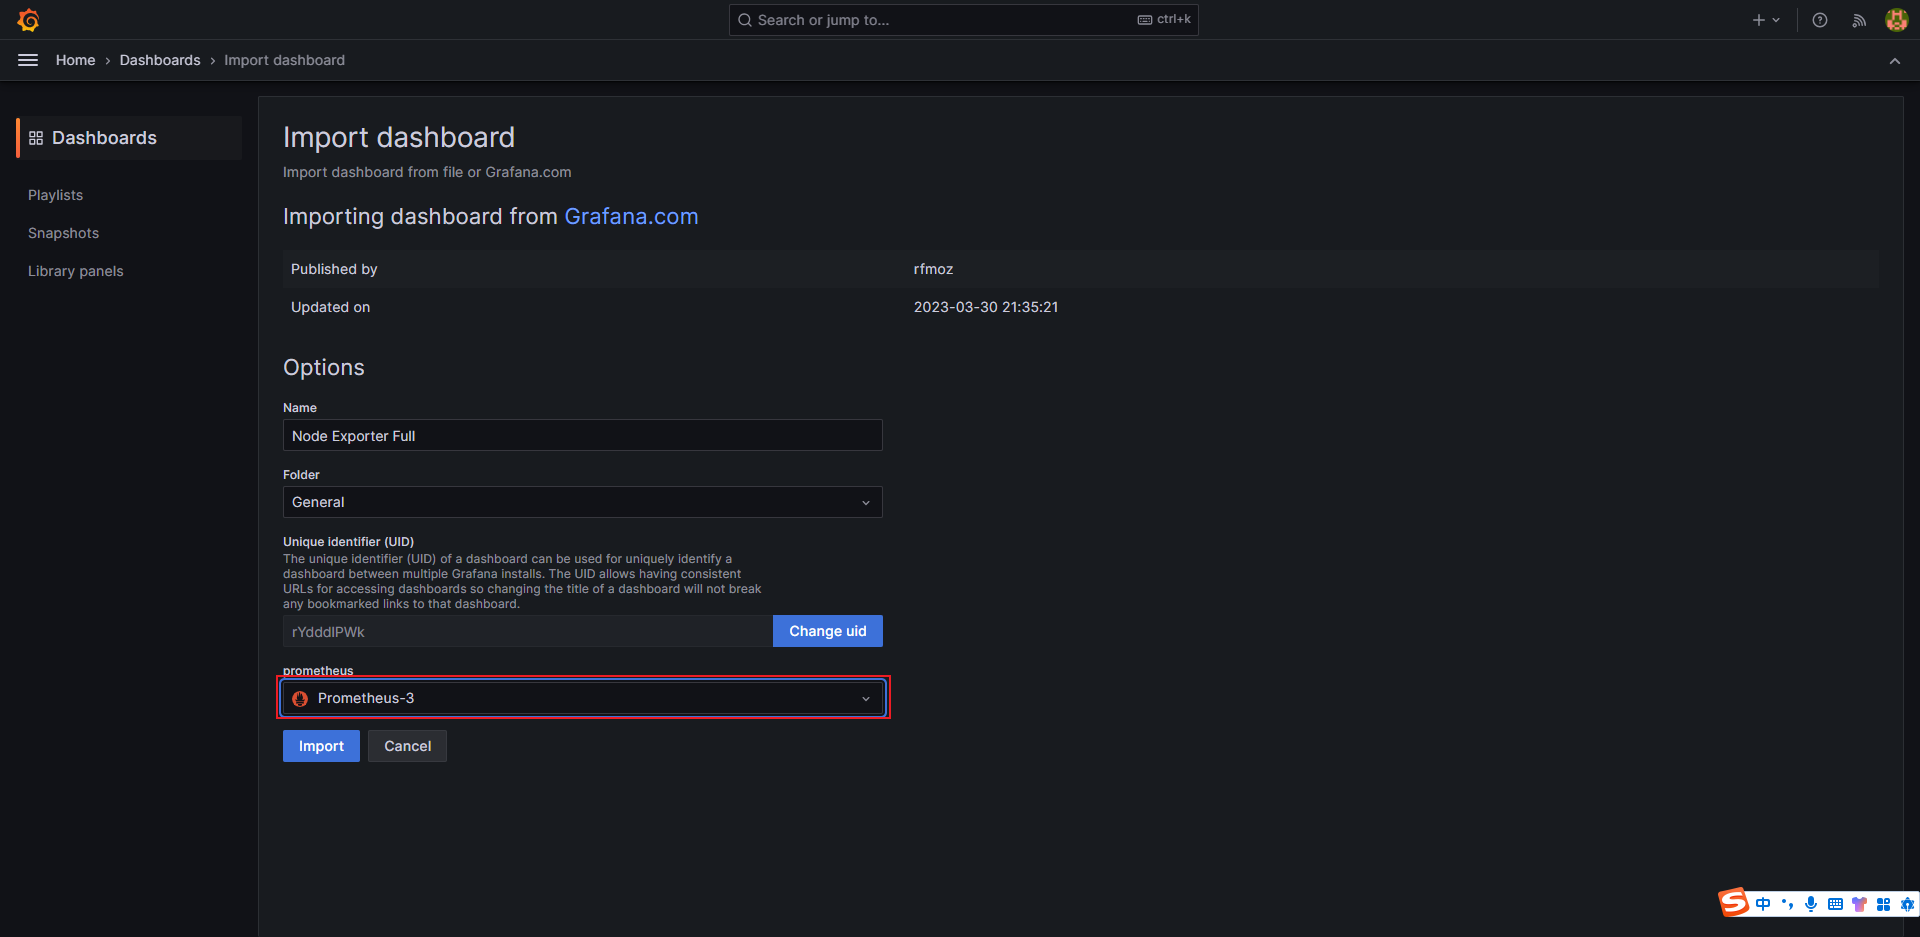
-
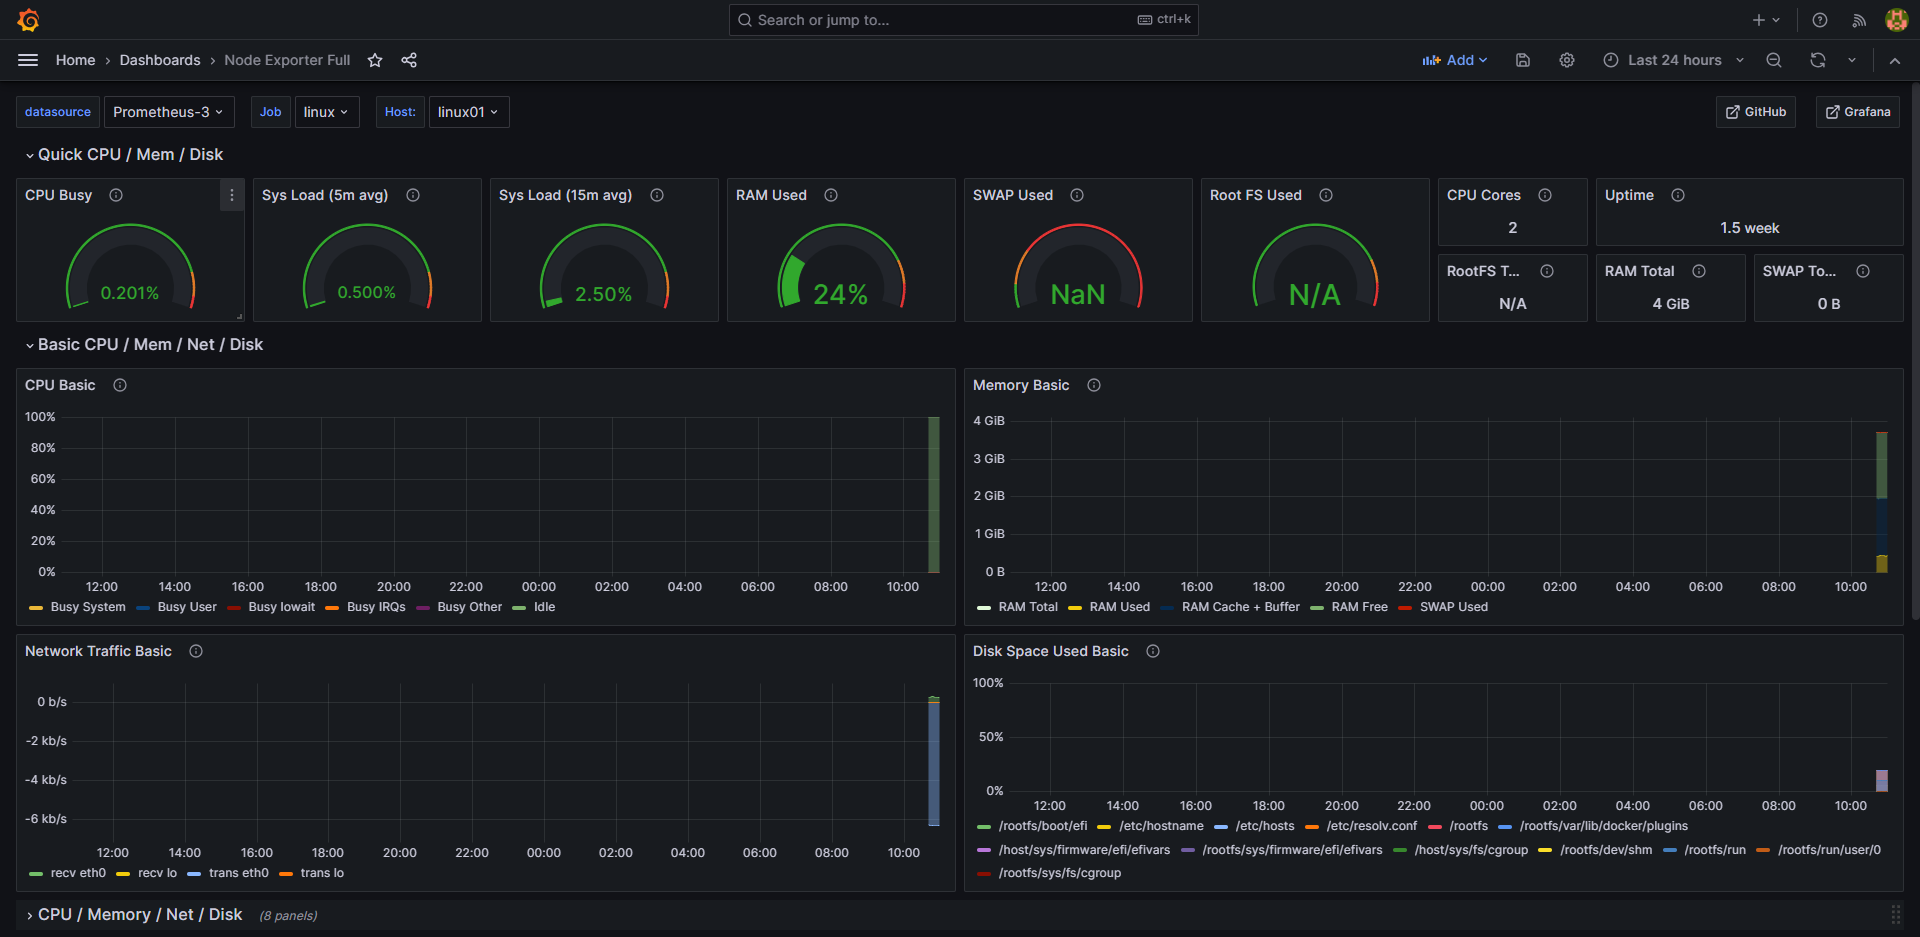
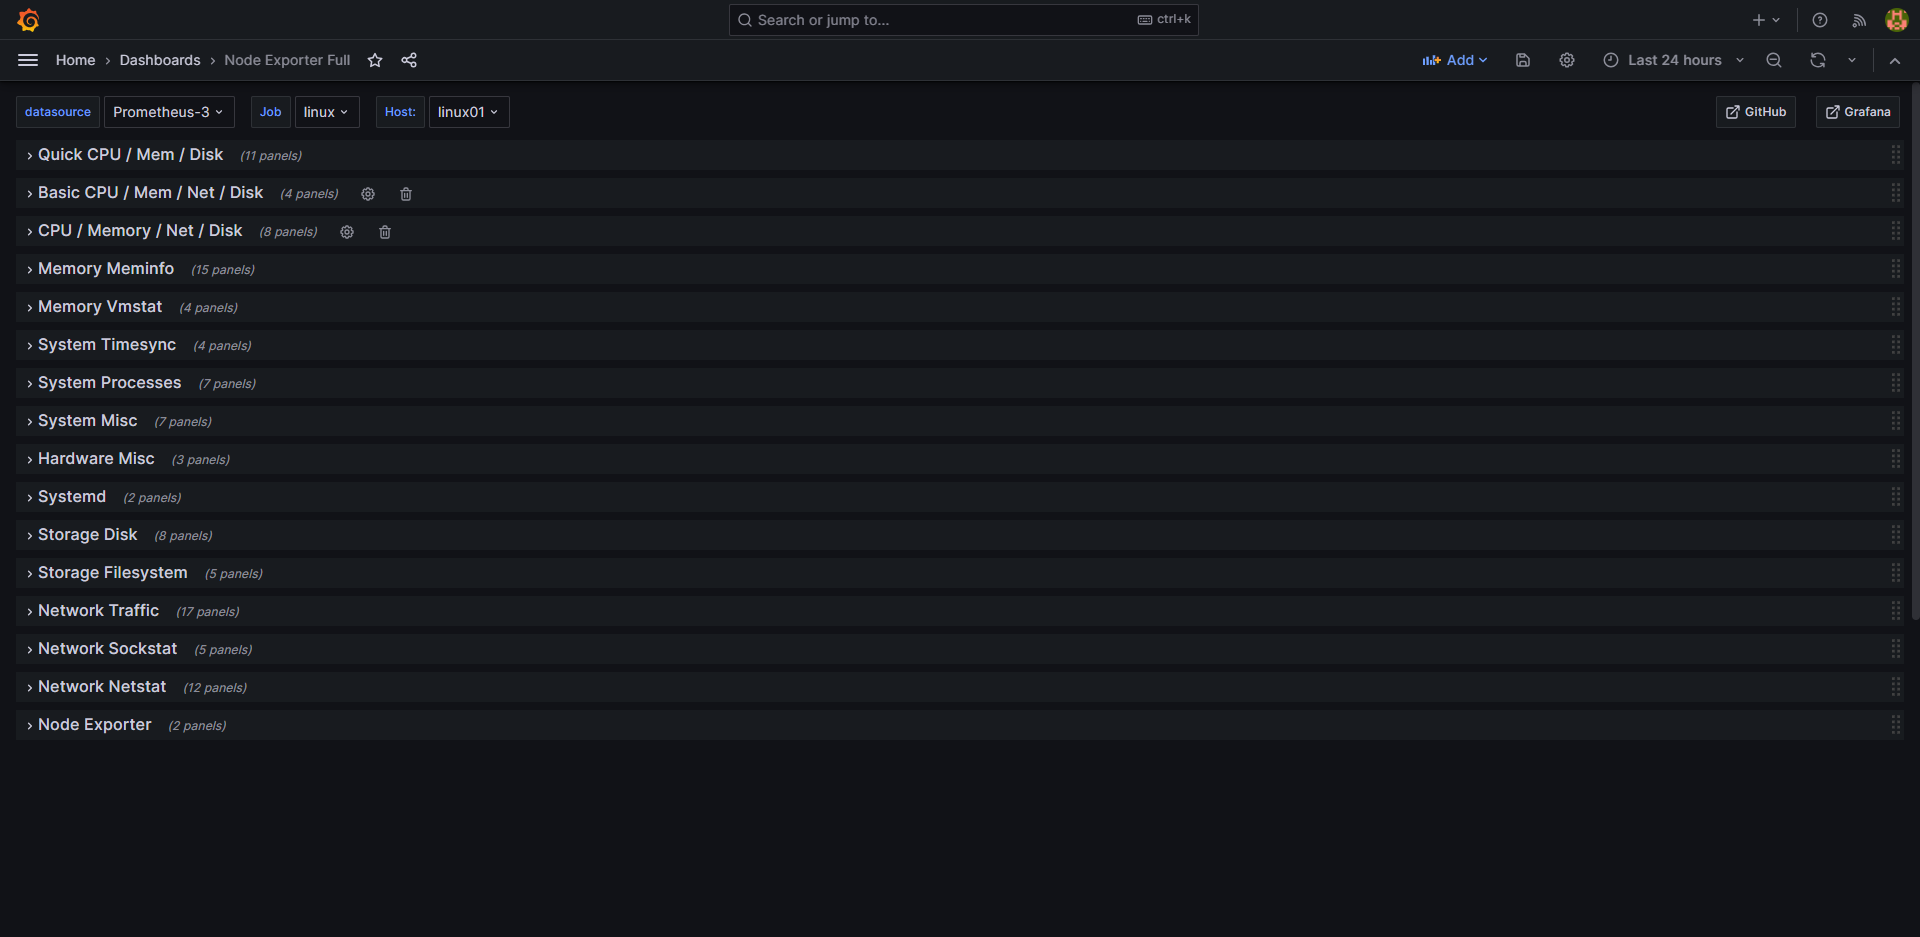
导入成功
6. 配置 Prometheus 监控Mysql
- 我们可以直接在Grafana通过配置数据源的方式监控mysql
- 也可以通过为Prometheus配置mysql_exporter,Grafana通过Prometheus数据(本次采用)
- mysql对应账号一定要开启远程访问
-
下载mysqld_exporter
#下载 wget https://github.com/prometheus/mysqld_exporter/releases/download/v0.13.0/mysqld_exporter-0.13.0.linux-amd64.tar.gz #解压到当前目录 tar -zxvf mysqld_exporter-0.13.0.linux-amd64.tar.gz -
解压
mv mysqld_exporter-0.13.0.linux-amd64 /usr/local/mysql_exporter cd /usr/local/mysql_exporter -
配置
vim /usr/local/mysql_exporter/.my.cnf[client] host=mysql地址 port=3306 user=root password=xxxx -
启动
nohup /usr/local/mysql_exporter/mysqld_exporter --config.my-cnf=/usr/local/mysql_exporter/.my.cnf & -
访问测试http://ip:9104/metrics
-
修改Prometheus主配置文件 参考4.1章节,配置完成cp回去,然后重启Prometheus
  - job_name: mysql
    static_configs:
    - targets: ['ip:9104']         #被监控端的IP地址和端口号(有多个被监控端可用 逗号 隔开)
      labels:
        instance: mysql01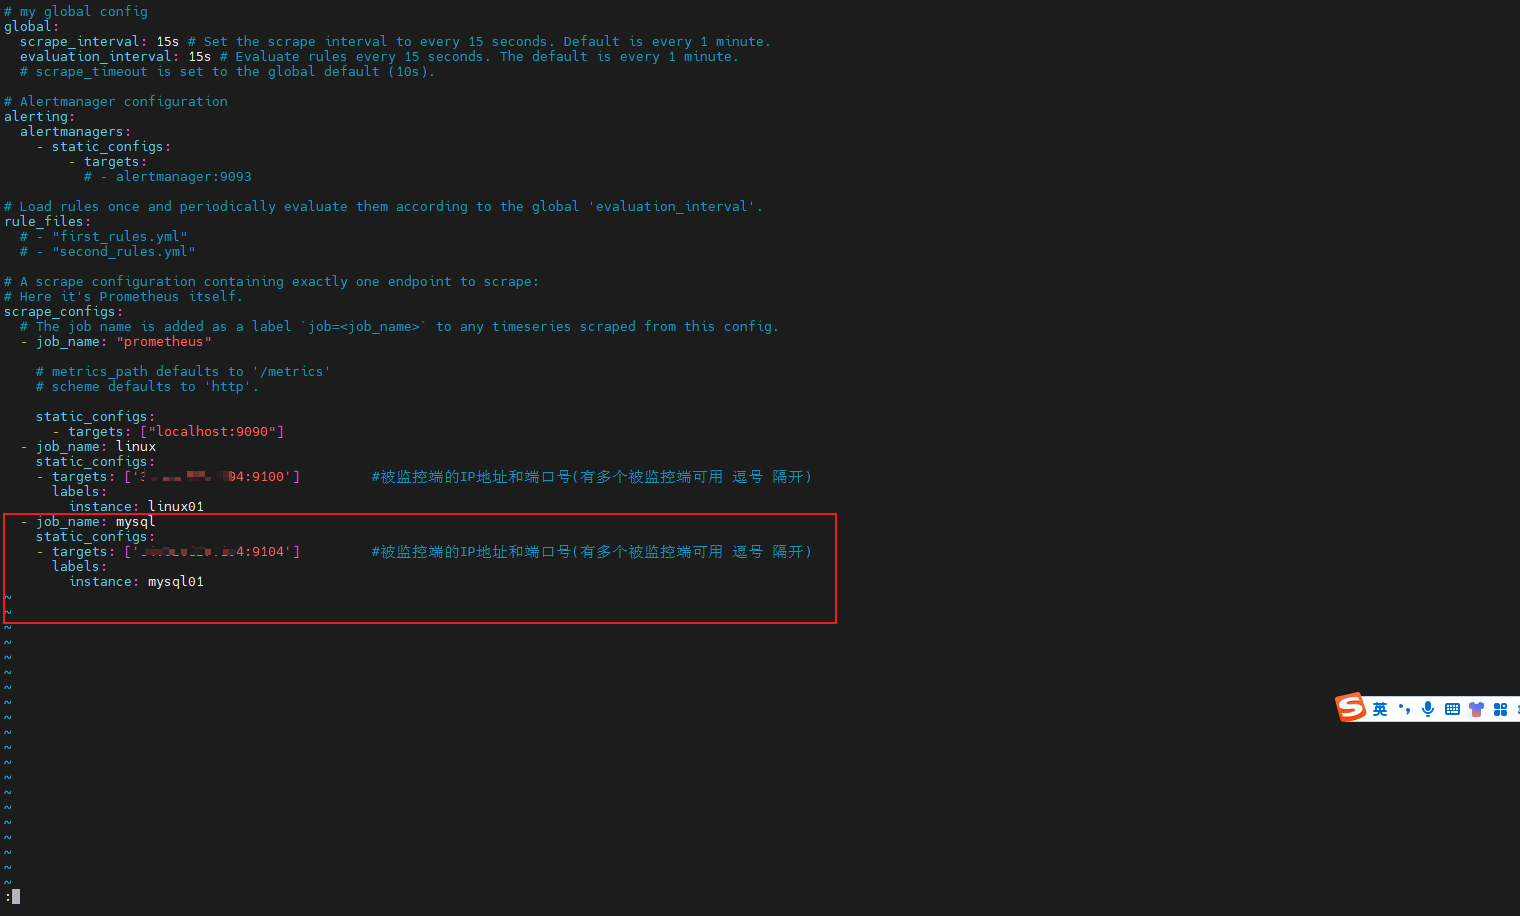
-
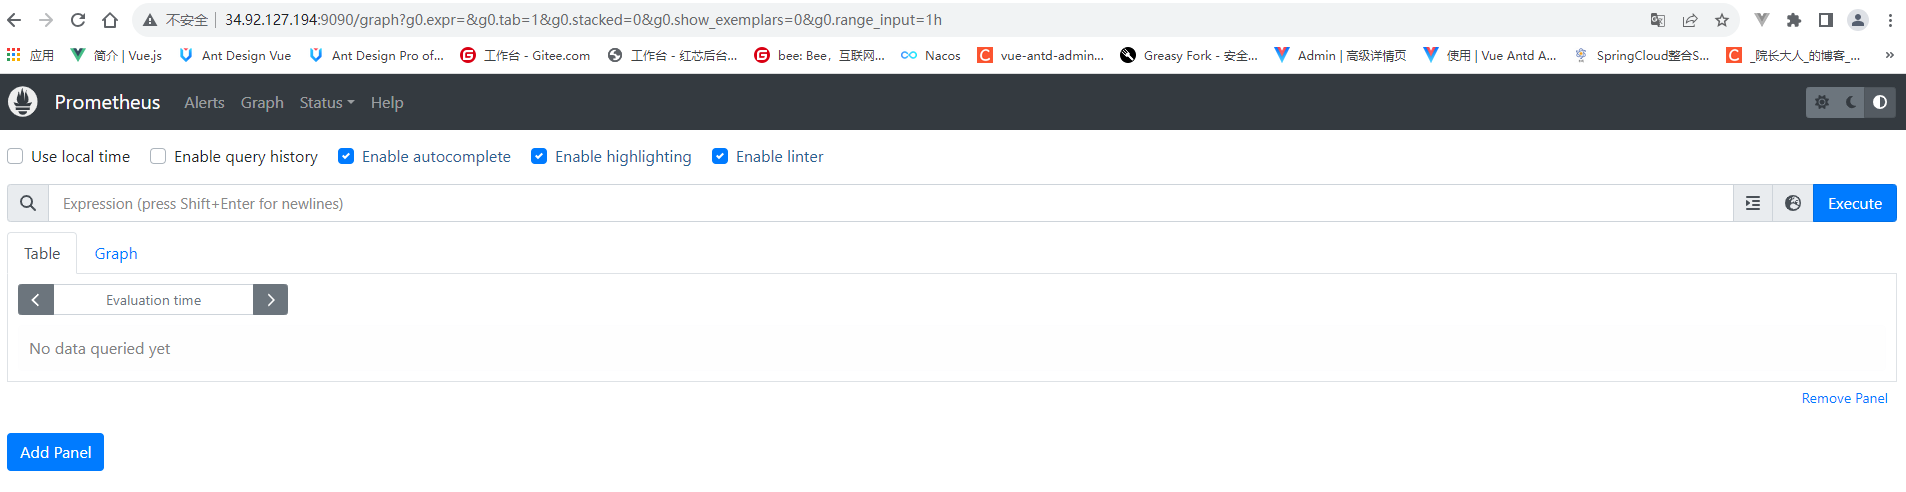
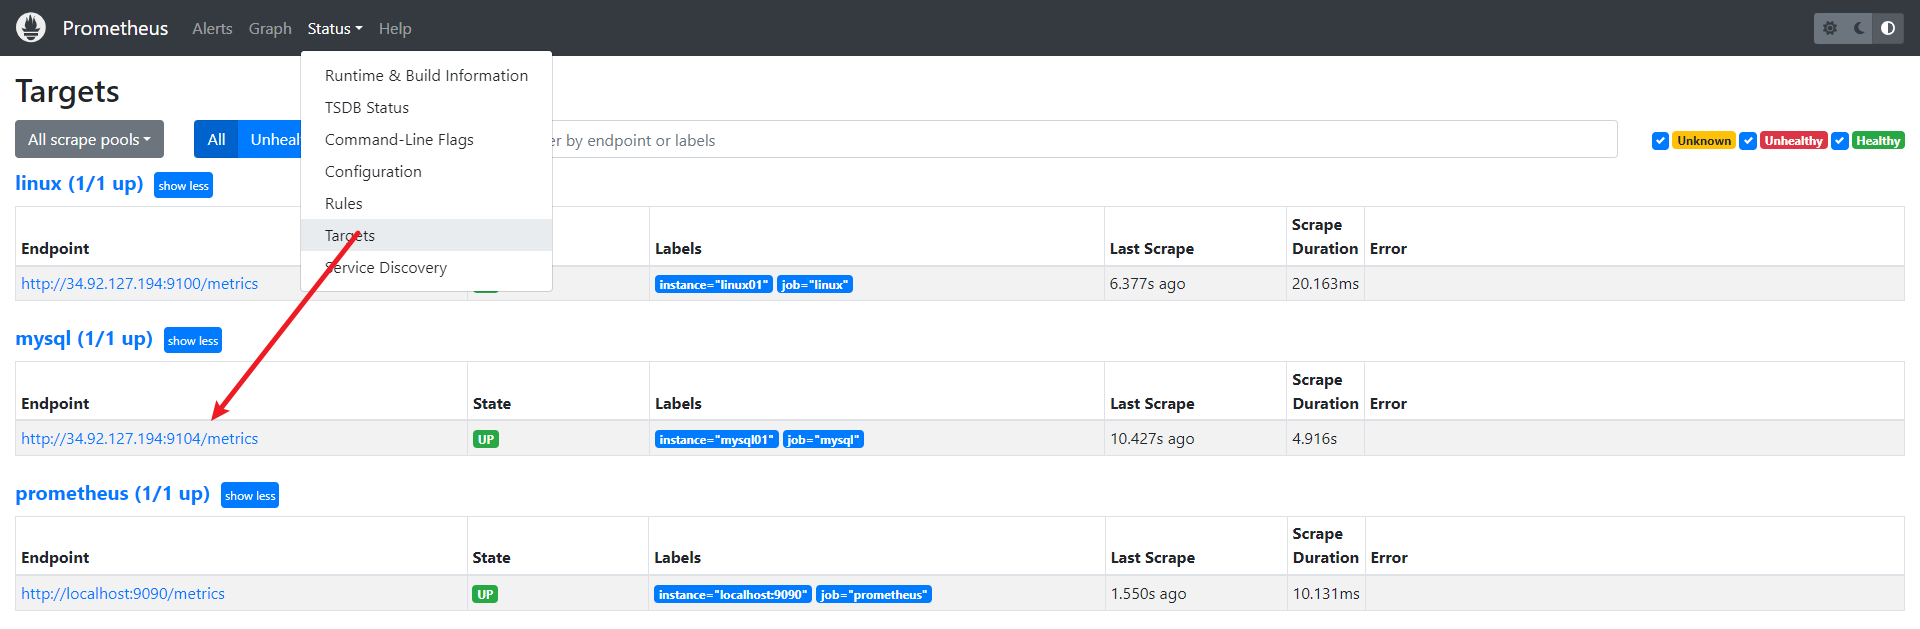
检查Prometheus检测mysql是否成功 http://34.92.127.194:9090/
-
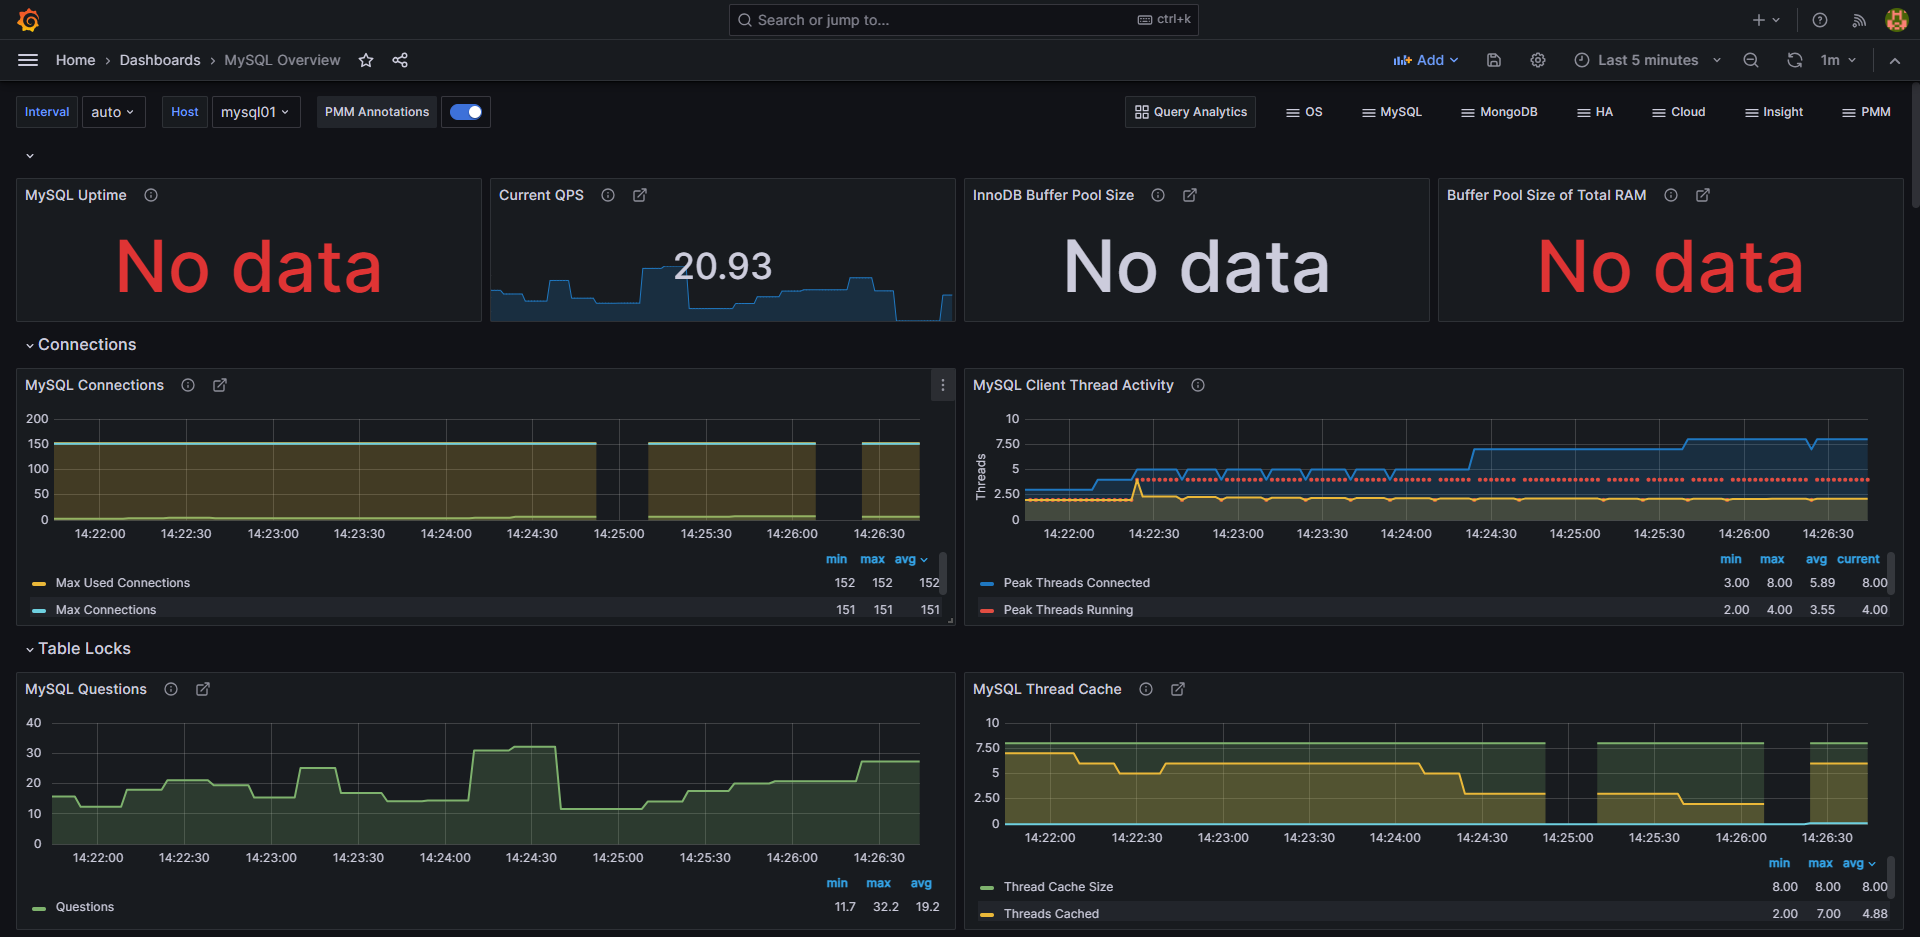
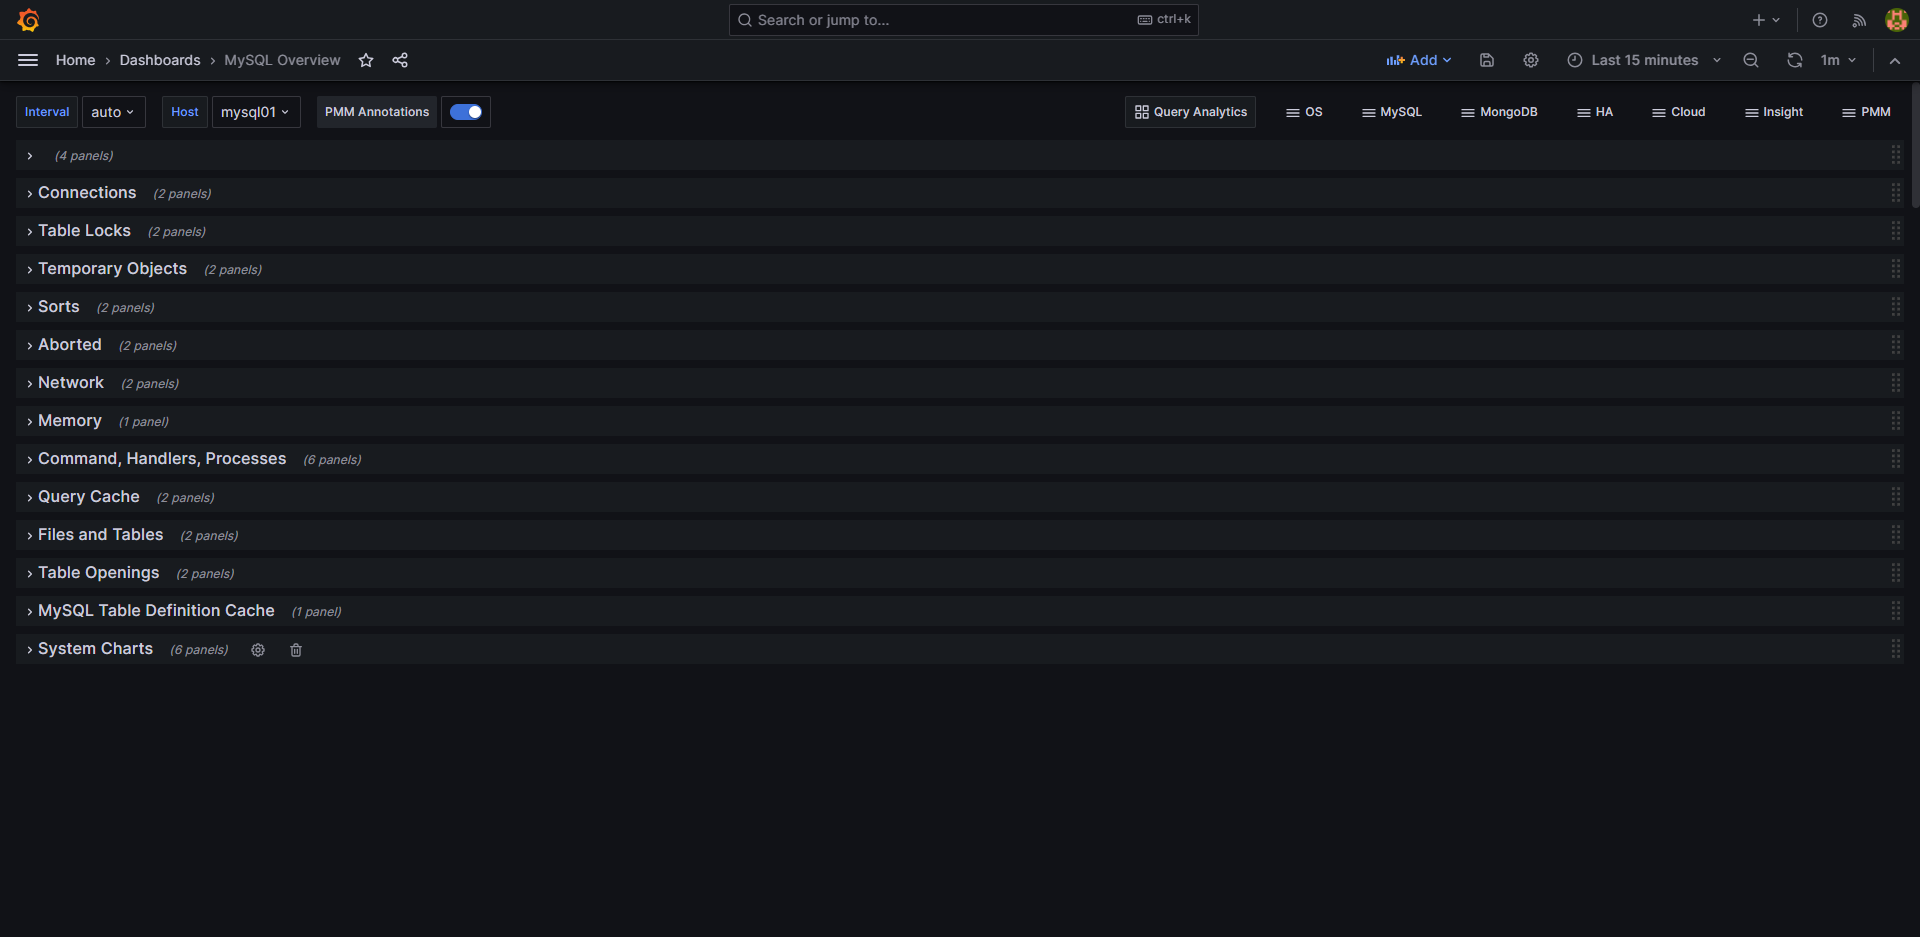
导入mysql 仪表盘
模板网站https://grafana.com/grafana/dashboards/
搜索mysql
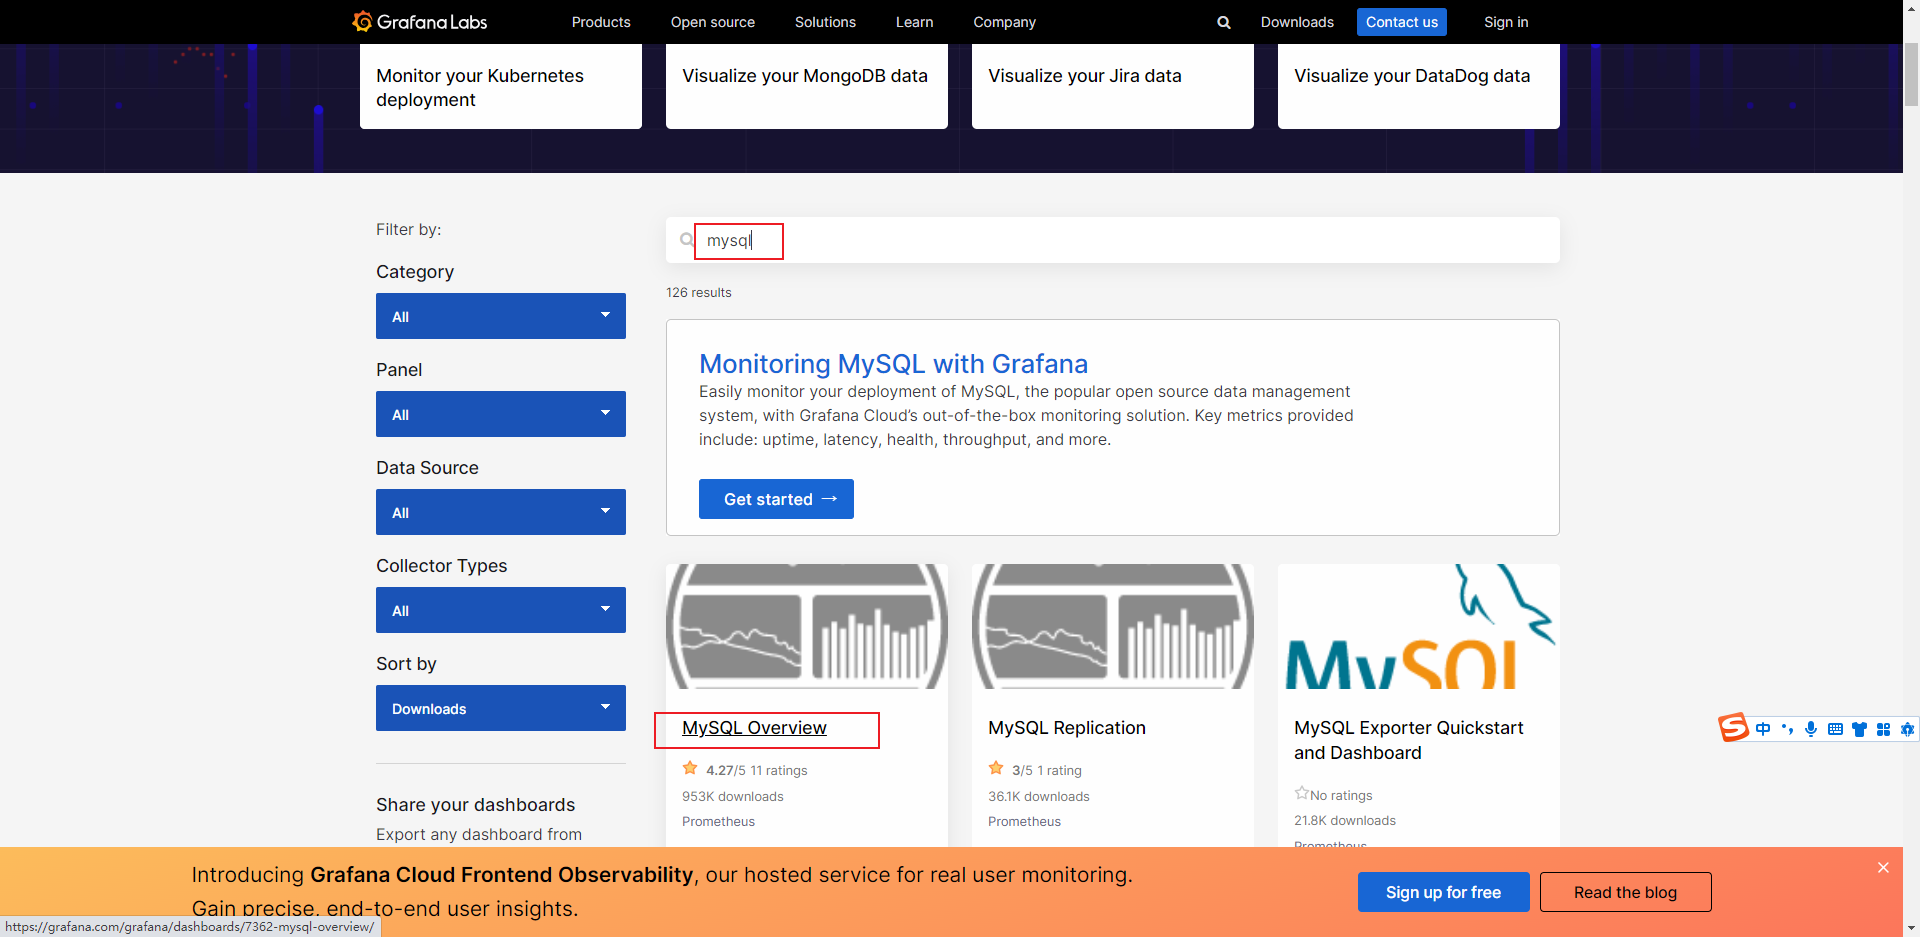
复制id,导入仪表盘,导入方法参照之前导入nodeNode_exporter