Spark MLlib 下的逻辑回归二元分类
训练模型
导入必要的包
import numpy as np
import pyspark
from matplotlib import pyplot as plt
from pyspark.mllib.classification import LogisticRegressionWithSGD
from pyspark.mllib.feature import StandardScaler
from pyspark.mllib.regression import LabeledPoint
from pyspark.mllib.evaluation import BinaryClassificationMetrics
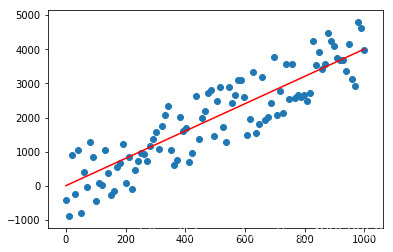
演示回归曲线
x = np.linspace(0,1000,100)
y_t = x*4 + 5
y_r = y_t + np.random.randint(-1000,1000,100)
plt.plot(x,y_t,ls="-",c="r")
plt.scatter(x,y_r)
初始化spark的上下文对象
sc = pyspark.SparkContext(master="local[*]",appName="StumbleuponAnalysis")
准备为数据
def extract_features(fields,categories_dict,end):
    # 加载字段对应的类别id
    category_id = categories_dict[fields[3]]
    # 初始化类别特征集合 全置为0
    category_features = np.zeros(len(categories_dict))
    # 把类别id对应的位置变为1
    category_features[category_id] = 1
    # 初始化数值特征集
    numerical_features = [0.0 if f=="?" else float(f) for f in fields[4:end] ]
    # 将两个特征集合并后返回
    return np.concatenate((category_features,numerical_features))

def parpare_data(sc,scale):
    # 读入文件
    raw_lines_and_header = sc.textFile("file:/home/zh123/.jupyter/workspace/stumbleupon/train.tsv")
    # 取文件头部数据
    header_line = raw_lines_and_header.first()
    # 将数据去掉头部
    raw_non_header_data = raw_lines_and_header.filter(lambda l:l!=header_line)
    # 去掉引号
    raw_non_quot_lines = raw_non_header_data.map(lambda l:l.replace("\"",""))
    # 每行以 “\t“ 分割成多个字段
    raw_data = raw_non_quot_lines.map(lambda l:l.split("\t"))
    print("数据长度:",raw_data.count())
    # 类别字典 将文本类别映射为数值
    categories_dict = raw_data.map(lambda field:field[3]).distinct().zipWithIndex().collectAsMap()
    # 标签
    label_rdd = raw_data.map(lambda fields:float(fields[-1]))
    # 特征
    feature_rdd = raw_data.map(lambda fields:extract_features(fields,categories_dict,len(fields)-1))
    #============================vvvv 将特征数据标准化 vvvv============================================
    # 初始化一个标准执行器
    std_scaler = StandardScaler(withMean=True,withStd=True).fit(feature_rdd)
    # 将原始特征数据转换为标准特征
    scaler_features = std_scaler.transform(feature_rdd)
    # 压缩为(标签,特征)
    label_point = label_rdd.zip(scaler_features)
    # 构建LabelPoint
    label_point_rdd = label_point.map(lambda r:LabeledPoint(r[0],r[1]))
    # 根据传入的比例返回训练集,验证集,测试集, 类别映射字典
    return label_point_rdd.randomSplit(scale),categories_dict
模型评估
定义评估模型AUC值的函数
def evaluate_model(model,validation_data):
    # 根据传入的验证集通过模型产生 预测集
    predict = model.predict(validation_data.map(lambda p:p.features)).map(lambda x:float(x))
    # 将预测集和标签集 压缩成(预测值,标签值)
    predict_and_label = predict.zip(validation_data.map(lambda p:p.label))
    # 初始化二元分类矩阵
    metrics = BinaryClassificationMetrics(predict_and_label)
    # 返回AUC值,ROC曲线下的面积
    return metrics.areaUnderROC
定义综合模型评估函数
import time
def train_evaluate_model(train_data,validation_data,numIterations,stepSize,miniBatchFraction):
    # 记录模型训练开始时间
    start_time = time.time()
    # 训练模型
    model = LogisticRegressionWithSGD.train(train_data,numIterations,stepSize,miniBatchFraction)
    # 训练模型耗时
    duration = time.time() - start_time
    # 计算模型的AUC值
    AUC = evaluate_model(model,validation_data)
    return (model,AUC,duration,numIterations,stepSize,miniBatchFraction)
# train_data,validation_data,test_data = parpare_data(sc,scale=[8,1,1])
# train_evaluate_model(train_data,test_data,1,100,0.7)
定义评估参数的函数
import pandas as pd
def evaluate_parameter(train_data,validation_data,numIterationsList,stepSizeList,miniBatchFractionList):
    # 评测矩阵
    metrics = []
    # 列索引
    columns = ["Model","AUC","Duration","numIterations","stepSize","miniBatchFraction"]
    for numIterations in numIterationsList:
        for stepSize in stepSizeList:
            for miniBatchFraction in miniBatchFractionList:
                # 在评测矩阵中记录结果
                metrics.append(train_evaluate_model(train_data,validation_data,numIterations,stepSize,miniBatchFraction))
    # 判断长度大于1的作为自变量,将其作为行索引
    if(len(numIterationsList) > 1):
        return pd.DataFrame(metrics,index=numIterationsList,columns=columns)
    elif(len(stepSizeList) > 1):
        return pd.DataFrame(metrics,index=stepSizeList,columns=columns)
    elif(len(miniBatchFractionList)>1):
        return pd.DataFrame(metrics,index=miniBatchFractionList,columns=columns)
    else:
        # 默认为数字索引
        return pd.DataFrame(metrics,index=[0],columns=columns)
获取训练数据,验证数据,测试数据
((train_data,validation_data,test_data),categories_dict) = parpare_data(sc,scale=[8,1,1])
# 将所有数据持久化到内存当中加快模型训练速度
train_data.persist()
validation_data.persist()
test_data.persist()
数据长度: 7395


PythonRDD[4739] at RDD at PythonRDD.scala:52
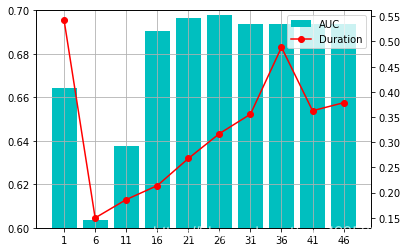
评估 numIterations参数影响
训练模型并获取评估参数表
evaluate_table = evaluate_parameter(train_data,validation_data,[i for i in range(1,50,5)],[10],[1])
evaluate_table
| Model | AUC | Duration | numIterations | stepSize | miniBatchFraction | |
|---|---|---|---|---|---|---|
| 1 | (weights=[0.6677226910837364,-0.69951944405741... | 0.664205 | 0.542155 | 1 | 10 | 1 |
| 6 | (weights=[0.28810190368216665,-0.3890579409906... | 0.603375 | 0.149749 | 6 | 10 | 1 |
| 11 | (weights=[0.2982103093226861,-0.30009276222335... | 0.637453 | 0.186136 | 11 | 10 | 1 |
| 16 | (weights=[0.2590246366263148,-0.27478234116180... | 0.690569 | 0.213902 | 16 | 10 | 1 |
| 21 | (weights=[0.25133027462275814,-0.2542369719546... | 0.696628 | 0.267709 | 21 | 10 | 1 |
| 26 | (weights=[0.24840617513903634,-0.2527605271207... | 0.697719 | 0.317076 | 26 | 10 | 1 |
| 31 | (weights=[0.2480626698782132,-0.25281749529624... | 0.693588 | 0.355656 | 31 | 10 | 1 |
| 36 | (weights=[0.24788753296317756,-0.2530393653347... | 0.693588 | 0.488446 | 36 | 10 | 1 |
| 41 | (weights=[0.24788753296317756,-0.2530393653347... | 0.693588 | 0.362525 | 41 | 10 | 1 |
| 46 | (weights=[0.24788753296317756,-0.2530393653347... | 0.693588 | 0.378403 | 46 | 10 | 1 |
根据评估参数表绘制图像
fig = plt.figure()
ax = fig.add_subplot(111)
ax.bar(evaluate_table.index,evaluate_table["AUC"],color="c",tick_label=evaluate_table.index,label="AUC",width=4)
ax.set_ylim(0.6,0.7)
ax2 = ax.twinx()
ax2.plot(evaluate_table.index,evaluate_table["Duration"],c="r",label="Duration",marker="o")
ax.grid()
fig.legend(loc=1, bbox_to_anchor=(1,1), bbox_transform=ax.transAxes)
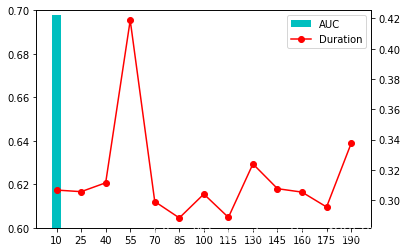
评估 stepSize 参数的影响
训练模型并获取评估参数表
evaluate_table = evaluate_parameter(train_data,validation_data,[26],[i for i in range(10,200,15)],[1])
evaluate_table
| Model | AUC | Duration | numIterations | stepSize | miniBatchFraction | |
|---|---|---|---|---|---|---|
| 10 | (weights=[0.24840617513903634,-0.2527605271207... | 0.697719 | 0.306683 | 26 | 10 | 1 |
| 25 | (weights=[0.40103746760777653,-0.4924966686183... | 0.591412 | 0.305612 | 26 | 25 | 1 |
| 40 | (weights=[0.5409425093445586,-0.77344879343874... | 0.564893 | 0.311465 | 26 | 40 | 1 |
| 55 | (weights=[0.6844234097438462,-1.09699570420703... | 0.559457 | 0.418840 | 26 | 55 | 1 |
| 70 | (weights=[0.8379207450635585,-1.43000712772985... | 0.557723 | 0.299107 | 26 | 70 | 1 |
| 85 | (weights=[1.0323510305921046,-1.76105166506314... | 0.571635 | 0.288278 | 26 | 85 | 1 |
| 100 | (weights=[1.313234120315815,-2.091223074965485... | 0.590554 | 0.304034 | 26 | 100 | 1 |
| 115 | (weights=[1.5106494358271485,-2.37554034126727... | 0.590554 | 0.288630 | 26 | 115 | 1 |
| 130 | (weights=[1.6808460801490464,-2.64560901166279... | 0.586638 | 0.323949 | 26 | 130 | 1 |
| 145 | (weights=[1.846760000240688,-2.914826089181457... | 0.585547 | 0.307586 | 26 | 145 | 1 |
| 160 | (weights=[2.0073226982616266,-3.18046915476317... | 0.581202 | 0.305315 | 26 | 160 | 1 |
| 175 | (weights=[2.1580796544605683,-3.43464112632351... | 0.570992 | 0.295500 | 26 | 175 | 1 |
| 190 | (weights=[2.295776697917227,-3.674935300385708... | 0.565770 | 0.337451 | 26 | 190 | 1 |
根据评估参数表绘制图像
fig = plt.figure()
ax = fig.add_subplot(111)
ax.bar(evaluate_table.index,evaluate_table["AUC"],color="c",tick_label=evaluate_table.index,label="AUC",width=6)
ax.set_ylim(0.6,0.7)
ax2 = ax.twinx()
ax2.plot(evaluate_table.index,evaluate_table["Duration"],c="r",label="Duration",marker="o")
fig.legend(loc=1, bbox_to_anchor=(1,1), bbox_transform=ax.transAxes)
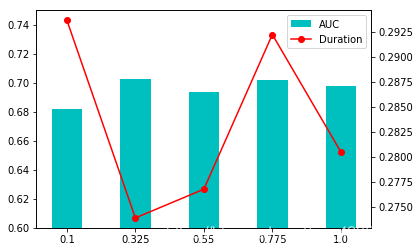
评估miniBatchFraction 参数影响
训练模型并获取评估参数表
evaluate_table = evaluate_parameter(train_data,validation_data,[26],[10],np.linspace(0.1,1,5))
evaluate_table
| Model | AUC | Duration | numIterations | stepSize | miniBatchFraction | |
|---|---|---|---|---|---|---|
| 0.100 | (weights=[0.22432239986157868,-0.2165393087222... | 0.682073 | 0.293671 | 26 | 10 | 0.100 |
| 0.325 | (weights=[0.25329319340814027,-0.2708727029103... | 0.702727 | 0.273905 | 26 | 10 | 0.325 |
| 0.550 | (weights=[0.24474754141432709,-0.2484500877818... | 0.693803 | 0.276777 | 26 | 10 | 0.550 |
| 0.775 | (weights=[0.25171480871609914,-0.2515106513891... | 0.702064 | 0.292244 | 26 | 10 | 0.775 |
| 1.000 | (weights=[0.24840617513903634,-0.2527605271207... | 0.697719 | 0.280513 | 26 | 10 | 1.000 |
根据评估参数表绘制图像
fig = plt.figure()
ax = fig.add_subplot(111)
ax.bar(evaluate_table.index,evaluate_table["AUC"],color="c",tick_label=evaluate_table.index,label="AUC",width=0.1)
ax.set_ylim(0.6,0.75)
ax2 = ax.twinx()
ax2.plot(evaluate_table.index,evaluate_table["Duration"],c="r",label="Duration",marker="o")
fig.legend(loc=1, bbox_to_anchor=(1,1), bbox_transform=ax.transAxes)
测试模型
导入测试集
def loadTestData(sc):
    raw_lines_and_header = sc.textFile("file:/home/zh123/.jupyter/workspace/stumbleupon/test.tsv")
    header_line = raw_lines_and_header.first()
    raw_non_header_data = raw_lines_and_header.filter(lambda l:l!=header_line)
    raw_non_quot_lines = raw_non_header_data.map(lambda l:l.replace("\"",""))
    raw_data = raw_non_quot_lines.map(lambda l:l.split("\t"))
    print("数据长度:",raw_data.count())

    # 和前面准备训练集的方式类似,只不过这里的类别字典是使用的前面的
    # 标签的位置换成了网站的url
    web_url_rdd = raw_data.map(lambda fields:fields[0])

    feature_rdd = raw_data.map(lambda fields:extract_features(fields,categories_dict,len(fields)))
    std_scaler = StandardScaler(withMean=True,withStd=True).fit(feature_rdd)
    scaler_features = std_scaler.transform(feature_rdd)
    test_point_rdd = web_url_rdd.zip(scaler_features)

    return test_point_rdd
test_file_data = loadTestData(sc)
test_file_data.first()
数据长度: 3171


('http://www.lynnskitchenadventures.com/2009/04/homemade-enchilada-sauce.html',
 DenseVector([-0.355, -0.2496, -0.7015, -0.3917, -0.1041, -0.2274, -0.21, -0.059, -0.1056, 0.0, 0.0, 2.3909, -0.2594, -0.1983, 0.1364, -0.021, -0.3888, 0.3429, -0.4867, -0.3604, -0.3208, 0.342, 0.0, 0.2093, -0.1513, -0.1, -0.0436, 0.7933, 0.7491, -0.7269, -0.2042, -0.0052, -0.2303, -0.5689, 0.406, -0.2558]))
加载最终的模型
model = evaluate_table[evaluate_table.AUC == evaluate_table.AUC.max()].Model.values[0]
使用模型进行预测
# 从测试文件集中随机抽取10个数据
for f in test_file_data.randomSplit([10,3171-10])[0].collect():
    # 打印网站名称和预测结果
    print(f[0],bool(model.predict(f[1])))
http://www.youbeauty.com/body-fitness/dressing-for-your-body-type?page=2 False
http://www.couponingncooking.com/2012/03/super-easy-whole-chicken-in-crock-pot.html True
http://www.rsvlts.com/2012/08/04/inside-the-london-olympics-week-one-62-high-quality-photos/ False
http://backtoherroots.com/2011/08/04/90-second-nutella-chocolate-cake/ True
http://cathlincooks.blogspot.com/ True
http://www.cheapcooking.com/articles/healthy-school-lunch-ideas.htm True
http://www.ted.com/index.php/talks/hans_rosling_shows_the_best_stats_you_ve_ever_seen.html False
http://www.break.com/index/hot-girls-risky-business-fail.html True
http://www.salon.com/2010/04/03/toasted_peeps_brulee_recipe/ True
http://www.joepastry.com/category/pastry/charlotte/ True
http://www.behance.net/leon_farrant/frame/2878481 True
http://www.wimp.com/pageturner/ False
