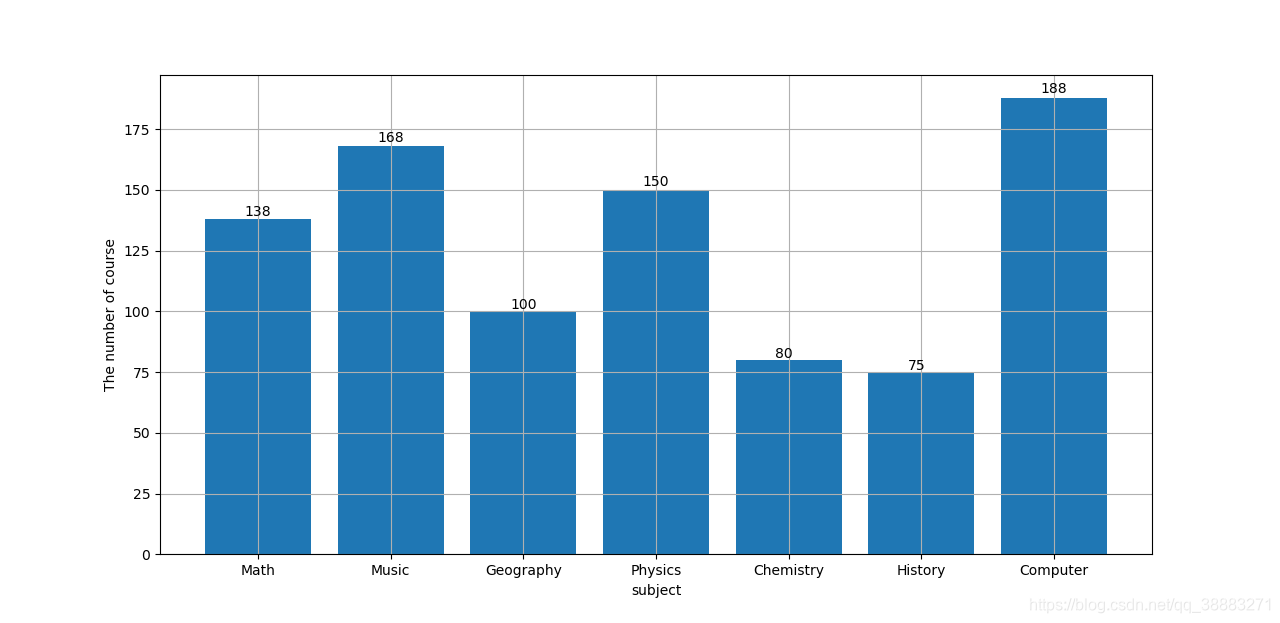
最简柱状图:
import matplotlib.pyplot as plt

label=['Math','Music','Geography','Physics','Chemistry','History','Computer']
numbers=[138,168,100,150,80,75,188]
rects=plt.bar(range(len(label)),numbers,tick_label=label)
for rect in rects:
    height=rect.get_height()
    plt.text(rect.get_x()+rect.get_width()/2.0-0.1,height*1.01,height)
plt.grid()
plt.xlabel('subject')
plt.ylabel('The number of course')
plt.show()
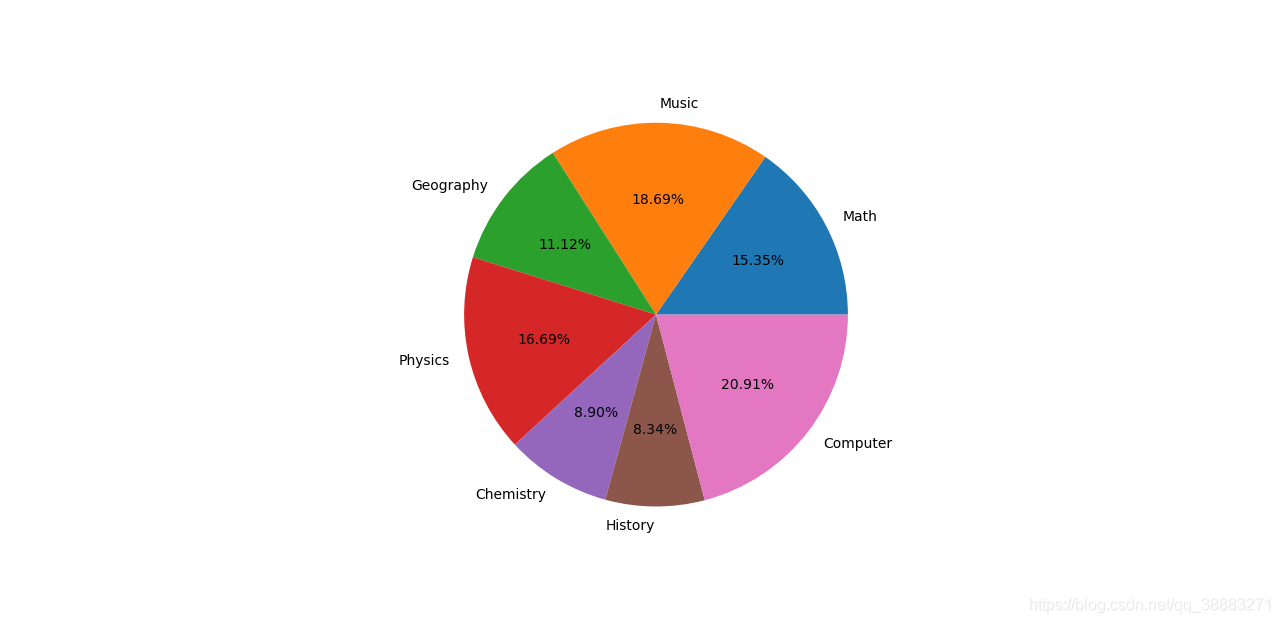
最简饼图:
import matplotlib.pyplot as plt

label=['Math','Music','Geography','Physics','Chemistry','History','Computer']
numbers=[138,168,100,150,80,75,188]
plt.pie(numbers,labels=label,autopct='%.2f%%')
plt.show()
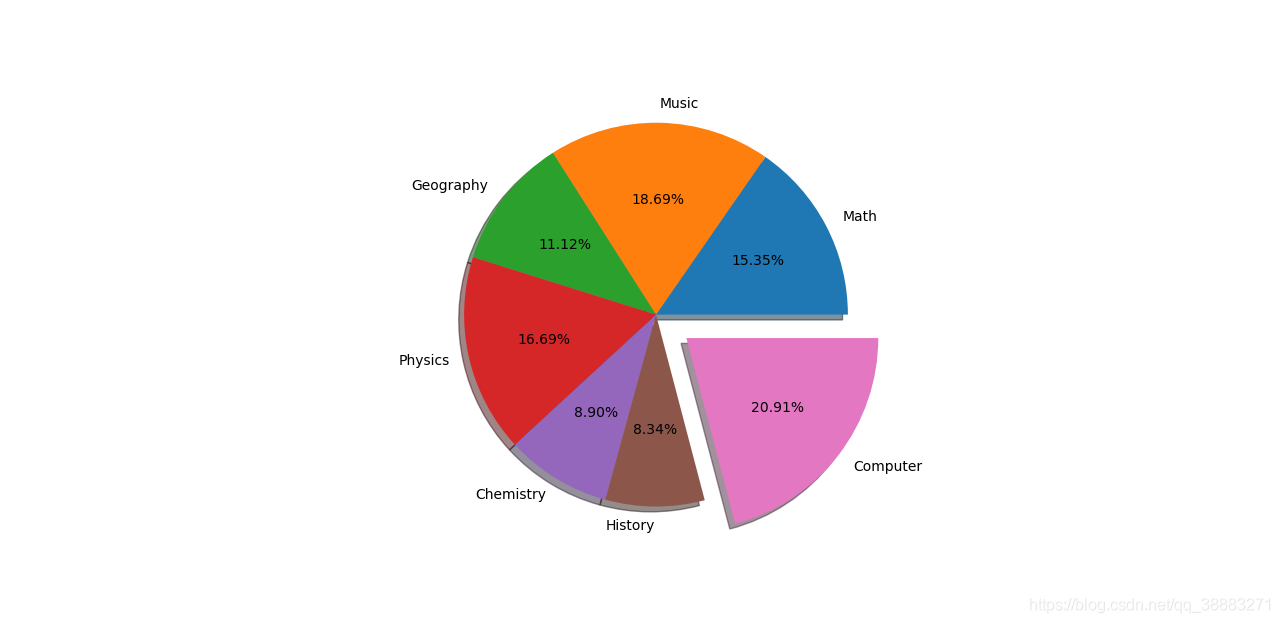
带切割和阴影的饼图:
import matplotlib.pyplot as plt

label=['Math','Music','Geography','Physics','Chemistry','History','Computer']
numbers=[138,168,100,150,80,75,188]
expl=[0,0,0,0,0,0,0.2]   #定义每个分割与相邻分割之间的距离
plt.pie(numbers,labels=label,autopct='%.2f%%',shadow=True,explode=expl)
plt.show()