话不多说直接进入主题
安装echarts依赖
npm install echarts -S
首先需要全局引入
在main.js中
// 引入echarts
import echarts from 'echarts'
Vue.prototype.$echarts = echarts
将Echarts封装好
Echarts.vue文件封装好组件
<template>
  <div :id="id"></div>
  <!-- 绑定ID -->
</template>

<script>
import Echarts from 'echarts'
export default {
  data() {
    return {
      myChart: {},
    }
  },

  props: ['echartObj', 'id'],

  created() {
    this.$nextTick(() => {
      this.loadEchart()
    })
  },
  mounted() {
    let _this = this
    window.onresize = function() {
      _this.myChart.resize()
    }
  },
  methods: {
    loadEchart() {
      this.myChart = Echarts.init(document.getElementById(this.id))  // 动态绑定Id名这样就能解决传多个Echarts过来后只显示一个问题
      this.myChart.setOption({
        //  这些属性看你传过来的对象中需要哪些自己添加就好
        legend: this.echartObj.legend,
        color: this.echartObj.color,
        series: this.echartObj.series,
        tooltip: this.echartObj.tooltip,
        grid: this.echartObj.grid,
        xAxis: this.echartObj.xAxis,
        yAxis: this.echartObj.yAxis,
        radar: this.echartObj.radar,
      })
    },
  },
}
</script>
使用封装好的组件
index.vue
<template>
<div>
<echarts
v-for="(item, index) in arr"
:key="index"
:id="item.echartsId"
:echartObj="item.echartObj"
:style="{width: '100%', height: '300px'}"
/>
<!-- id:传入组件的Id echartObj:传入组件的Echarts展示数据 -->
</div>
</template>
<script>
export default {
components: {
echarts: () => import("./Echarts") // 引入组件!!看好你自己组件的路径我是放在当前目录的
},
data() {
return {
arr: [
{
// 传给Echarts的Id为了能够同时渲染三个,不传只会显示一个只会显示最后一个
echartsId: "myChart",
// Echarts的展示数据
echartObj: {
legend: {
left: "center",
top: "bottom"
},
color: ["#fe5c30", "#fe812d", "#ffce2c", "#01c5d2", "#4f71ef"],
series: [
{
type: "pie",
radius: [0, 90],
center: ["50%", "40%"],
roseType: "area",
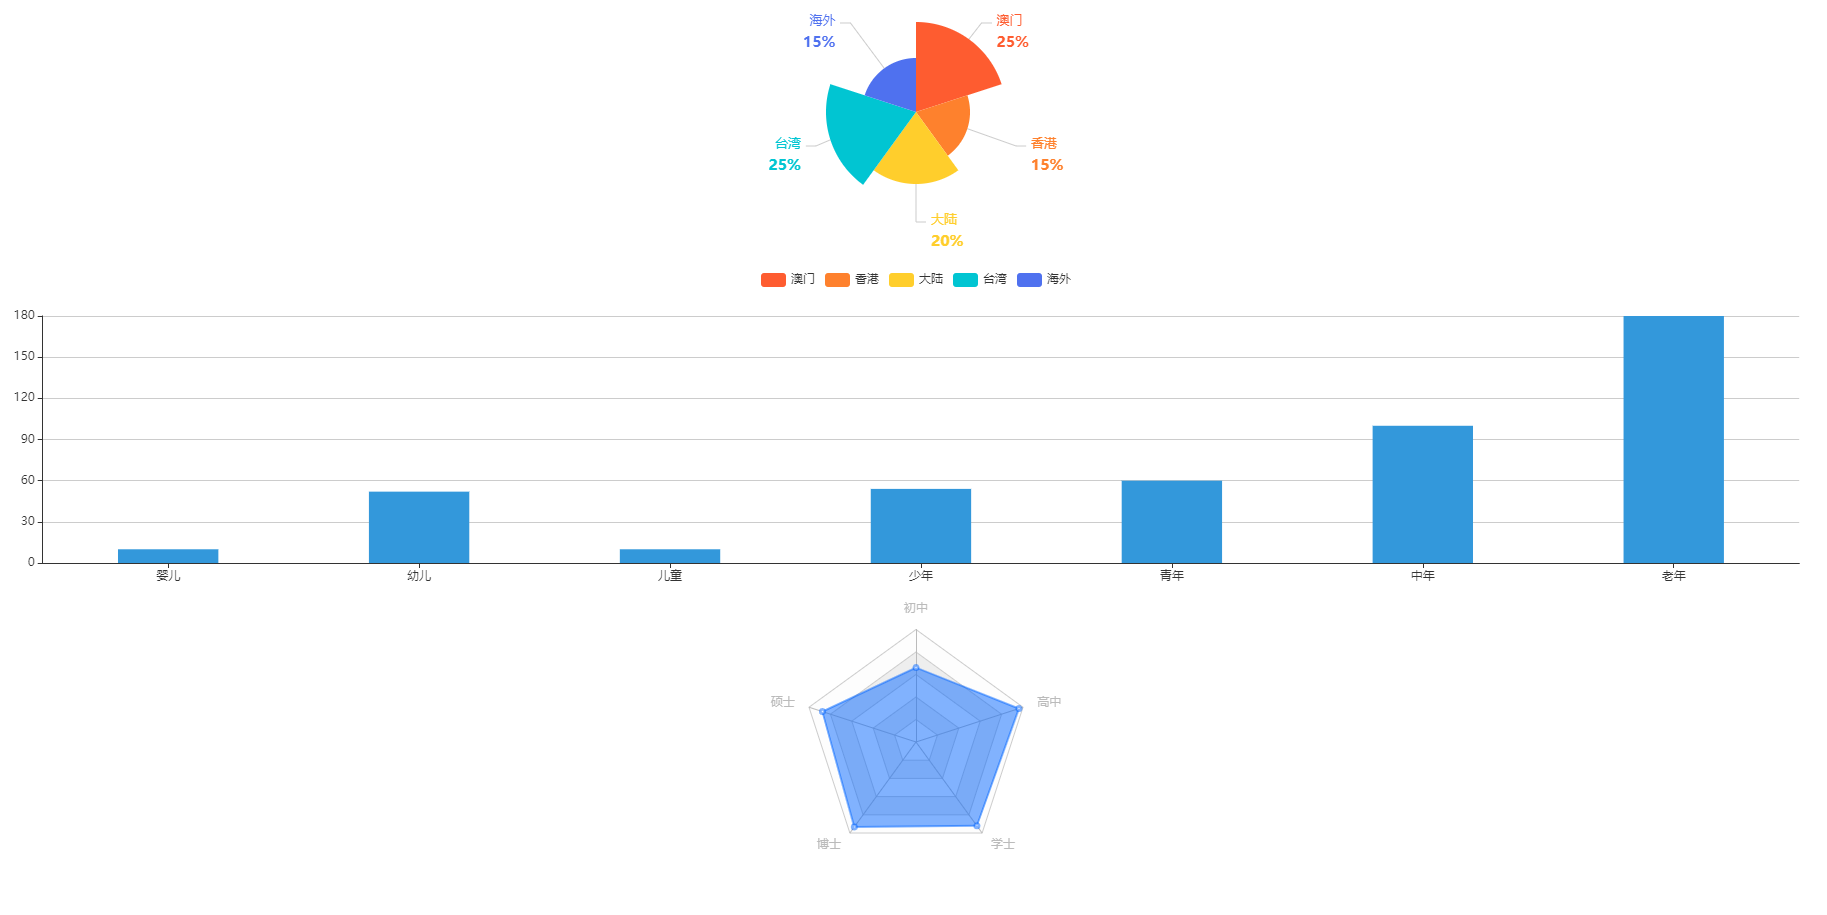
data: [
{ value: 25, name: "澳门" },
{ value: 15, name: "香港" },
{ value: 20, name: "大陆" },
{ value: 25, name: "台湾" },
{ value: 15, name: "海外" }
],
label: {
normal: {
formatter: ["{b|{b}}", "{d|{d}%}"].join("\n"),
rich: {
d: {
// color: 'rgb(241,246,104)',
fontSize: 15,
fontWeight: "bold",
lineHeight: 2
},
b: {
// color: 'rgb(98,137,169)',
fontSize: 13,
height: 40
}
}
}
},
labelLine: {
normal: {
lineStyle: {
color: "#ccc"
},
smooth: 0,
length: 20,
length2: 10
}
}
}
]
}
},
{
echartsId: "myChart2",
echartObj: {
color: ["#3398DB"],
tooltip: {
trigger: "axis",
axisPointer: {
// 坐标轴指示器,坐标轴触发有效
type: "shadow" // 默认为直线,可选为:'line' | 'shadow'
}
},
grid: {
top: "8%",
left: "3%",
right: "4%",
bottom: "3%",
containLabel: true
},
xAxis: [
{
type: "category",
data: ["婴儿", "幼儿", "儿童", "少年", "青年", "中年", "老年"],
axisTick: {
alignWithLabel: true
}
}
],
yAxis: [
{
type: "value"
}
],
series: [
{
type: "bar",
barWidth: "40%",
data: [10, 52, 10, 54, 60, 100, 180]
}
]
}
},
{
echartsId: "myChart3",
echartObj: {
radar: {
// shape: 'circle',
indicator: [
{
name: "初中",
max: 6500
},
{
name: "硕士",
max: 16000
},
{
name: "博士",
max: 30000
},
{
name: "学士",
max: 38000
},
{
name: "高中",
max: 52000
}
]
},
series: [
{
type: "radar",
// areaStyle: {normal: {}},
data: [
{
value: [4300, 14000, 28000, 35000, 50000, 19000],
name: "预算分配(Allocated Budget)"
}
],
areaStyle: {
normal: {
color: "rgba(0, 100, 255,.7)" // 填充的颜色。[ default: "#000" ]
}
},
lineStyle: {
// 单项线条样式。
normal: {
opacity: 0.5, // 图形透明度
color: "rgba(0, 100, 255,1)"
}
},
itemStyle: {
// 单个拐点标志的样式设置。
normal: {
borderColor: "rgba(0, 100, 255,.5)", // 拐点的描边颜色。[ default: '#000' ]
borderWidth: 3 // 拐点的描边宽度,默认不描边。[ default: 0 ]
}
}
}
]
}
}
]
};
}
};
</script>
完成:上图