此处机器人原理与应用初学者学习记录
使用版本:MATLAB2019b
栅格地图生成
地图生成部分,此处参考博客link。由于大多栅格地图生成都是用.txt自己编辑,太麻烦了!不如用MATLAB工具箱里的现有函数自己画图生成地图。
我特意更新了MATLAB版本,但我自己的Robotic ToolBox工具箱中没有makemap()函数,可以在该网站下载工具箱,安装操作很简单。
链接: link.
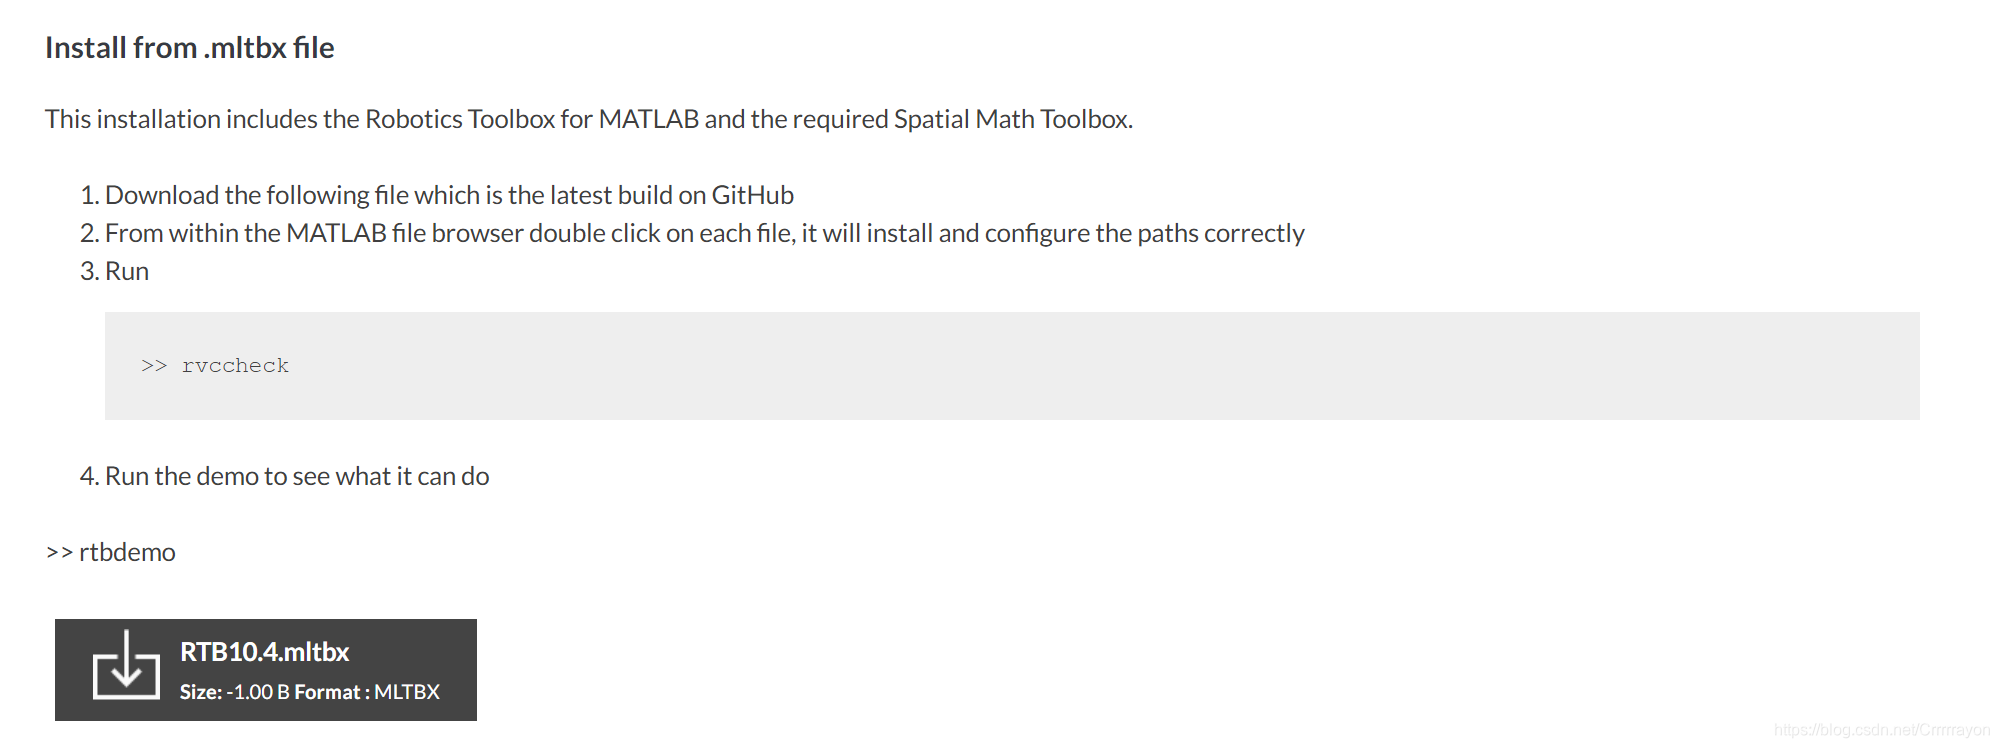
点击黑色按钮即可下载,网页打开的有点慢,但工具包不大,下载下来后在MATLAB中打开该工具包就能自动安装。之后控制台输入指令rvccheck就能成功调用makemap()函数了。
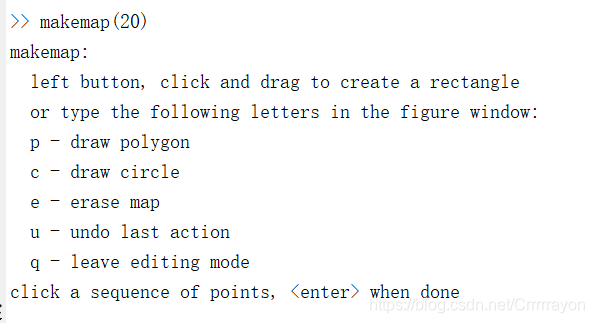
比如我输入makemap(20)后会生成20*20的地图,接下来出现一系列画图操作。
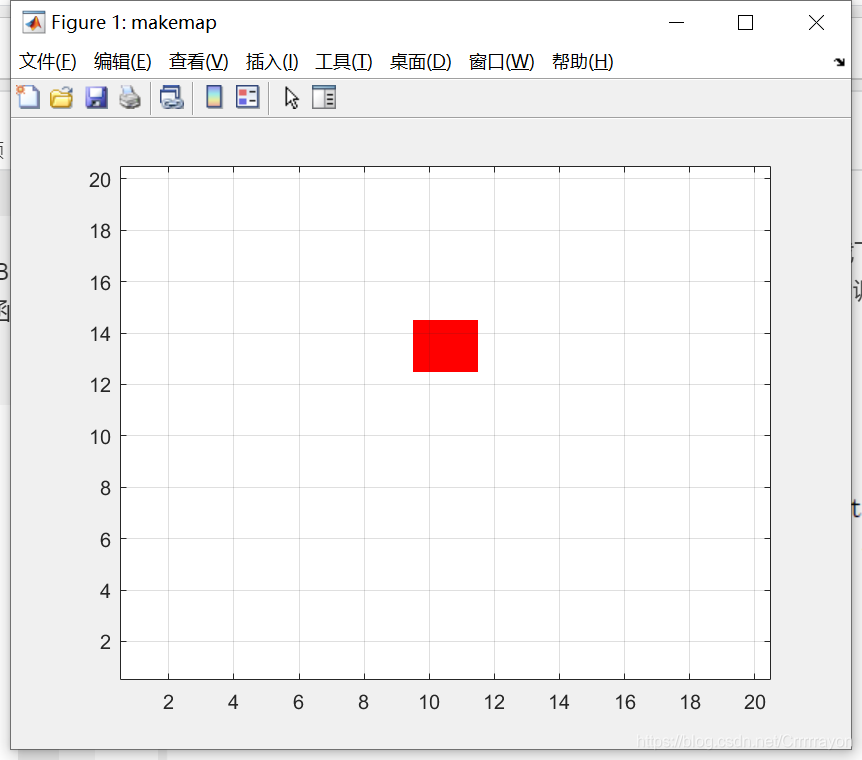
我在figure窗口按p,便会提示你画多边形,照着指示点击几个点再按enter便出现如上结果。
画完图记得按q才会显示出栅格矩阵,在工作区形成的结果你可以save一下,就会形成.mat文件了。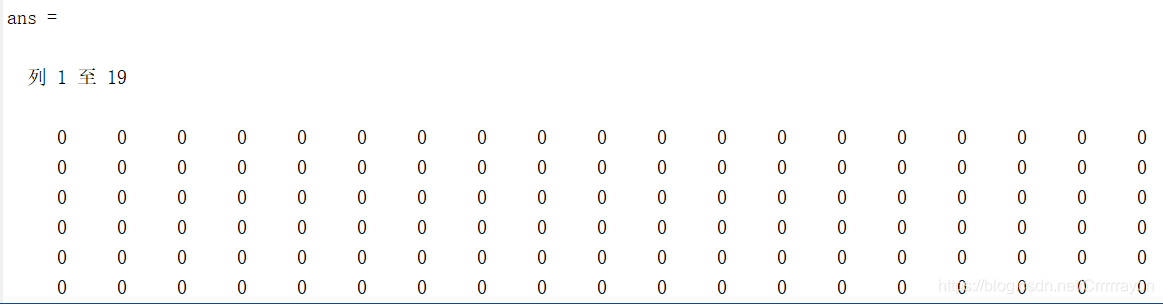
Dijkstra实现
以下是我根据其他博客代码作了修改,以.mat形式的栅格图为基础的路径规划实现,具体原理可参考其他博客 link
load('E:\作业\机器人原理与应用作业\A.mat'); % import the existed map
cmap = [1 1 1; ...% 1 - white - clear cell
0 0 0; ...% 2 - black - obstacle
1 0 0; ...% 3 - red = visited
0 0 1; ...% 4 - blue - on list
0 1 0; ...% 5 - green - start
1 1 0;% 6 - yellow - destination
0 1 1]; %7
colormap(cmap);
map = zeros(23,23); %本例中makemap(23),map与后面的nrows、ncols数值都要与之对应
% Add an obstacle
map (find(A==1)) = 2; %为1的点形成障碍物
map(1, 1) = 5; % start_coords起点
map(23, 23) = 7; % dest_coords终点
axis image;
%%
%此处数值与你的栅格图行列对应
nrows = 23;
ncols = 23;
start_node = sub2ind(size(map), 1, 1); %起点坐标
dest_node = sub2ind(size(map), 23, 23); %终点坐标
% Initialize distance array
distanceFromStart = Inf(nrows,ncols);
distanceFromStart(start_node) = 0;
% For each grid cell this array holds the index of its parent
parent = zeros(nrows,ncols);
% Main Loop
while true
% Draw current map
map(start_node) = 5;
map(dest_node) = 6;
image(1.5, 1.5, map);
grid on;
axis image;
drawnow;
% Find the node with the minimum distance
[min_dist, current] = min(distanceFromStart(:));
if ((current == dest_node) || isinf(min_dist))
break;
end;
map(current) = 3;
distanceFromStart(current) = Inf;
[i, j] = ind2sub(size(distanceFromStart), current);
neighbor = [i-1,j;...
i+1,j;...
i,j+1;...
i,j-1]
outRangetest = (neighbor(:,1)<1) + (neighbor(:,1)>nrows) +...
(neighbor(:,2)<1) + (neighbor(:,2)>ncols )
locate = find(outRangetest>0);
neighbor(locate,:)=[]
neighborIndex = sub2ind(size(map),neighbor(:,1),neighbor(:,2))
for i=1:length(neighborIndex)
if (map(neighborIndex(i))~=2) && (map(neighborIndex(i))~=3 && map(neighborIndex(i))~= 5)
map(neighborIndex(i)) = 4;
if distanceFromStart(neighborIndex(i))> min_dist + 1 distanceFromStart(neighborIndex(i)) = min_dist+1;
parent(neighborIndex(i)) = current;
end
end
end
end
%%
if (isinf(distanceFromStart(dest_node)))
route = [];
else
%提取路线坐标
route = [dest_node];
while (parent(route(1)) ~= 0)
route = [parent(route(1)), route];
end
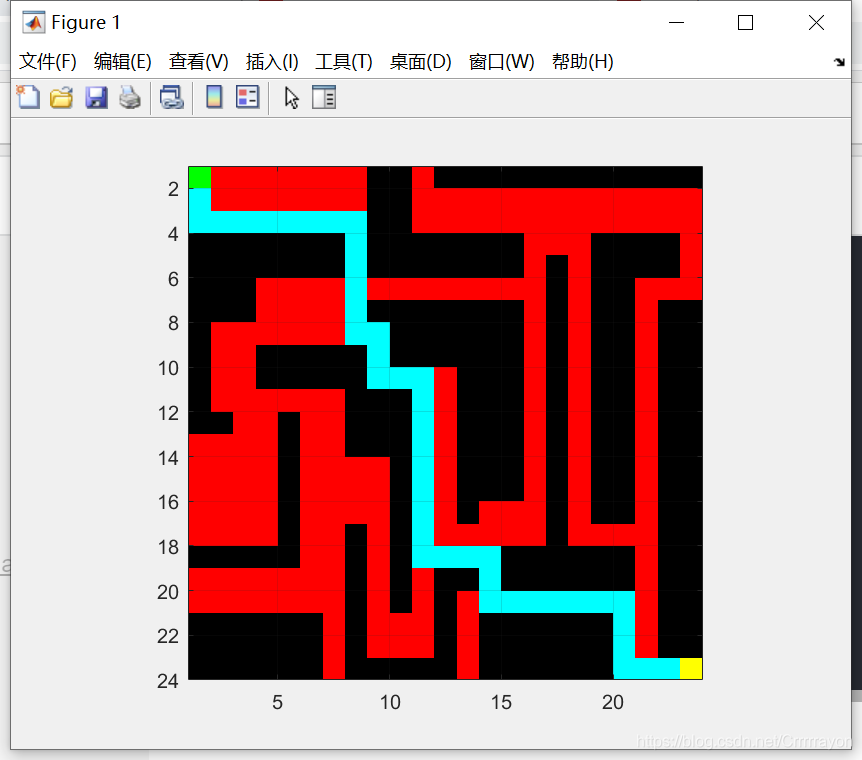
% 动态显示出路线
for k = 2:length(route) - 1
map(route(k)) = 7;
pause(0.1);
image(1.5, 1.5, map);
grid on;
axis image;
end
end
A*实现
原理参考同上
% set up color map for display
load('E:\作业\机器人原理与应用作业\A.mat');    % import the existed map
cmap = [1 1 1; ...% 1 - white - clear cell
        0 0 0; ...% 2 - black - obstacle
               1 0 0; ...% 3 - red = visited
               0 0 1; ...% 4 - blue - on list
               0 1 0; ...% 5 - green - start
               1 1 0;% 6 - yellow - destination
               0 1 1]; %7
colormap(cmap);
map = zeros(23,23);
% Add an obstacle
map (find(A==1)) = 2;
map(1, 1) = 5; % start_coords
map(23, 23) = 7; % dest_coords

grid on;
axis image;
%%
nrows = 23;
ncols = 23;
start_node = sub2ind(size(map), 1, 1);
dest_node = sub2ind(size(map), 23, 23);
% Initialize distance array
distanceFromStart = Inf(nrows,ncols);
distanceFromStart(start_node) = 0;

%====================
[X, Y] = meshgrid (1:ncols, 1:nrows);
H = abs(Y - 4) + abs(X - 8);
f = Inf(nrows,ncols);
f(start_node) = H(start_node);
%=======================
% For each grid cell this array holds the index of its parent
parent = zeros(nrows,ncols);
% Main Loop
while true
 % Draw current map
 map(start_node) = 5;
 map(dest_node) = 6;
 image(1.5, 1.5, map);
 grid on;
 axis image;
 drawnow;
 %====================
  % Find the node with the minimum distance
 [~, current] = min(f(:)); [min_dist, ~] = min(distanceFromStart(:));
 %===================
  if ((current == dest_node) || isinf(min_dist))
       break;
  end

 map(current) = 3;
%============
 f(current) =Inf;
%============
 [i, j] = ind2sub(size(distanceFromStart), current);


neighbor = [i-1,j;...
            i+1,j;...
            i,j+1;...
            i,j-1]
outRangetest = (neighbor(:,1)<1) + (neighbor(:,1)>nrows) +...
                   (neighbor(:,2)<1) + (neighbor(:,2)>ncols )
locate = find(outRangetest>0);
neighbor(locate,:)=[]
neighborIndex = sub2ind(size(map),neighbor(:,1),neighbor(:,2))
for i=1:length(neighborIndex)
if (map(neighborIndex(i))~=2) && (map(neighborIndex(i))~=3 && map(neighborIndex(i))~= 5)
    map(neighborIndex(i)) = 4;
  if distanceFromStart(neighborIndex(i))> min_dist + 1
      distanceFromStart(neighborIndex(i)) = min_dist+1;
        parent(neighborIndex(i)) = current;
        f(neighborIndex(i)) =H(neighborIndex(i));
  end
 end
end
end
%%
if (isinf(distanceFromStart(dest_node)))
    route = [];
else
    %提取路线坐标
   route = [dest_node];
      while (parent(route(1)) ~= 0)
              route = [parent(route(1)), route];
       end
  % 动态显示出路线
        for k = 2:length(route) - 1
          map(route(k)) = 7;
                pause(0.1);
                image(1.5, 1.5, map);
              grid on;
              axis image;
              end
end
以上代码借鉴了一些文章,仅供学习交流
