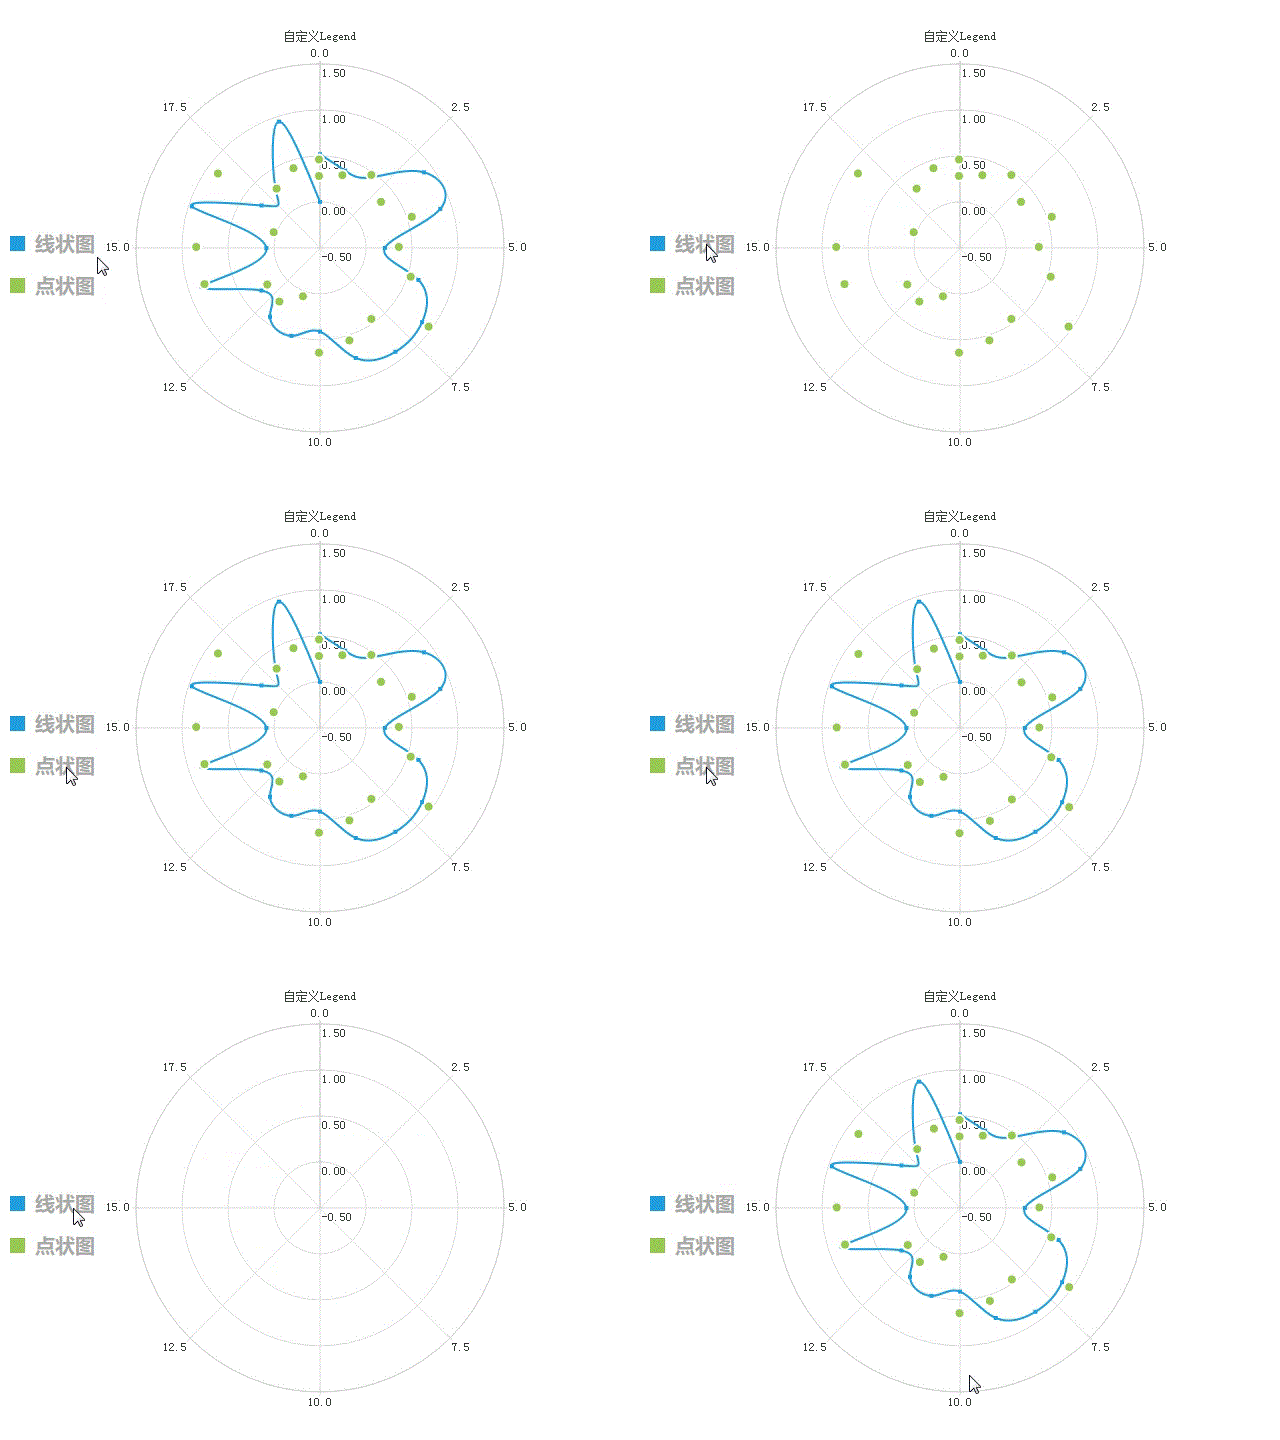
QML ChartView中提供了默认的Legend,可对图例进行一些简单的例如颜色、字体等的设置,但是当需要图例具有个性化的功能时(如单击时隐藏或显示)时,就需要使用自定义的Legend。效果:

MyLegend.qml
import QtQuick 2.0
import QtQuick.Layouts 1.3

Rectangle {
    id: legend
    color: "#00000000"
    z:15
    property int seriesCount: 0
    property var seriesNames: []
    property var seriesColors: []
    property var labelNames: []
    property color labelColor: "white"
    signal selected(var series)

    function addSeries(seriesName,labelName, color) {
        seriesNames.push(seriesName)
        labelNames.push(labelName)
        seriesColors.push(color)
        seriesCount++;
    }

    function removeSeries(seriesName){
        var s = seriesNames.indexOf(seriesName)
        seriesNames.splice(s,1)
        unitNames.splice(s,1)
        seriesColors.splice(s,1)
        seriesCount--;
    }

    Component {
        id: legendDelegate
        Rectangle {
            id: rect
            property var currentSeries: seriesNames[index]
            property var currentName: labelNames[index]
            property color markerColor: seriesColors[index]
            color: "#00000000"
            radius: 4
            implicitWidth: parent.width
            implicitHeight: label.implicitHeight + marker.implicitHeight + 10

            Row {
                id: row
                spacing: 10
                anchors.fill: parent

                Rectangle {
                    id: marker
                    anchors.verticalCenter: parent.verticalCenter
                    color: markerColor
                    width: 15
                    height: 15
                }
                Text {
                    id: label
                    anchors.verticalCenter: parent.verticalCenter
                    anchors.verticalCenterOffset: 0
                    text: currentName
                    verticalAlignment: Text.AlignVCenter
                    horizontalAlignment: Text.AlignLeft
                    color: labelColor
                    font.family: "微软雅黑"
                    font.pointSize: 15
                    font.bold: true
                    elide: Text.ElideRight
                }
            }

            MouseArea {
                id: mouseArea
                anchors.fill: parent
                onClicked: {
                    emit: legend.selected(currentSeries);
                }
            }
        }
    }

    ColumnLayout {
        id: legendRow
        anchors.fill: parent

        Repeater {
            id: legendRepeater
            model: seriesCount
            delegate: legendDelegate
        }

    }
}
界面QML中,ChartView初始化后,需要使用addSeries函数添加图例信息、使用信号绑定自定义Legend的事件。
Component.onCompleted: {
    polarChartView.legend.visible = false
    myLegend.addSeries(series1,series1.name,series1.color)
    myLegend.addSeries(series2,series2.name,series2.color)
}

Connections{
    target: myLegend
    onSelected:{
        series.visible = !series.visible
    }
}
DEMO:自定义Legend
