什么是决策树/判定树(decision tree)?
决策树是一个类似于流程图的树结构:其中,每个内部结点表示在一个属性上的测试,每个分支代表一个属性输出,而每个树叶结点代表类或类分布。树的最顶层是根结点。

是分类方法中的一种算法
构造决策树


为什么age作为根节点呢?
首先,了解下熵(entropy)的概念:
信息和抽象,如何度量?
1948年,香农提出了 ”信息熵(entropy)“的概念
一条信息的信息量大小和它的不确定性有直接的关系,要搞清楚一件非常非常不确定的事情,或者是我们一无所知的事情,需要了解大量信息==>信息量的度量就等于不确定性的多少
例子:猜世界杯冠军,假如你对这些队伍一无所知,猜多少次?
每个队夺冠的几率不是相等的
比特(bit)来衡量信息的多少

变量的不确定性越大,熵也就越大
决策树归纳算法 (ID3)
选择属性判断结点
信息获取量(Information Gain):Gain(A) = Info(D) - Infor_A(D)
通过A来作为节点分类获取了多少信息

例如:首先我们的目的是看是否买电脑,因此作为分类依据class label(5个no,9个yes)

然后我们再加入age条件
- 5个youth,其中2个yes,3个no
- 4个Middle,其中4个yes
- 5个senior,其中3个yes,2个no
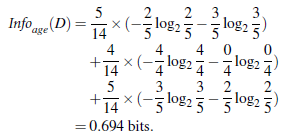
相减即age的信息增量:

类似,Gain(income) = 0.029, Gain(student) = 0.151, Gain(credit_rating)=0.048
所以,选择age作为第一个根节点

分支重复
算法:
- 树以代表训练样本的单个结点开始(步骤1)。
- 如果样本都在同一个类,则该结点成为树叶,并用该类标号(步骤2 和3)。如Middle中购买电脑全是yes,直接成为树叶
- 否则,算法使用称为信息增益的基于熵的度量作为启发信息,选择能够最好地将样本分类的属性(步骤6)。该属性成为该结点的“测试”或“判定”属性(步骤7)。在算法的该版本中,
- 所有的属性都是分类的,即离散值。连续属性必须离散化。
- 对测试属性的每个已知的值,创建一个分枝,并据此划分样本(步骤8-10)。
- 算法使用同样的过程,递归地形成每个划分上的样本判定树。一旦一个属性出现在一个结点上,就不必该结点的任何后代上考虑它(步骤13)。
- 递归划分步骤仅当下列条件之一成立停止:
- (a) 给定结点的所有样本属于同一类(步骤2 和3)。
- (b) 没有剩余属性可以用来进一步划分样本(步骤4)。在此情况下,使用多数表决(步骤5)。如此时5个yes1个no,标记为yes
- 这涉及将给定的结点转换成树叶,并用样本中的多数所在的类标记它。替换地,可以存放结点样本的类分布。
- © 分枝
- test_attribute = a i 没有样本(步骤11)。在这种情况下,以samples 中的多数类
- 创建一个树叶(步骤12)
其他算法:
C4.5: Quinlan
Classification and Regression Trees (CART): (L. Breiman, J. Friedman, R. Olshen, C. Stone)
共同点:都是贪心算法,自上而下(Top-down approach)
区别:属性选择度量方法不同: C4.5 (gain ratio), CART(gini index), ID3 (Information Gain)
如何处理连续性变量的属性?
如age = 1, 2, 3, 4, 5, 6, 7, 8
需要给个阈值,如<=4,>4
树剪枝叶 (避免overfitting)
- 先剪枝
- 后剪枝
决策树的优点:直观,便于理解,小规模数据集有效
决策树的缺点:
- 处理连续变量不好
- 类别较多时,错误增加的比较快
- 可规模性一般
代码
要将数据变为矩阵,如图所示:

from sklearn.feature_extraction import DictVectorizer
import csv
from sklearn import tree
from sklearn import preprocessing
from sklearn.externals.six import StringIO

# Read in the csv file and put features into list of dict and list of class label
allElectronicsData = open(r'AllElectronics.csv', 'rt')
reader = csv.reader(allElectronicsData)
headers = next(reader)

print(headers)
['RID', 'age', 'income', 'student', 'credit_rating', 'class_buys_computer']
print('-' * 30)

featureList = []
labelList = []

for row in reader:
    labelList.append(row[len(row)-1])   # 取每行最后一个值class label加入labelList
    rowDict = {}
    for i in range(1, len(row)-1):  # 第0列为索引,所以从第1列开始
        #print(row[i])
        rowDict[headers[i]] = row[i]
        #print('rowDict:', rowDict)
    featureList.append(rowDict)

print(featureList)

# Vetorize features
vec = DictVectorizer()  # 自动将字典形式转为0,1形式
dummyX = vec.fit_transform(featureList) .toarray()

print("dummyX: " + str(dummyX))
dummyX: [[0. 0. 1. 0. 1. 1. 0. 0. 1. 0.]
 [0. 0. 1. 1. 0. 1. 0. 0. 1. 0.]
 [1. 0. 0. 0. 1. 1. 0. 0. 1. 0.]
 [0. 1. 0. 0. 1. 0. 0. 1. 1. 0.]
 [0. 1. 0. 0. 1. 0. 1. 0. 0. 1.]
 [0. 1. 0. 1. 0. 0. 1. 0. 0. 1.]
 [1. 0. 0. 1. 0. 0. 1. 0. 0. 1.]
 [0. 0. 1. 0. 1. 0. 0. 1. 1. 0.]
 [0. 0. 1. 0. 1. 0. 1. 0. 0. 1.]
 [0. 1. 0. 0. 1. 0. 0. 1. 0. 1.]
 [0. 0. 1. 1. 0. 0. 0. 1. 0. 1.]
 [1. 0. 0. 1. 0. 0. 0. 1. 1. 0.]
 [1. 0. 0. 0. 1. 1. 0. 0. 0. 1.]
 [0. 1. 0. 1. 0. 0. 0. 1. 1. 0.]]

print(vec.get_feature_names())
['age=middle_aged', 'age=senior', 'age=youth', 'credit_rating=excellent', 'credit_rating=fair', 'income=high', 'income=low', 'income=medium', 'student=no', 'student=yes']
#print(dummyX.shape)    # 14*10

print("labelList: " + str(labelList))
labelList: ['no', 'no', 'yes', 'yes', 'yes', 'no', 'yes', 'no', 'yes', 'yes', 'yes', 'yes', 'yes', 'no']

# vectorize class labels
lb = preprocessing.LabelBinarizer() # 将label转为0,1
dummyY = lb.fit_transform(labelList)
print("dummyY: " + str(dummyY))
dummyY: [[0]
 [0]
 [1]
 [1]
 [1]
 [0]
 [1]
 [0]
 [1]
 [1]
 [1]
 [1]
 [1]
 [0]]

# Using decision tree for classification
# clf = tree.DecisionTreeClassifier()
clf = tree.DecisionTreeClassifier(criterion='entropy')	# 构建决策树(ID3)
clf = clf.fit(dummyX, dummyY)
print("clf: " + str(clf))


# # Visualize model 生成.dot文件,可使用Graphviz转为pdf将树可视化
# with open("allElectronicInformationGainOri.dot", 'w') as f:
#     f = tree.export_graphviz(clf, feature_names=vec.get_feature_names(), out_file=f)

oneRowX = dummyX[0, :]
oneRowX = oneRowX.reshape(1, -1)    # sklearn数据要求为二维
print("oneRowX: " + str(oneRowX))
oneRowX: [[0. 0. 1. 0. 1. 1. 0. 0. 1. 0.]]

newRowX = oneRowX
newRowX[0, 0] = 1
newRowX[0, 2] = 0
print("newRowX: " + str(newRowX))   # 构件一个新数据
newRowX: [[1. 0. 0. 0. 1. 1. 0. 0. 1. 0.]]

predictedY = clf.predict(newRowX)
print("predictedY: " + str(predictedY)) # 预测新数据的label(买还是不买)
predictedY: [1]
树可视化图:

安装Graphviz
配置环境变量
转化dot文件至pdf可视化决策树:dot -Tpdf iris.dot -o outpu.pdf
