rom:http://blog.csdn.net/lujiandong1/article/details/52777168
XGBoost模型和其他模型一样,如果迭代次数过多,也会进入过拟合。表现就是随着迭代次数的增加,测试集上的测试误差开始下降。当开始过拟合或者过训练时,测试集上的测试误差开始上升,或者说波动。下面通过实验来说明这种情况:
下面实验数据的来源:https://archive.ics.uci.edu/ml/datasets/Pima+Indians+Diabetes
- # monitor training performance
- from numpy import loadtxt
- from xgboost import XGBClassifier
- from sklearn.cross_validation import train_test_split
- from sklearn.metrics import accuracy_score
- # load data
- dataset = loadtxt('pima-indians-diabetes.csv', delimiter=",")
- # split data into X and y
- X = dataset[:,0:8]
- Y = dataset[:,8]
- # split data into train and test sets
- X_train, X_test, y_train, y_test = train_test_split(X, Y, test_size=0.33, random_state=7)
- # fit model no training data
- model = XGBClassifier()
- eval_set = [(X_test, y_test)]
- model.fit(X_train, y_train, eval_metric="error", eval_set=eval_set, verbose=True)
- # make predictions for test data
- y_pred = model.predict(X_test)
- predictions = [round(value) for value in y_pred]
- # evaluate predictions
- accuracy = accuracy_score(y_test, predictions)
- print("Accuracy: %.2f%%" % (accuracy * 100.0))
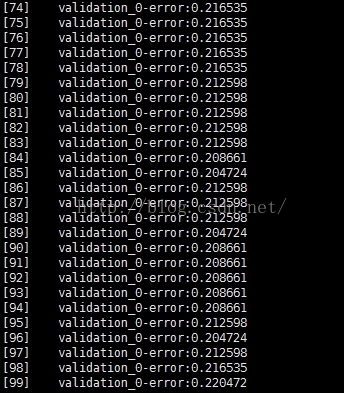
分析:当迭代次数过多时,测试集上的测试误差基本上已经不再下降。并且测试误差基本上已经在一个水平附近波动,甚至下降。说明,已经进入了过训练阶段
==============================================================================================================================
下面,我们通过可视化训练loss,测试loss来说明过拟合的现象
- # plot learning curve
- from numpy import loadtxt
- from xgboost import XGBClassifier
- from sklearn.cross_validation import train_test_split
- from sklearn.metrics import accuracy_score
- from matplotlib import pyplot
- # load data
- dataset = loadtxt('pima-indians-diabetes.csv', delimiter=",")
- # split data into X and y
- X = dataset[:,0:8]
- Y = dataset[:,8]
- # split data into train and test sets
- X_train, X_test, y_train, y_test = train_test_split(X, Y, test_size=0.33, random_state=7)
- # fit model no training data
- model = XGBClassifier()
- eval_set = [(X_train, y_train), (X_test, y_test)]
- model.fit(X_train, y_train, eval_metric=["error", "logloss"], eval_set=eval_set, verbose=True)
- # make predictions for test data
- y_pred = model.predict(X_test)
- predictions = [round(value) for value in y_pred]
- # evaluate predictions
- accuracy = accuracy_score(y_test, predictions)
- print("Accuracy: %.2f%%" % (accuracy * 100.0))
- # retrieve performance metrics
- results = model.evals_result()
- epochs = len(results['validation_0']['error'])
- x_axis = range(0, epochs)
- # plot log loss
- fig, ax = pyplot.subplots()
- ax.plot(x_axis, results['validation_0']['logloss'], label='Train')
- ax.plot(x_axis, results['validation_1']['logloss'], label='Test')
- ax.legend()
- pyplot.ylabel('Log Loss')
- pyplot.title('XGBoost Log Loss')
- pyplot.show()
- # plot classification error
- fig, ax = pyplot.subplots()
- ax.plot(x_axis, results['validation_0']['error'], label='Train')
- ax.plot(x_axis, results['validation_1']['error'], label='Test')
- ax.legend()
- pyplot.ylabel('Classification Error')
- pyplot.title('XGBoost Classification Error')
- pyplot.show()
- eval_set = [(X_train, y_train), (X_test, y_test)]
- model.fit(X_train, y_train, eval_metric=["error", "logloss"], eval_set=eval_set, verbose=True)
- # retrieve performance metrics
- results = model.evals_result()
- epochs = len(results['validation_0']['error'])
- x_axis = range(0, epochs)
- # plot log loss
- fig, ax = pyplot.subplots()
- ax.plot(x_axis, results['validation_0']['logloss'], label='Train')
- ax.plot(x_axis, results['validation_1']['logloss'], label='Test')
- ax.legend()
- pyplot.ylabel('Log Loss')
- pyplot.title('XGBoost Log Loss')
- pyplot.show()
下面可视化训练集误差曲线和测试集误差曲线:
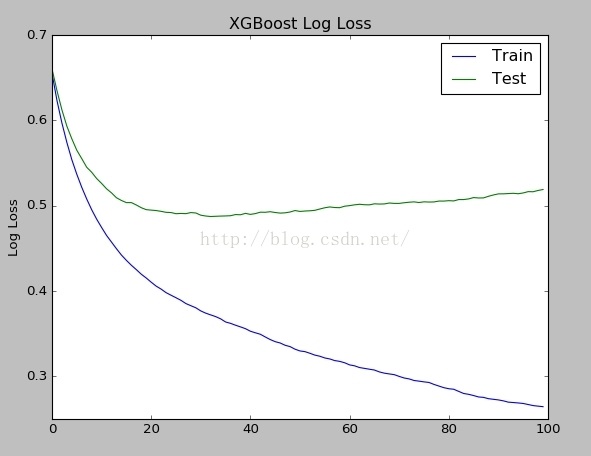
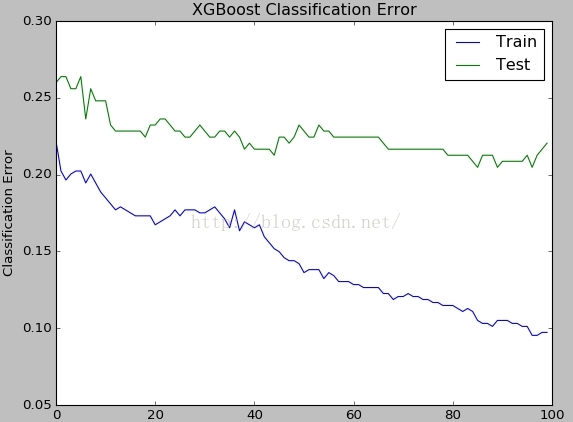
通过logloss图,很明显看出,当nround大于40的时候,测试集上的误差开始上升,已经进入了过拟合了。
XGBoost可以通过设置参数 early_stopping_rounds 来解决因为迭代次数过多而过拟合的状态。
- eval_set = [(X_test, y_test)]
- model.fit(X_train, y_train, early_stopping_rounds=10, eval_metric="logloss", eval_set=eval_set, verbose=True)
- # early stopping
- from numpy import loadtxt
- from xgboost import XGBClassifier
- from sklearn.cross_validation import train_test_split
- from sklearn.metrics import accuracy_score
- # load data
- dataset = loadtxt('pima-indians-diabetes.csv', delimiter=",")
- # split data into X and y
- X = dataset[:,0:8]
- Y = dataset[:,8]
- # split data into train and test sets
- seed = 7
- test_size = 0.33
- X_train, X_test, y_train, y_test = train_test_split(X, Y, test_size=test_size, random_state=seed)
- # fit model no training data
- model = XGBClassifier()
- eval_set = [(X_test, y_test)]
- model.fit(X_train, y_train, early_stopping_rounds=10, eval_metric="logloss", eval_set=eval_set, verbose=True)
- # make predictions for test data
- y_pred = model.predict(X_test)
- predictions = [round(value) for value in y_pred]
- # evaluate predictions
- accuracy = accuracy_score(y_test, predictions)
- print("Accuracy: %.2f%%" % (accuracy * 100.0))
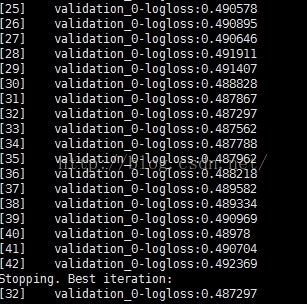
说明:当nround = 42时,就stop了,说明logloss最佳的状态在nround = 32的时候。经验上,选择early_stopping_rounds = 10%*(总迭代次数)
当使用了early_stopping_rounds,可以通过best_iteration属性来提取出最适合的迭代次数,然后预测的时候就使用stop之前训练的树来预测。
- print (model.best_iteration)
- limit = model.best_iteration
- y_pred = model.predict(X_test,ntree_limit=limit)
- predictions = [round(value) for value in y_pred]
- # evaluate predictions
- accuracy = accuracy_score(y_test, predictions)
- print("Accuracy: %.2f%%" % (accuracy * 100.0))