<div class="layui-col-md6">
<div class="layui-card">
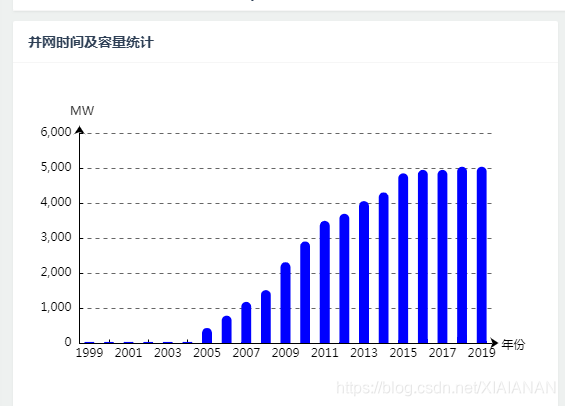
<div class="layui-card-header">并网时间及容量统计</div>
<div class="layui-card-body" id="bar1"></div>
</div>
</div>
var option = {
		  // ----  标题 -----
		  title: {
		    text: '',
		    textStyle: {
		      color: 'red'
		    },
		    subtext: '',
		    subtextStyle: {
		      color: 'blue'
		    },
		    padding: [0, 0, 10, 100]  // 位置
		  },
		  // ---- legend ----
		  legend: {
		    type: 'plain',  // 图列类型,默认为 'plain'
		    top: '1%',  // 图列相对容器的位置 top\bottom\left\right
		    selected: {
		      // '销量': true  // 图列选择,图形加载出来会显示选择的图列,默认为true
		    },
		    textStyle: {  // 图列内容样式
		      color: '#fff',  // 字体颜色
		      backgroundColor: 'black'  // 字体背景色
		    },
		    tooltip: {  // 图列提示框,默认不显示
		      show: true,
		      color: 'red'
		    },
		    data: [   // 图列内容
		      {
		        name: '',
		        icon: 'circle',
		        textStyle: {
		          color: 'red',  // 单独设置某一个图列的颜色
		          backgroundColor: '#fff' // 单独设置某一个图列的字体背景色
		        }
		      }
		    ]
		  },
		  // ---  提示框 ----
		  tooltip: {
		    show: true,   // 是否显示提示框,默认为true
		    trigger: 'item', // 数据项图形触发
		    axisPointer: {   // 指示样式
		      type: 'shadow',
		      axis: 'auto'
		    },
		    padding: 5,
		    textStyle: {   // 提示框内容的样式
		      color: '#fff'
		    }
		  },
		  // ---- gird区域 ---
		  gird: {
		    show: false,    // 是否显示直角坐标系网格
		    top: 80,  // 相对位置 top\bottom\left\right
		    containLabel: false, // gird 区域是否包含坐标轴的刻度标签
		    tooltip: {
		      show: true,
		      trigger: 'item',   // 触发类型
		      textStyle: {
		        color: '#666'
		      }
		    }
		  },
		  //  ------  X轴 ------
		  xAxis: {
		    show: true,  // 是否显示
		    position: 'bottom',  // x轴的位置
		    offset: 0, // x轴相对于默认位置的偏移
		    type: 'category',   // 轴类型, 默认为 'category'
		    name: '年份',    // 轴名称
		    nameLocation: 'end',  // 轴名称相对位置
		    nameTextStyle: {   // 坐标轴名称样式
		      color: 'black',
		      padding: [5, 0, 0, -5]
		    },
		    nameGap: 15, // 坐标轴名称与轴线之间的距离
		    nameRotate: 0,  // 坐标轴名字旋转
		    axisLine: {       // 坐标轴 轴线
		      show: true,  // 是否显示
		      symbol: ['none', 'arrow'],  // 是否显示轴线箭头
		      symbolSize: [8, 8], // 箭头大小
		      symbolOffset: [0, 7],  // 箭头位置
		      // ------   线 ---------
		      lineStyle: {
		        color: 'balck',
		        width: 1,
		        type: 'solid'
		      }
		    },
		    axisTick: {    // 坐标轴 刻度
		      show: true,  // 是否显示
		      inside: true,  // 是否朝内
		      length: 3,     // 长度
		      lineStyle: {   // 默认取轴线的样式
		        color: 'black',
		        width: 1,
		        type: 'solid'
		      }
		    },
		    axisLabel: {    // 坐标轴标签
		      show: true,  // 是否显示
		      inside: false, // 是否朝内
		      rotate: 0, // 旋转角度
		      margin: 5, // 刻度标签与轴线之间的距离
		      color: 'black'  // 默认取轴线的颜色
		    },
		    splitLine: {    // gird区域中的分割线
		      show: false,  // 是否显示
		      lineStyle: {
		      }
		    },
		    splitArea: {    // 网格区域
		      show: false  // 是否显示,默认为false
		    },
		    data: [[${xlab}]]
		  },
		  //   ------   y轴  ----------
		  yAxis: {
		    show: true,  // 是否显示
		    position: 'left', // y轴位置
		    offset: 0, // y轴相对于默认位置的偏移
		    type: 'value',  // 轴类型,默认为 ‘category’
		    name: 'MW',   // 轴名称
		    nameLocation: 'end', // 轴名称相对位置value
		    nameTextStyle: {    // 坐标轴名称样式
		      color: 'black',
		      padding: [5, 0, 0, 5]  // 坐标轴名称相对位置
		    },
		    nameGap: 15, // 坐标轴名称与轴线之间的距离
		    nameRotate: 360,  // 坐标轴名字旋转

		    axisLine: {    // 坐标轴 轴线
		      show: true,  // 是否显示
		      //  -----   箭头 -----
		      symbol: ['none', 'arrow'],  // 是否显示轴线箭头
		      symbolSize: [8, 8],  // 箭头大小
		      symbolOffset: [0, 7], // 箭头位置

		      // ----- 线 -------
		      lineStyle: {
		        color: 'black',
		        width: 1,
		        type: 'solid'
		      }
		    },
		    axisTick: {      // 坐标轴的刻度
		      show: true,    // 是否显示
		      inside: true,  // 是否朝内
		      length: 3,      // 长度
		      lineStyle: {
		        color: 'black',  // 默认取轴线的颜色
		        width: 1,
		        type: 'solid'
		      }
		    },
		    axisLabel: {      // 坐标轴的标签
		      show: true,    // 是否显示
		      inside: false,  // 是否朝内
		      rotate: 0,     // 旋转角度
		      margin: 8,     // 刻度标签与轴线之间的距离
		      color: 'black',  // 默认轴线的颜色
		    },
		    splitLine: {    // gird 区域中的分割线
		      show: true,   // 是否显示
		      lineStyle: {
		        color: '#666',
		        width: 1,
		        type: 'dashed'
		      }
		    },
		    splitArea: {     // 网格区域
		      show: false   // 是否显示,默认为false
		    }
		  },
		  //  -------   内容数据 -------
		  series: [
		    {
		      name: '容量',      // 序列名称
		      type: 'bar',      // 类型
		      legendHoverLink: true,  // 是否启用图列 hover 时的联动高亮
		      label: {   // 图形上的文本标签
		        show: false,
		        position: 'insideTop', // 相对位置
		        rotate: 0,  // 旋转角度
		        color: '#eee'
		      },
		      itemStyle: {    // 图形的形状
		        color: 'blue',
		        barBorderRadius: [18, 18, 0 ,0]
		      },
		      barWidth: '50%',  // 柱形的宽度
		      barCategoryGap: '20%',  // 柱形的间距
		      data: [[${ylab}]]
		    }
		  ]
		};
var bar = document.getElementById('bar1');
bar.style.height = tempheight+50+'px';;
var barChart = echarts.init(bar);
barChart.setOption(option);

window.onresize = function(){
    barChart.resize();
}
