
Author: vivo Internet Big Data Team-Wu Yonggang, Li Xiong
This article is the fourth article in the series of articles "Practice of User Behavior Analysis Model" by the vivo Internet big data team - Retention Analysis Model.
This article introduces the concept and basic principles of the retention analysis model in detail, and explains its specific implementation in the product. In view of the problems in the actual use process, a practical solution based on the ClickHouse retention analysis model was explored.
1. Background requirements
According to statistics from CNNIC, China's Internet users have reached 1.079 billion, and the Internet penetration rate has reached 79.4%. Although the Internet is still growing rapidly, the number of users is gradually saturated. The Internet has actually entered the era of existing users. The overall traffic competition is becoming more and more fierce, and user retention is becoming more and more important than attracting new users. Therefore, how to identify loyal users and understand the retention performance of the target user group? How to analyze user churn and optimize products? How to analyze whether the target users have completed the desired behavior and so on are important topics in our data analysis, and the retention analysis model is an important tool for us to solve these problems.
2. Overview
2.1 Concept introduction
The retention analysis model is mainly used to analyze the ratio of users who triggered the initial event to trigger subsequent events (i.e. return visit events) in subsequent time periods. This model can better reflect the user's loyalty or user stickiness. There are several important concepts to understand about the retention analysis model:
Retention analysis generally requires specifying the starting event and return visit event, but the start event and return visit event can be the same or different:
1. You can choose the same event for the initial event and return visit event. This can intuitively see the number of loyal users who triggered the event.
For example: during the sign-in process, the initial event is sign-in success, and the return visit event is sign-in success. Within a period of time, the number of users who continuously trigger this event can be the number of loyal users.
2. You can choose different events for the initial event and return visit event. This is the user retention data under a relatively normal process.
For example: In a certain activity, from order placement to successful payment, the starting event is order placement and the return visit event is payment success. Within a period of time, the same user who triggers these two events is the designated process. of user retention data.
2.2 Analysis ideas
Retention rate is one of the core indicators of a product. We enhance product capabilities, improve user experience, and analyze target users to a large extent to improve this indicator. For example, we can evaluate whether a certain iteration is positive by calculating the retention rate on N days. As shown in Figure 1, if an application optimizes the homepage layout and launches new version A, it can be combined with old version B to calculate the daily user retention rate. It will generally form a decaying retention curve. The slower the curve decays, the higher our retention rate is, which also reflects that the modification of our homepage has a positive effect. Of course, sometimes the improvement in retention may only be a few tenths of a percent, but on the premise of a large user base, it may also produce some qualitative changes. We can also define specific groups of people as user groups, conduct retention analysis on different user groups, and discover more loyal user groups.
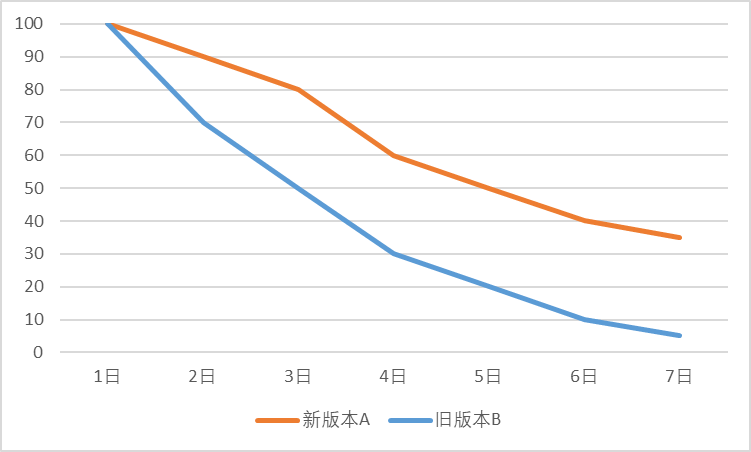
Figure 1 Comparison of retention between new version A and old version B
3. Data analysis using retention
Now that we understand the basic concepts of the retention model above, let’s take a look at how to create one.
3.1 Select a starting event and a return visit event
Starting event: Open the browser.
Return visit event: Exit the browser.
3.2 Set retention days
Set a retention period of 3 days.
3.3 Determine the retention time interval
The concept of time interval here refers to the date interval you need to view. For example, if you select the time interval as 2023-01-06~2023-01-08, then only the three days from 2023-01-06 to 2023-01-08 will be calculated. , each day is retained on the same day, retained on the 1st day, retained on the 2nd day, and retained on the 3rd day.
3.4 Display and calculation logic of retained data
Number of starting users = Number of users triggering the starting event on the calculated date.
The number of retained users on the day = the intersection of users who triggered the return visit event on the day and users who triggered the initial event on the day.
The number of retained users on the first day = the intersection of the users who triggered the return visit event on the next day and the users who triggered the starting event on the calculated date.
The number of retained users on the 2nd day = the intersection of users who triggered the return visit event after 2 days and the users who triggered the starting event on the calculated date.
The number of retained users on the 3rd day = the intersection of users who triggered the return visit event after 3 days and the users who triggered the starting event on the calculated date.
The retention rate of the day = the number of retained users on the day / the initial number of users * 100%.
The retention rate on the first day = the number of retained users on the first day / the number of initial users * 100%.
The retention rate on the second day = the number of retained users on the second day/the initial number of users*100%.
Retention rate on the 3rd day = number of retained users on the 3rd day/initial number of users*100%.
The user retention number table (i.e. Table 1) indicates that when the starting event is "open browser" and the return visit event is "exit browser", it corresponds to the retained users in the past 3 days from 2023-01-06 to 2023-01-09. data.
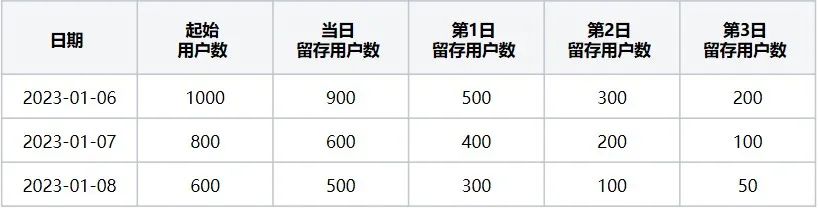
Table 1 User retention number table
The user retention rate table (i.e. Table 2) indicates that when the starting event is "open browser" and the return visit event is "exit browser", it corresponds to the retained users in the past 3 days from 2023-01-06 to 2023-01-08. Proportion data.
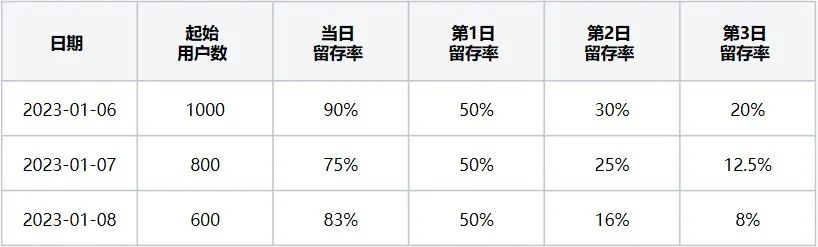
Table 2 User retention rate table
Taking the data of 2023-01-06 in Table 1 as an example, the number of starting users on January 6 is 1,000: refers to the number of users who triggered the starting event "open browser"; the number of retained users on that day: 900: refers to the number of users who triggered the initial event "open browser". The number of users who triggered the return visit event "exit browser" on the same day among the initial event users;
Number of retained users on the first day: 500: refers to the number of users who triggered the return visit event on January 7 and intersected with the initial event on January 6; number of retained users on the second day: 300: refers to the number of users who triggered the return visit event on January 8 And the number of intersection users who triggered the starting event on January 6 is 300, and so on to the third day. At this time, the three days of retained data for the day 2023-01-06 are calculated!
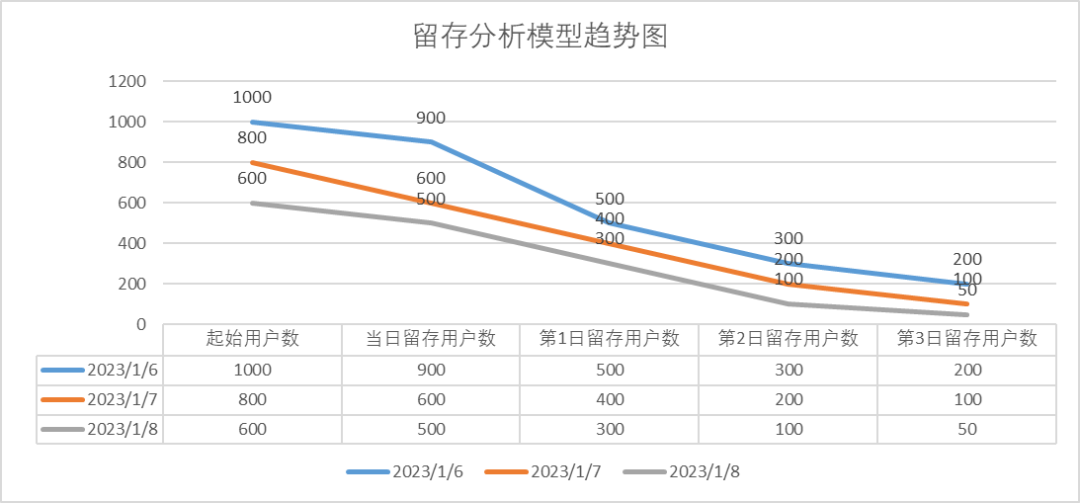
Figure 2: Trend chart of retained users within 3 days corresponding to triggering initial event and return visit event
4. Overall functional design and implementation of retention analysis model
4.1 (Offline) Function Overall Architecture Design
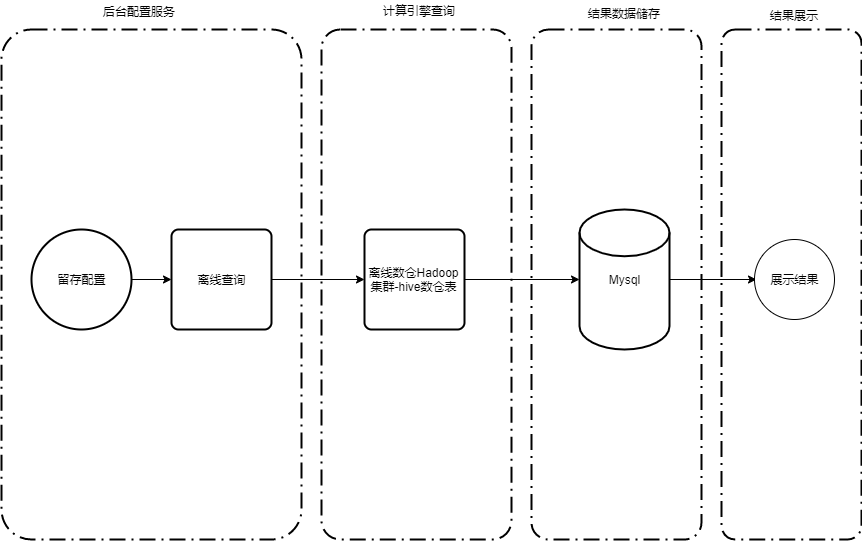
Figure 3 Hive architecture diagram of retention analysis model
The overall architecture is mainly divided into four stages: configuration, calculation, storage, and display.
1. Configuration
This stage is mainly about the implementation of background services on the engineering side. Users can set starting events and return visit events, filtering conditions, user group filtering, dimension filtering and other configurations according to their own needs on the platform. After receiving the configuration request, the background service selects different task assemblers according to the retention analysis type to assemble the SQL tasks.
2. Calculation
Based on the received query method, the platform selects the offline query Spark engine for analysis and calculation. Offline calculation results are synchronized to MySQL.
3. Storage
The offline result set is persisted to the MySQL database and can be displayed to the user through the background service.
4. Display
The offline results are displayed according to the chart configuration ID by querying the MySQL result table data. The instant query is directly queried and displayed after the configuration.
4.2 (Offline) Implement SQL under different retention conditions
Offline universal execution of hive task SQL
Offline retention hive execution SQL
The meanings of the fields in SQL are:
[origin_day]: starting retention calculation date
[day]: Final retention calculation date
[diff]: On which day to save
[user]: Number of starting users
【retention】:retention number
The above SQL meaning: Query the detailed retention data of each day in the interval from the start retention calculation date to the start time and end time. The complete retention data in the time interval cannot be calculated at one time. It requires cumulative query over multiple days, and The result of this SQL execution is displayed as an inverted triangle filling in the retained result table.
For example: After we set the starting event and return visit event, we calculate the 3-day retention for each day from 2022-05-01 to 2022-05-05. At this time, the starting time is 2022-05-01 and the ending time is 2022- 05-05, the retention period is 3 days.
For this case, the starting retention calculation date should be 2022-05-01~2022-05-08, so that the 3-day retention can be calculated for each day from 2022-05-01~2022-05-05.
Step 1 : Calculate the starting retention date = 2022-05-01, and the final retention calculation date range is the daily retention data from 2022-05-01 to 2022-05-05. From a time perspective, the starting retention calculation date It can only calculate the retention on 2022-05-01. The results after execution are as follows (Table 3):
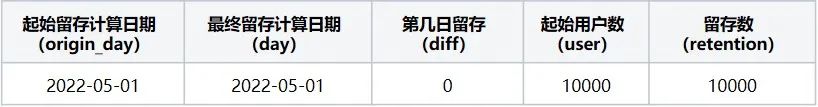
table 3
起始留存计算日期2022-05-01在2022-05-01~2022-05-05区间内留存详情数据
此时转换后留存数据表格为(表4):
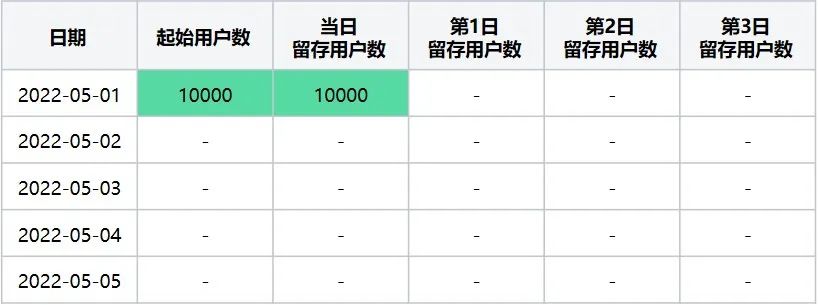
表4
起始留存计算日期2022-05-01在2022-05-01~2022-05-05区间内转换后留存数据表
第二步:计算起始留存日期 = 2022-05-02时,最终留存计算日期区间2022-05-01~2022-05-05日每天的留存数据,该起始留存计算日期可计算2022-05-01日的第1日留存用户数及2022-05-02日当日留存用户数据,执行后结果如下(表5):
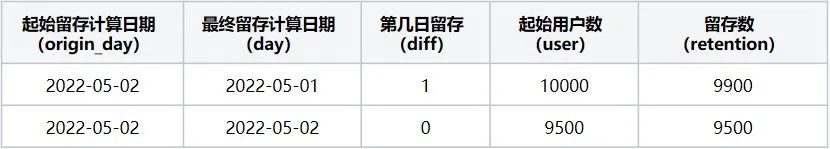
表5
起始留存计算日期2022-05-02在2022-05-01~2022-05-05区间内留存详情数据
此时转换后留存数据表格为(表6):
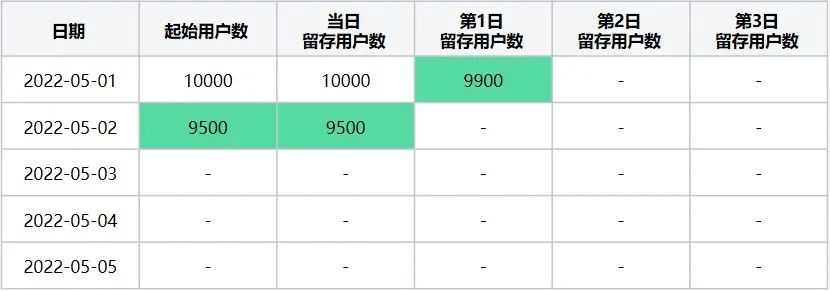
表6
起始留存计算日期2022-05-02在2022-05-01~2022-05-05区间内转换后留存数据表
第三步:计算起始留存日期 = 2022-05-03时,最终留存计算日期区间2022-05-01~2022-05-05日每天的留存数据,该起始留存计算日期可计算2022-05-01日的第2日留存用户数、2022-05-02日第1日留存用户数据、2022-05-03日当日留存用户数据,执行后结果如下(表7):
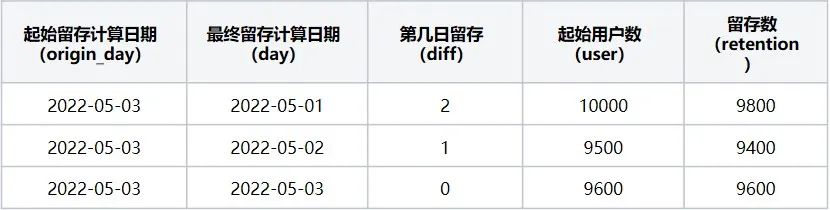
表7
起始留存计算日期2022-05-03在2022-05-01~2022-05-05区间内留存详情数据
此时转换后留存数据表格为(表8):
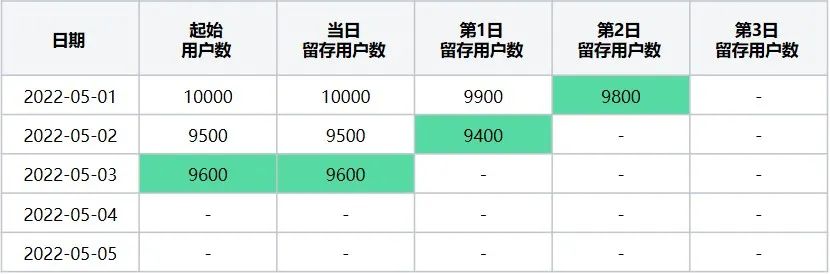
表8
起始留存计算日期2022-05-03在2022-05-01~2022-05-05区间内转换后留存数据表
第四步:以此类推,计算起始留存日期 = 2022-05-08时,最终留存计算日期区间2022-05-01~2022-05-05日每天的留存数据,该起始留存计算日期可计算2022-05-05日的第3日留存用户数,执行后结果如下(表9):
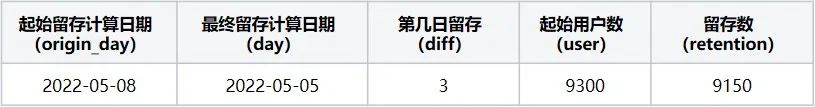
表9
起始留存计算日期2022-05-08在2022-05-01~2022-05-05区间内留存详情数据
最终数据展示完全后会是一个完整的表格(可得如下结果表10):
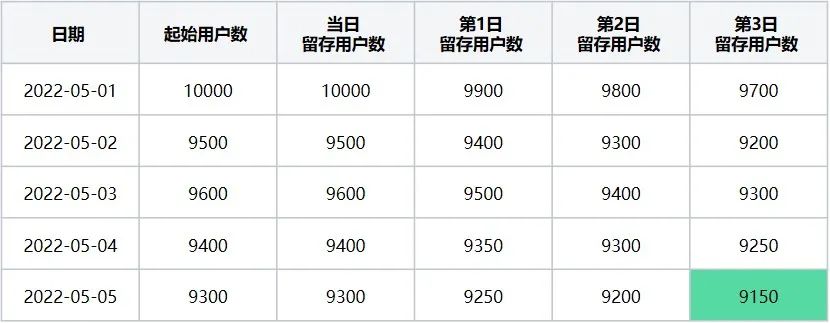
表10
2022-05-01~2022-05-05的每一天的3日留存数据表
4.3 存在的问题与下一步优化的方向
存在的问题:
用户在平台上进行报表创建后,在产出报表结果上耗时较长;当配置报表查询周期长,数据量大的情况下,存在计算资源消耗过大的情况。
优化方向:
为了优化报表生成过程,可以考虑使用ClickHouse来处理数据。ClickHouse是一个高性能、分布式、列式存储的数据库系统,特别适合处理大规模数据和复杂查询。
具体而言,可以采用以下ClickHouse特性:
将数据导入ClickHouse中,以便更快地查询和计算。ClickHouse支持高效的数据导入和压缩方式,可以大大减少数据的存储空间和查询时间。
利用ClickHouse的列式存储和分布式计算能力,实现增量计算和数据预处理。通过使用ClickHouse的分布式计算能力,可以将计算任务分配给多个节点并行处理,从而加快计算速度。同时,通过使用ClickHouse的列式存储能力,可以避免不必要的数据读取和计算,提高计算效率。
利用ClickHouse的缓存机制,提高查询效率。ClickHouse支持高效的缓存机制,可以将查询结果缓存在内存中,以便更快地响应查询请求。
利用ClickHouse的SQL查询语言,实现灵活的数据分析和报表生成。ClickHouse支持SQL查询语言,可以方便地进行数据分析和报表生成,同时也支持复杂查询和聚合操作,可以满足各种数据分析需求。
通过利用ClickHouse上述特性,进一步提高整个数据分析过程的效率和准确性。
五、基于ClickHouse的留存分析模型
5.1 利用ClickHouse查询速度快的特性改造离线留存图表产出方式
利用ClickHouse进行实时留存查询
传统的离线留存计算通常需要借助Hadoop、Spark等大数据处理框架,需要消耗大量计算资源和时间。而利用ClickHouse进行离线留存计算,可以大大提高计算速度和效率,可以实现秒级响应和高并发查询。
具体步骤如下:
将用户行为数据导入ClickHouse;
根据查询配置数据组装留存SQL用于查询;
利用ClickHouse的高速查询功能,实时查询留存率数据。
利用ClickHouse进行留存图表的产出
利用ClickHouse进行留存计算和查询后,可以通过数据可视化工具对留存数据进行图表化展示,从而更加直观地了解用户留存情况。例如:
利用数据可视化工具连接ClickHouse数据库,查看留存率数据或者通过http请求查询结果表数据;
通过数据可视化工具绘制留存图表,并进行定制化设计和样式调整。
结合hive、ClickHouse两者优点,可将架构做如下优化,对于历史较长时间日期的结果回溯进行hive查询处理,可在ClickHouse中存储的数据作为每天例行查询存储结果。
例行:是指创建一次图表每日例行执行报表任务,产出数据(例行可回溯ClickHouse中存储日期的留存数据)。
手动:是指在指定时间范围内执行,执行完成产出任务停止。
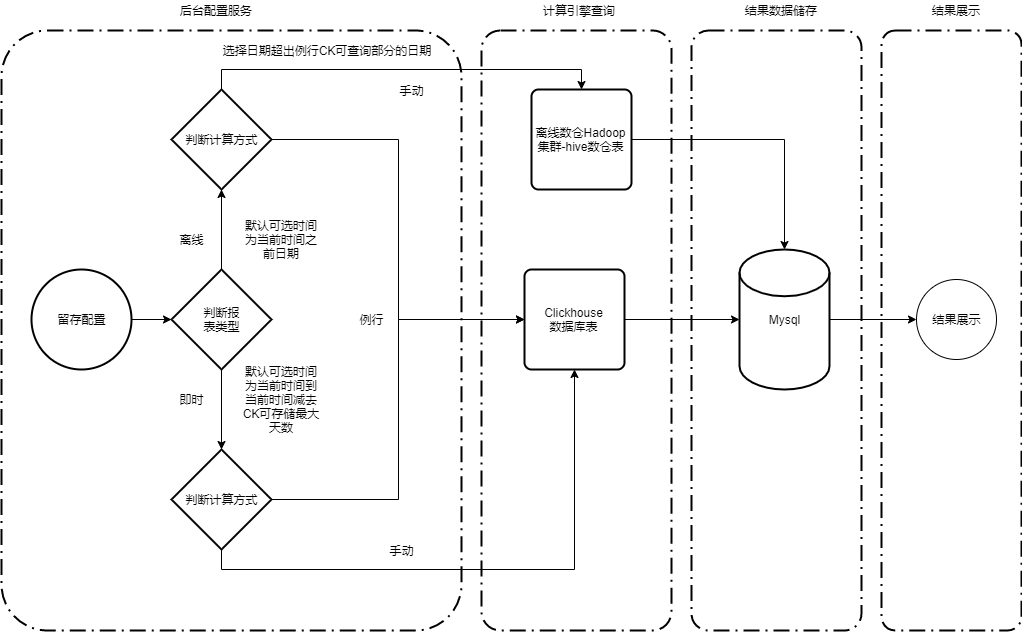
图4 结合ClickHouse、hive后留存分析模型架构图
5.2 主要函数介绍
Retention
该函数将一组条件作为参数,类型为1到32个 UInt8 类型的参数,用来表示事件是否满足特定条件。任何条件都可以指定为参数(如 WHERE)。
除了第一个以外,条件成对适用:如果第一个和第二个是真的,第二个结果将是真的,如果第一个和第三个是真的,第三个结果将是真的,等等。
① 语法
retention(cond1, cond2, ..., cond32);
② 参数
cond — 返回 UInt8 结果(1或0)的表达式。
③ 返回值
数组为1或0。
1 — 条件满足。
0 — 条件不满足。
④ 类型
UInt8
ClickHouse查询SQL
ClickHouse即时查询留存SQL
SQL 当中返回结果含义分别为:
retention_date:留存日期
user:起始用户数
retain0:当日留存用户数
retain1:第1日留存用户数
retain2:第2日留存用户数
retain3:第3日留存用户数
ratio0:当日留存率
ratio1:第1日留存率
ratio2:第2日留存率
ratio3:第3日留存率
以上SQL含义:计算出指定时间区间内3日留存信息,可一次性查询出指定区间内的所有3日留存数据,一个sql即可查询完全。
例如:我们定了起始事件和回访事件后,去计算2022-06-01~2022-06-04的每一天的3日留存,此时,起始时间是2022-06-01,结束2022-06-04,留存天数3天。
针对此案例,在不同的日期查询数据完整性不一致,我们拿2022-06-04日和2022-06-07日两日查询举例。
第一步:针对2022-06-04日进行计算2022-06-01~2022-06-04的每一天的3日留存,执行后留存数据展示结果如下(表11)。
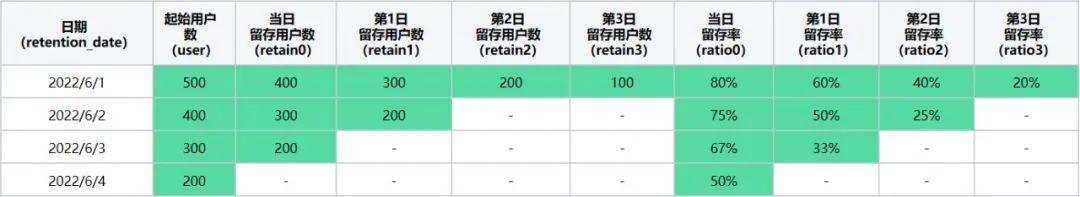
表11
2022-06-04日计算2022-06-01~2022-06-04的每一天的3日留存数据表
第二步:针对2022-06-07日进行计算2022-06-01~2022-06-04的每一天的3日留存,执行后留存数据展示结果如下(表12)。
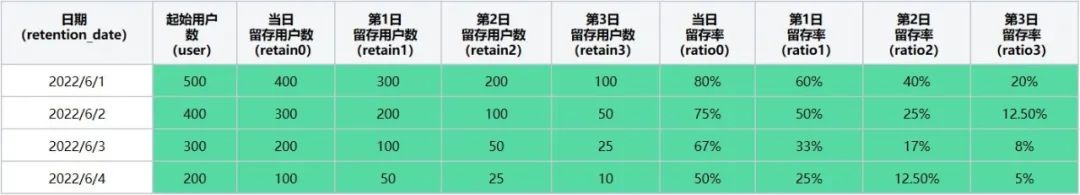
表12
2022-06-08日计算2022-06-01~2022-06-04的每一天的3日留存数据表
趋势结果展示(图5):
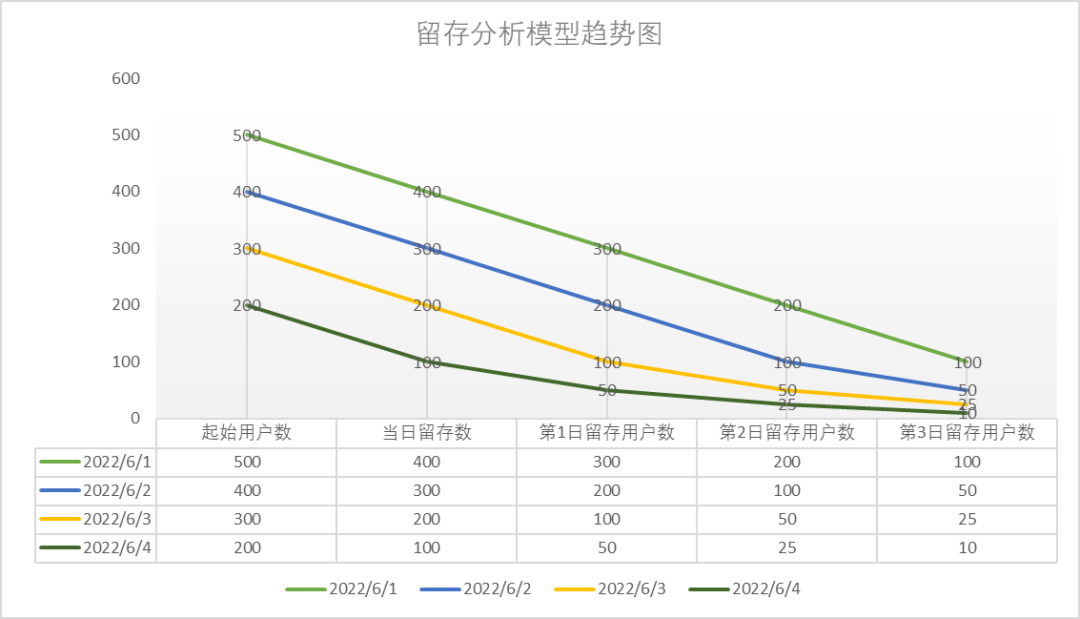
图5 留存分析模型趋势图
六、写在最后
本文介绍的留存模型就是数据分析工具箱的核心分析模型,使用的范围十分广泛。它通过计算用户在一段时间内的留存率,可以评估产品、服务或应用程序的用户体验和吸引力,提高用户留存率和活跃度。在实际的生产中,业务可根据自身具体需求和用户特征进行定制化设计,同时也可将通过留存分析得到的人群信息结合其他的数据分析方法进一步的深入分析。例如,从留存中得到的用户人群信息,我们可以进一步的使用路径分析的分析方法,分析用户的访问行为对于产品的影响。
数据分析的工具方法有很多,除了上面提到过得用于分析用户在应用上的访问行为的用户路径分析;也有衡量业务中关键事件之间转化效果的漏斗分析;还有事件分析、归因分析等等,他们共同组成的强大的数据分析工具箱,可以较为全面的分析用户行为的潜在特征与规律,帮助产品或者决策者作为更加可靠的决策。
END
猜你喜欢
本文分享自微信公众号 - vivo互联网技术(vivoVMIC)。
如有侵权,请联系 [email protected] 删除。
本文参与“OSC源创计划”,欢迎正在阅读的你也加入,一起分享。