In this case, we will use Databend Cloud to analyze the Taobao user shopping behavior data set from Tianchi Lab and discover interesting shopping behaviors together.
This data set is in CSV format and contains all the behaviors (including clicks, purchases, additional purchases, and likes) of about one million random users who acted between November 25, 2017, and December 3, 2017. Each row of the data set represents a user behavior and consists of the following 5 columns, separated by commas:
| Column name | illustrate |
|---|---|
| User ID | Integer type, serialized user ID |
| Product ID | Integer type, serialized product ID |
| Product Category ID | Integer type, serialized product category ID |
| behavior type | String, enumeration type, including: 'pv': pv of product details page, equivalent to click; 'buy': purchase of product; 'cart': add product to shopping cart; 'fav': collect product |
| Timestamp | The timestamp when the behavior occurred |
Preparation
Download dataset
- Download the Taobao user shopping behavior data set to your local computer, and then use the following command to decompress it:
unzip UserBehavior.csv.zip
- Compress the decompressed data set file (UserBehavior.csv) into gzip format:
gzip UserBehavior.csv
Create an external stage
- Log in to Databend Cloud and create a new workspace.
- In the workspace, execute the following SQL statement to create an external Stage named "mycsv" on Alibaba Cloud:
CREATE STAGE mycsv URL = 's3://<YOUR_BUCKET_NAME>'
CONNECTION = (
  ACCESS_KEY_ID = '<YOUR_ACCESS_KEY_ID>',
  SECRET_ACCESS_KEY = '<YOUR_SECRET_ACCESS_KEY>',
  ENDPOINT_URL = '<YOUR_ENDPOINT_URL>',
  ENABLE_VIRTUAL_HOST_STYLE = TRUE
)
FILE_FORMAT = (
  TYPE = CSV
  COMPRESSION = AUTO
);
- Execute the following SQL statement to verify whether Databend Cloud can access the external Stage:
LIST @mycsv;
Upload dataset to external Stage
Use BendSQL to upload the compressed data set file (UserBehavior.csv.gz) to the external Stage. To obtain the connection information of the computing cluster, please refer to Connecting to the Computing Cluster .
(base) eric@Erics-iMac ~ % bendsql --host tenantID--YOUR_WAREHOUSE.gw.aliyun-cn-beijing.default.databend.cn \
  --user=cloudapp \
  --password=<YOUR_PASSWORD> \
  --database="default" \
  --port=443 --tls
Welcome to BendSQL 0.9.3-db6b232(2023-10-26T12:36:55.578667000Z).
Connecting to tenantID--YOUR_WAREHOUSE.gw.aliyun-cn-beijing.default.databend.cn:443 as user cloudapp.
Connected to DatabendQuery v1.2.183-nightly-1ed9a826ed(rust-1.72.0-nightly-2023-10-28T22:10:15.618365223Z)

cloudapp@tenantID--YOUR_WAREHOUSE.gw.aliyun-cn-beijing.default.databend.cn:443/default> PUT fs:///Users/eric/Documents/UserBehavior.csv.gz @mycsv

PUT fs:///Users/eric/Documents/UserBehavior.csv.gz @mycsv

┌─────────────────────────────────────────────────────────────────┐
│                    file                   │  status │    size   │
│                   String                  │  String │   UInt64  │
├───────────────────────────────────────────┼─────────┼───────────┤
│ /Users/eric/Documents/UserBehavior.csv.gz │ SUCCESS │ 949805035 │
└─────────────────────────────────────────────────────────────────┘
1 file uploaded in 401.807 sec. Processed 1 file, 905.80 MiB (0.00 file/s, 2.25 MiB/s)
Data import and cleaning
Create table
In the workspace, execute the following SQL statement to create a table for the dataset:
CREATE TABLE `user_behavior` (
  `user_id` INT NOT NULL,
  `item_id` INT NOT NULL,
  `category_id` INT NOT NULL,
  `behavior_type` VARCHAR,
  `ts` TIMESTAMP,
  `day` DATE );
Clean and import data
-
Execute the following SQL statement to import data into the table and complete cleaning at the same time:
- Remove invalid data outside the time zone
- Data deduplication
- Generate additional columns of data
INSERT INTO user_behavior
SELECT $1,$2,$3,$4,to_timestamp($5::bigint) AS ts, to_date(ts) day
FROM @mycsv/UserBehavior.csv.gz WHERE day BETWEEN '2017-11-25' AND '2017-12-03'
GROUP BY $1,$2,$3,$4,ts;
- Execute the following SQL statement to verify whether the data import is successful. This statement will return 10 rows of data from the table.
SELECT * FROM user_behavior LIMIT 10;
data analysis
After completing the preliminary preparation and data import, we officially started data analysis.
User traffic and shopping situation analysis
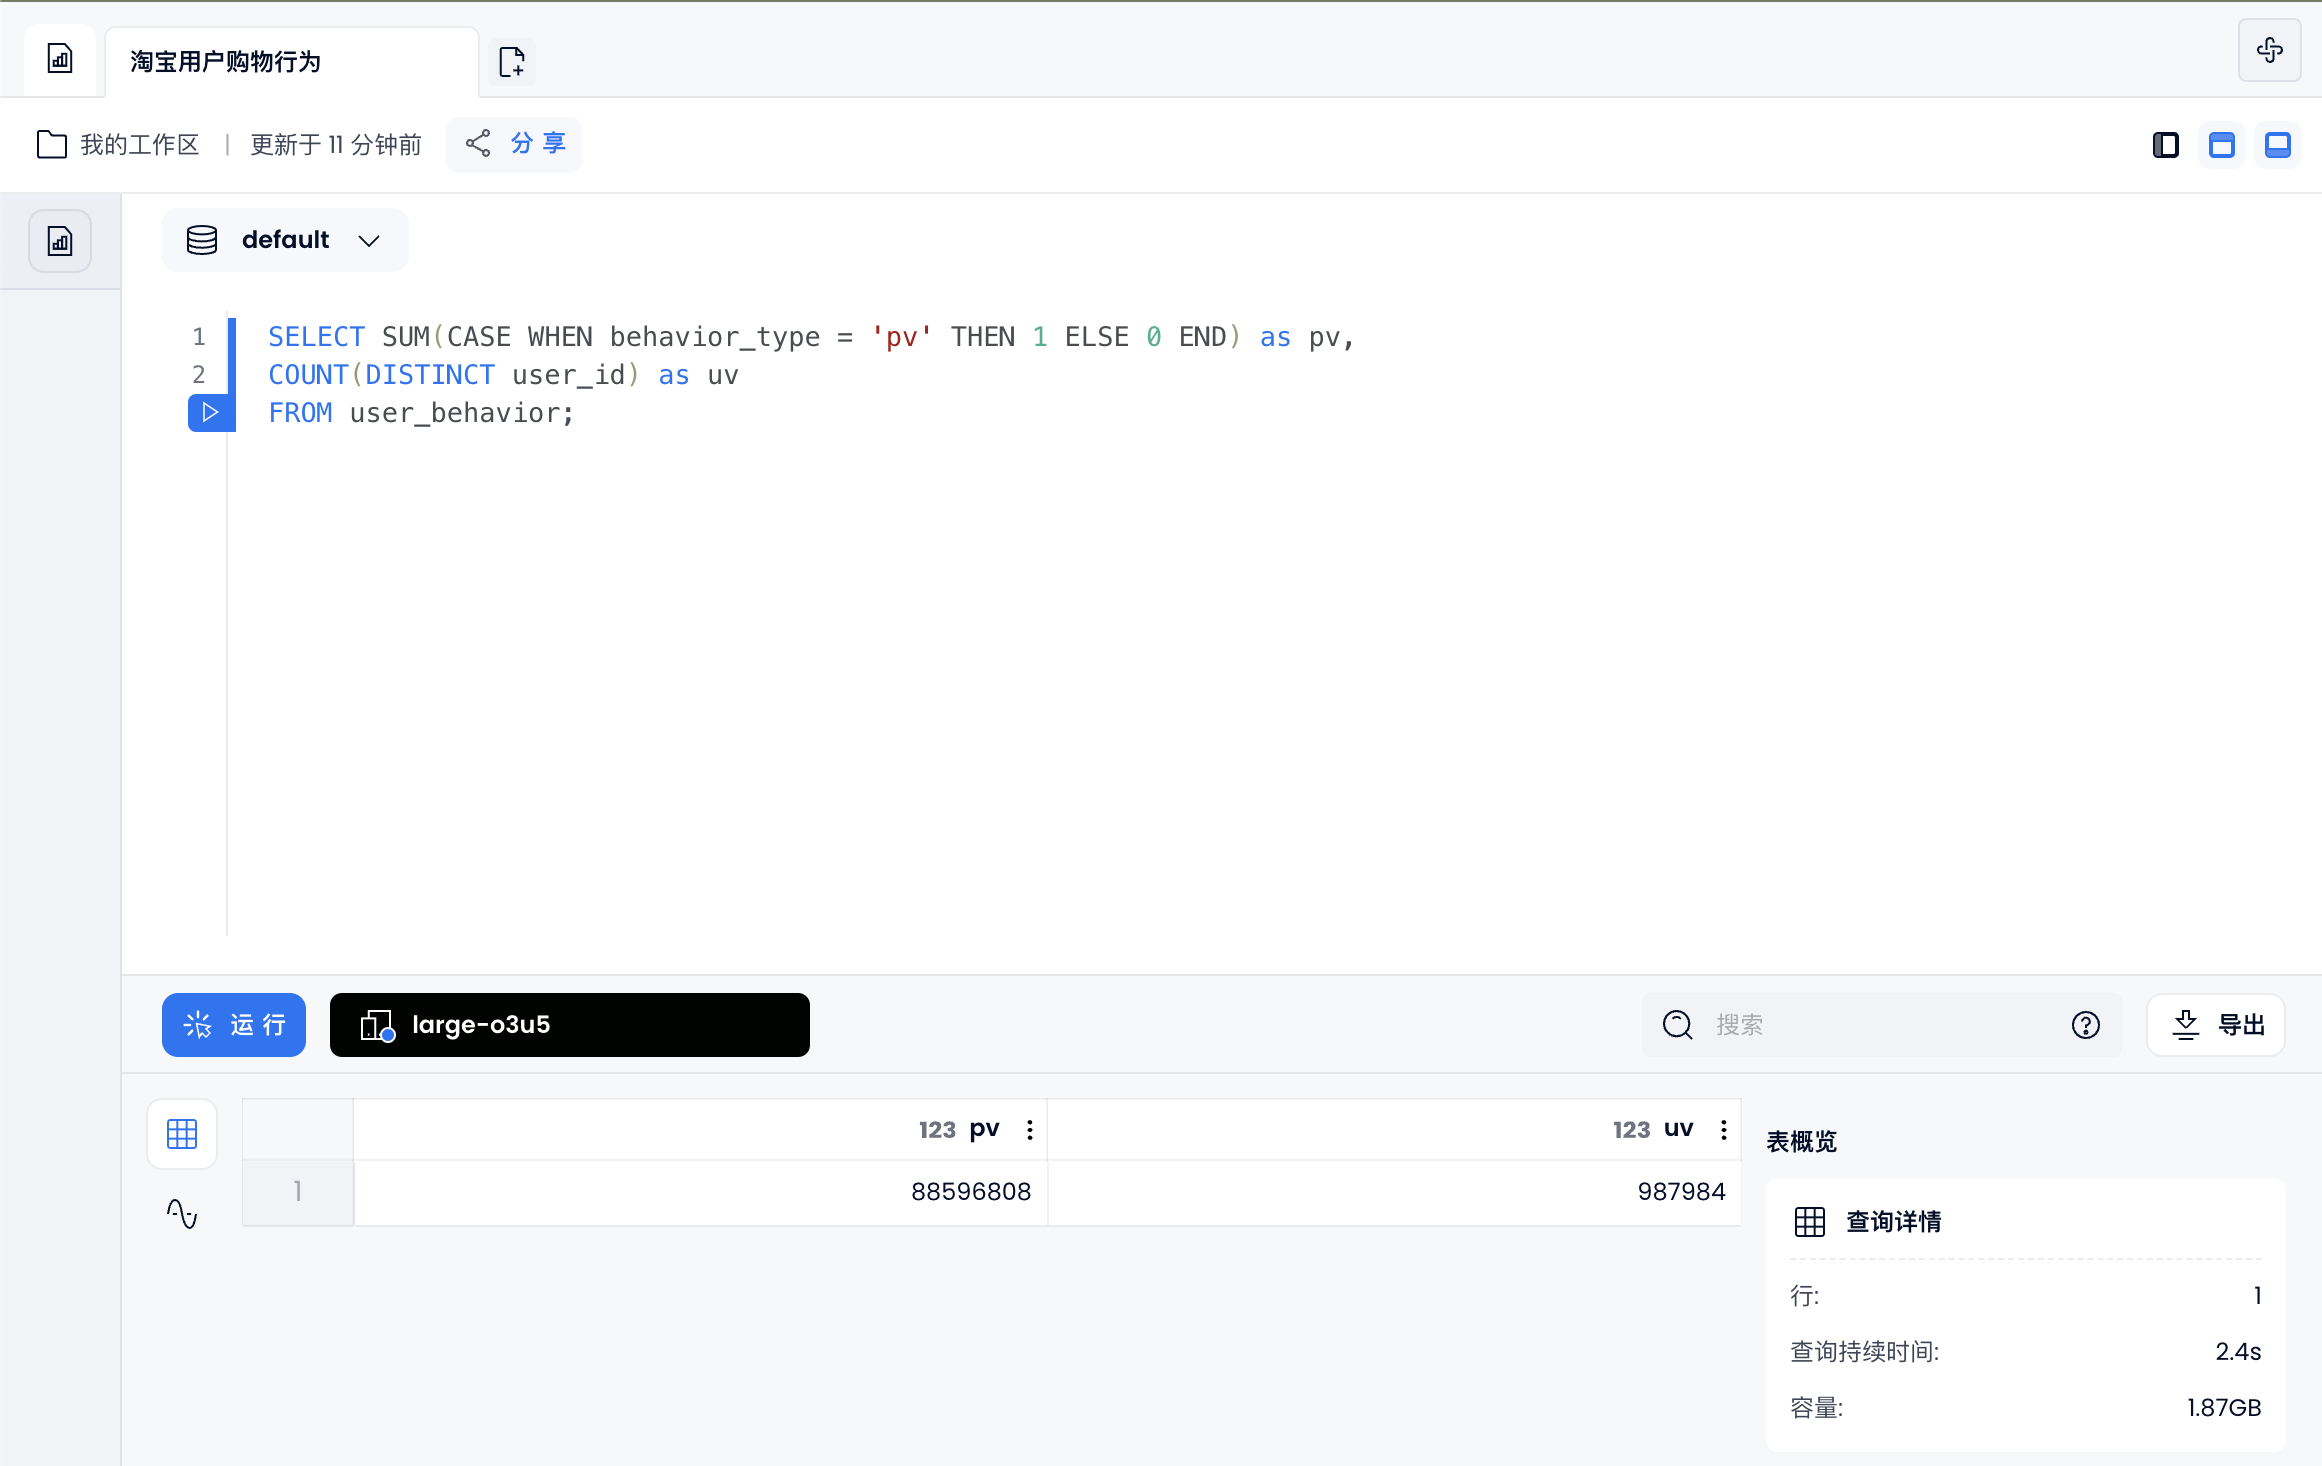
Total visits and number of users
SELECT SUM(CASE WHEN behavior_type = 'pv' THEN 1 ELSE 0 END) as pv,
COUNT(DISTINCT user_id) as uv
FROM user_behavior;
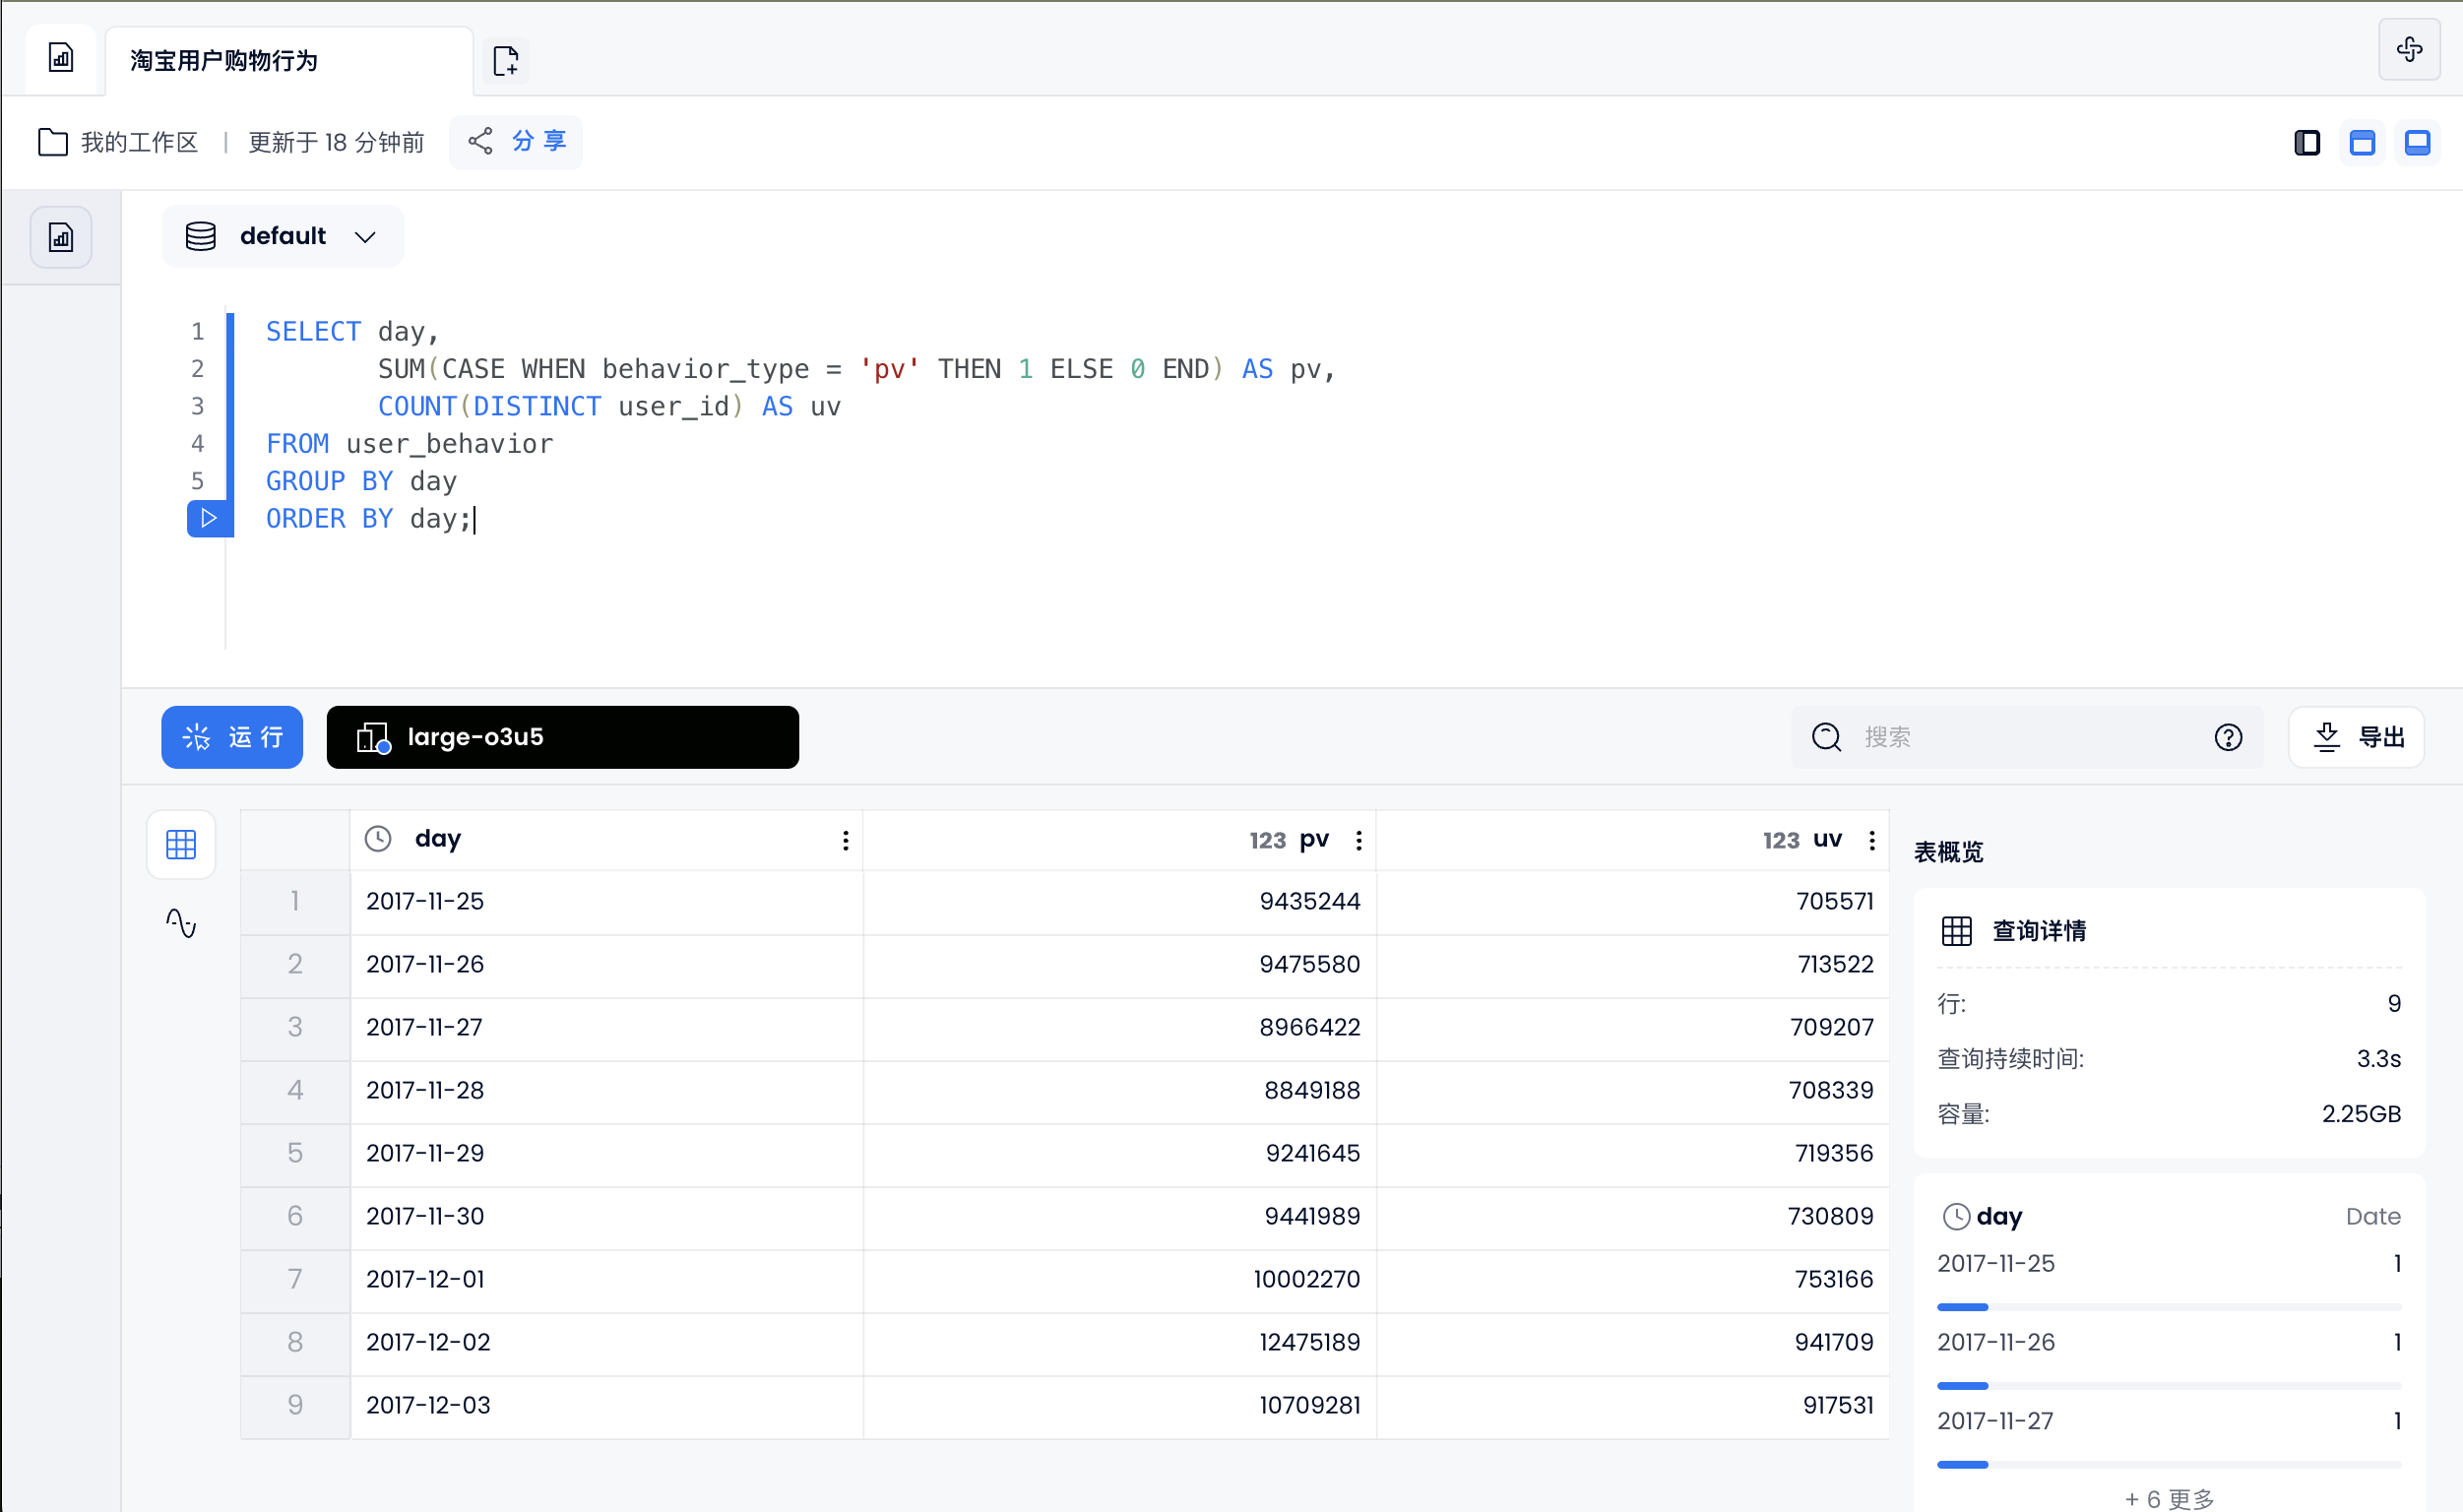
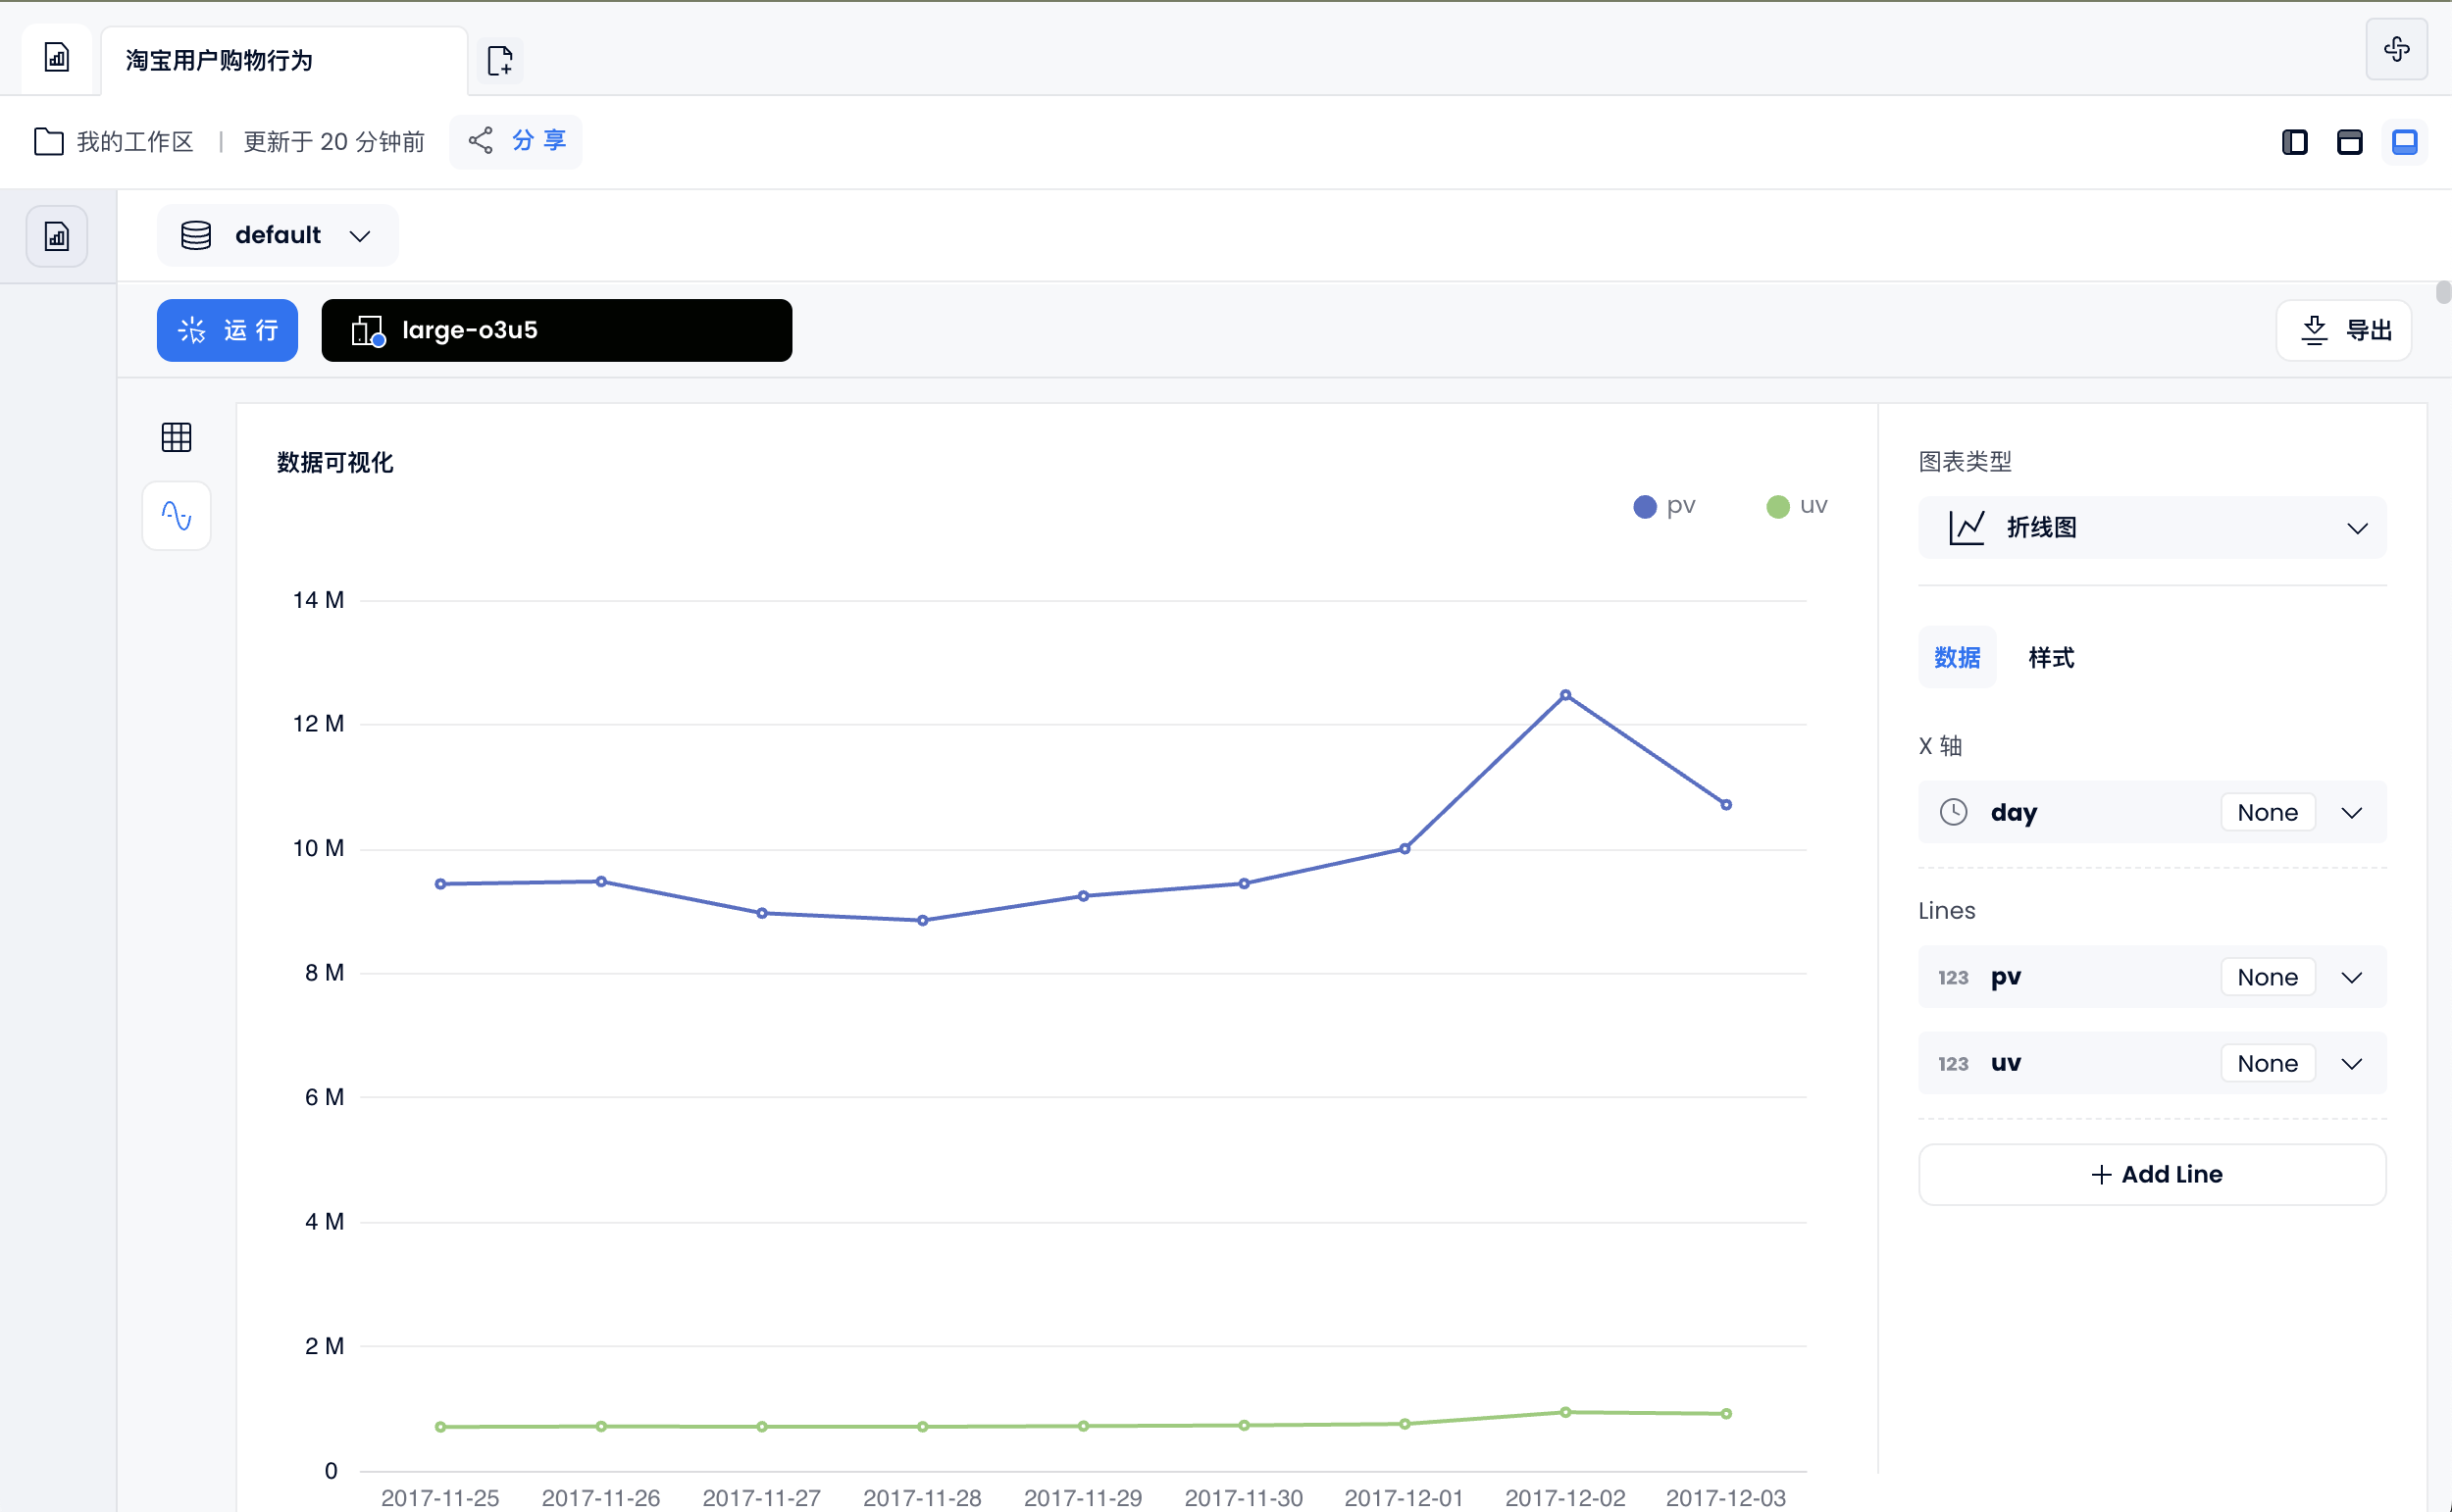
Average daily visits and users
SELECT day,
       SUM(CASE WHEN behavior_type = 'pv' THEN 1 ELSE 0 END) AS pv,
       COUNT(DISTINCT user_id) AS uv
FROM user_behavior
GROUP BY day
ORDER BY day;
You can also generate a line chart by using the dashboard function:
Count each user's shopping situation and generate a new table: user_behavior_count
create table user_behavior_count as select user_id,
       sum(case when behavior_type = 'pv' then 1 else 0 end) as pv,   --点击数
       sum(case when behavior_type = 'fav' then 1 else 0 end) as fav,  --收藏数
       sum(case when behavior_type = 'cart' then 1 else 0 end) as cart,  --加购物车数
       sum(case when behavior_type = 'buy' then 1 else 0 end) as buy  --购买数
       from user_behavior
group by user_id;
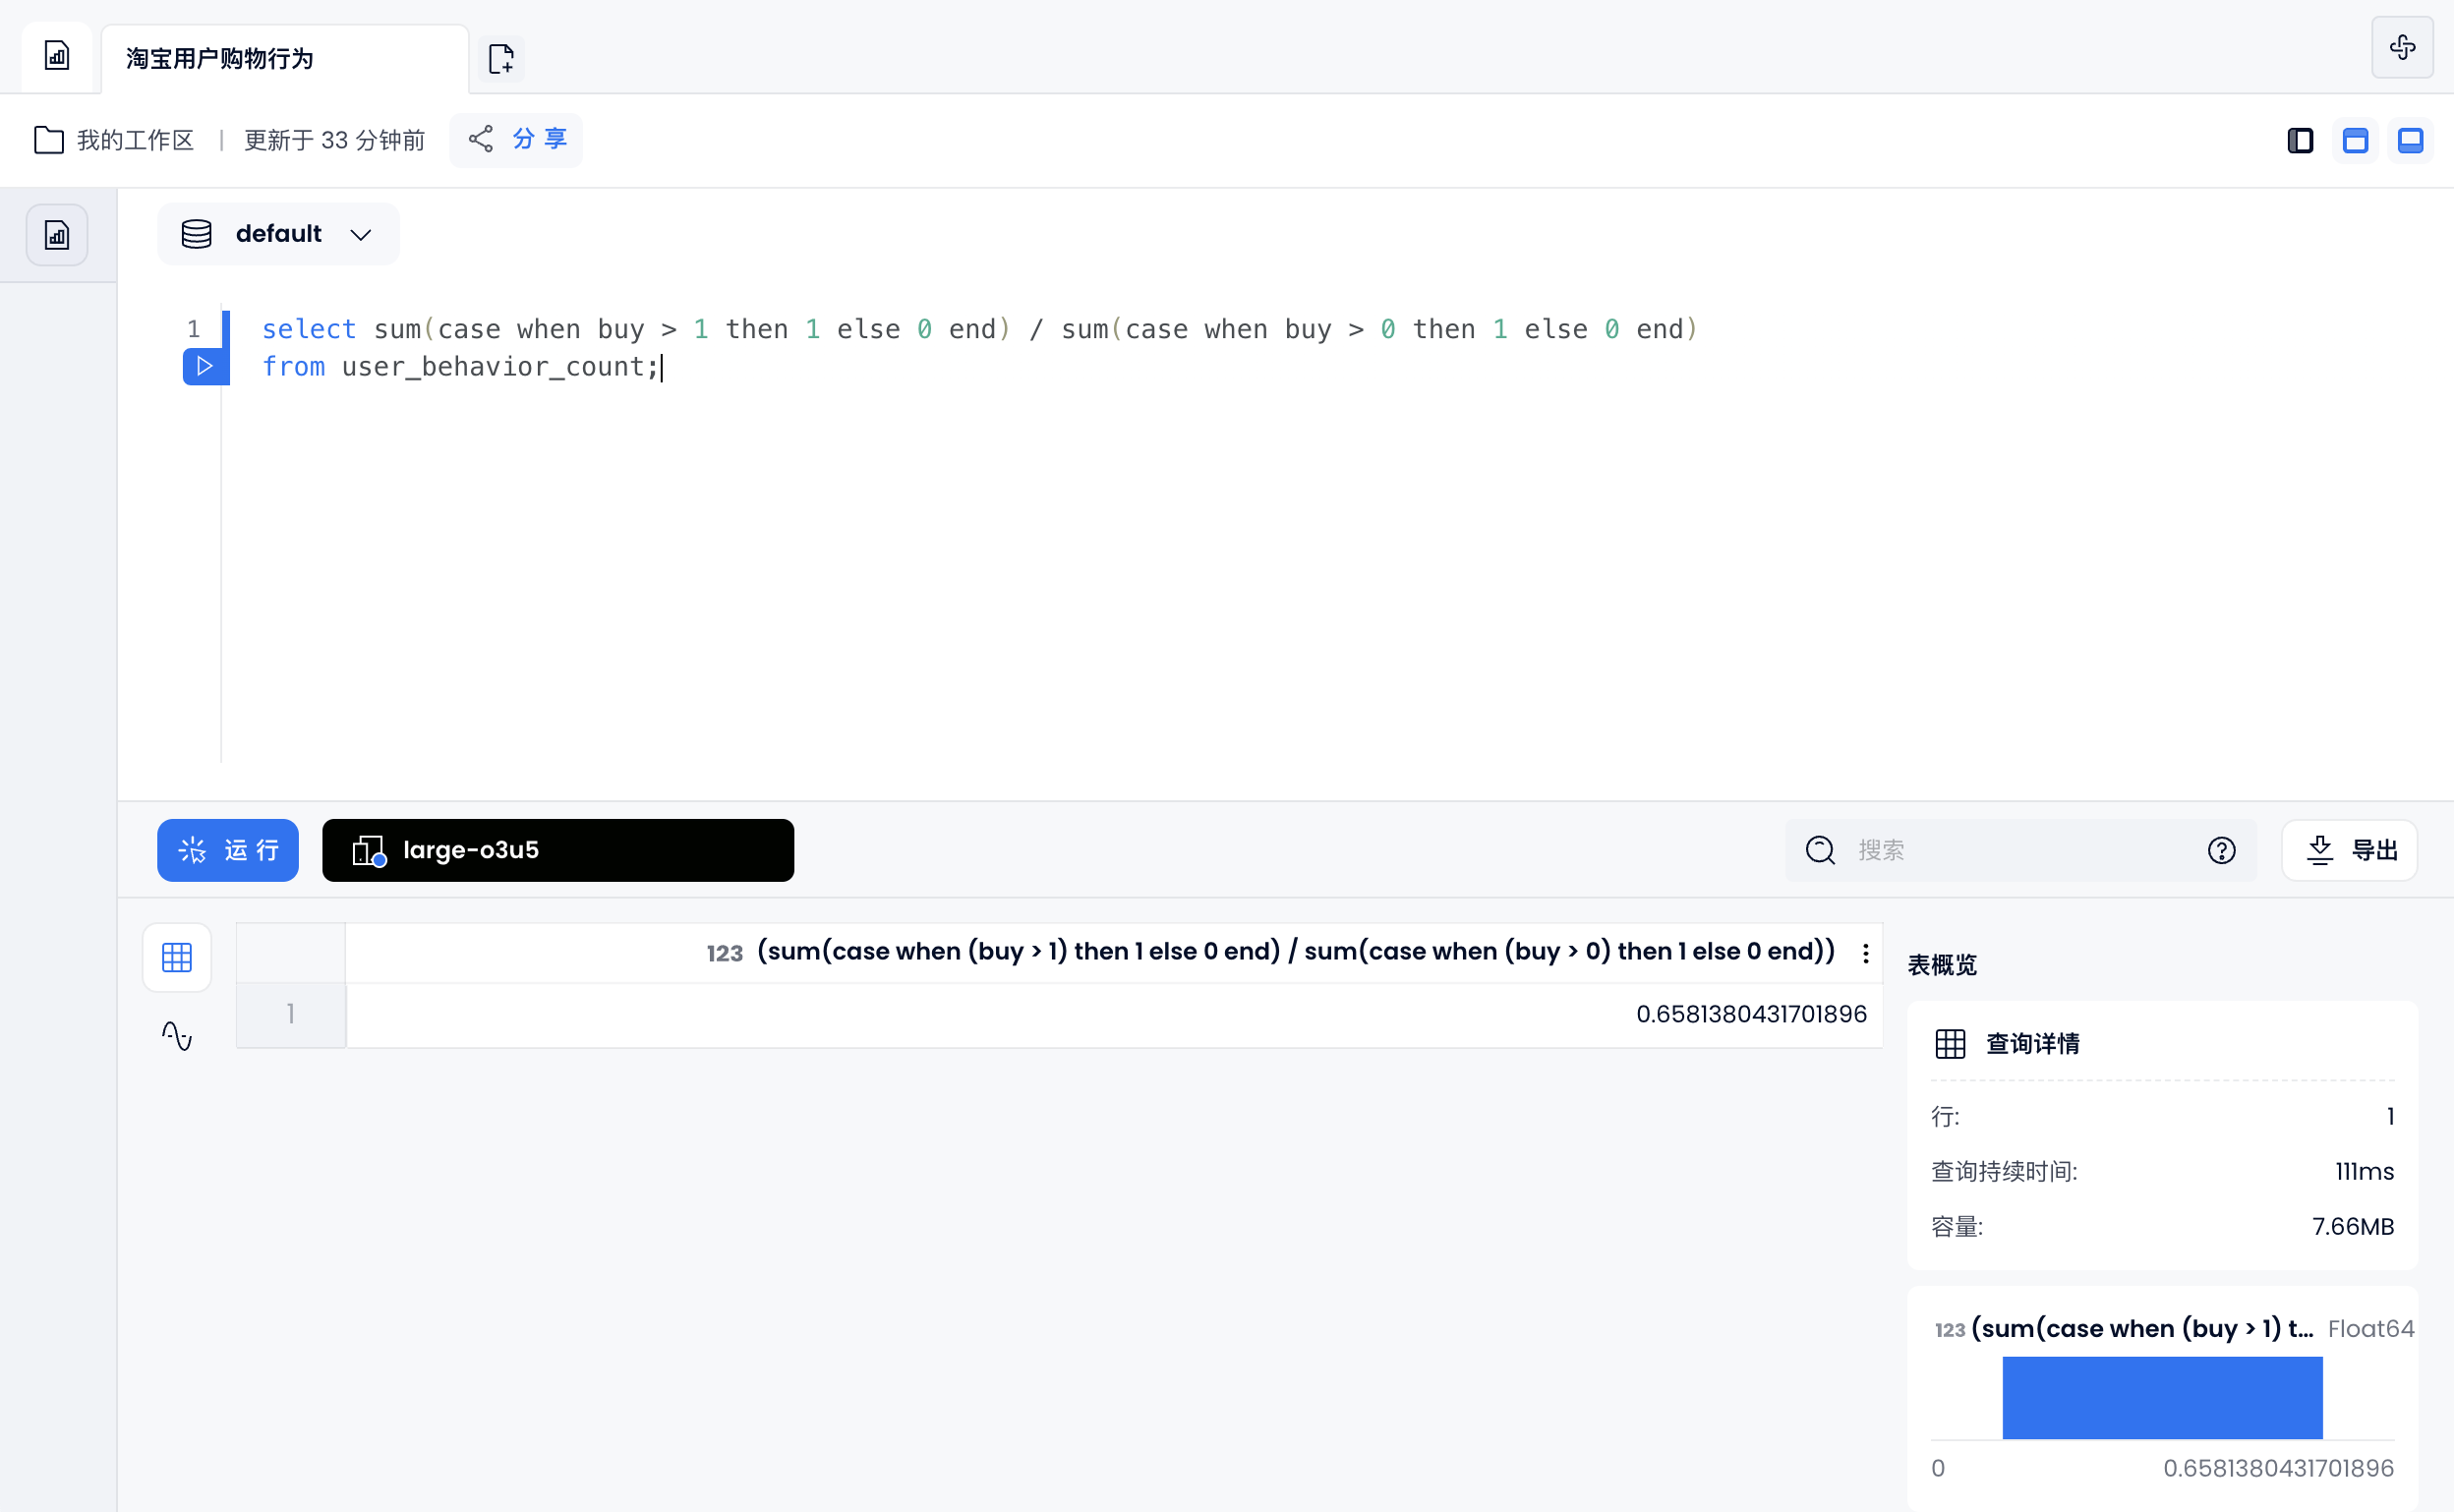
Repurchase rate: the proportion of users who have purchased twice or more than those who have purchased
select sum(case when buy > 1 then 1 else 0 end) / sum(case when buy > 0 then 1 else 0 end)
from user_behavior_count;
User behavior conversion rate
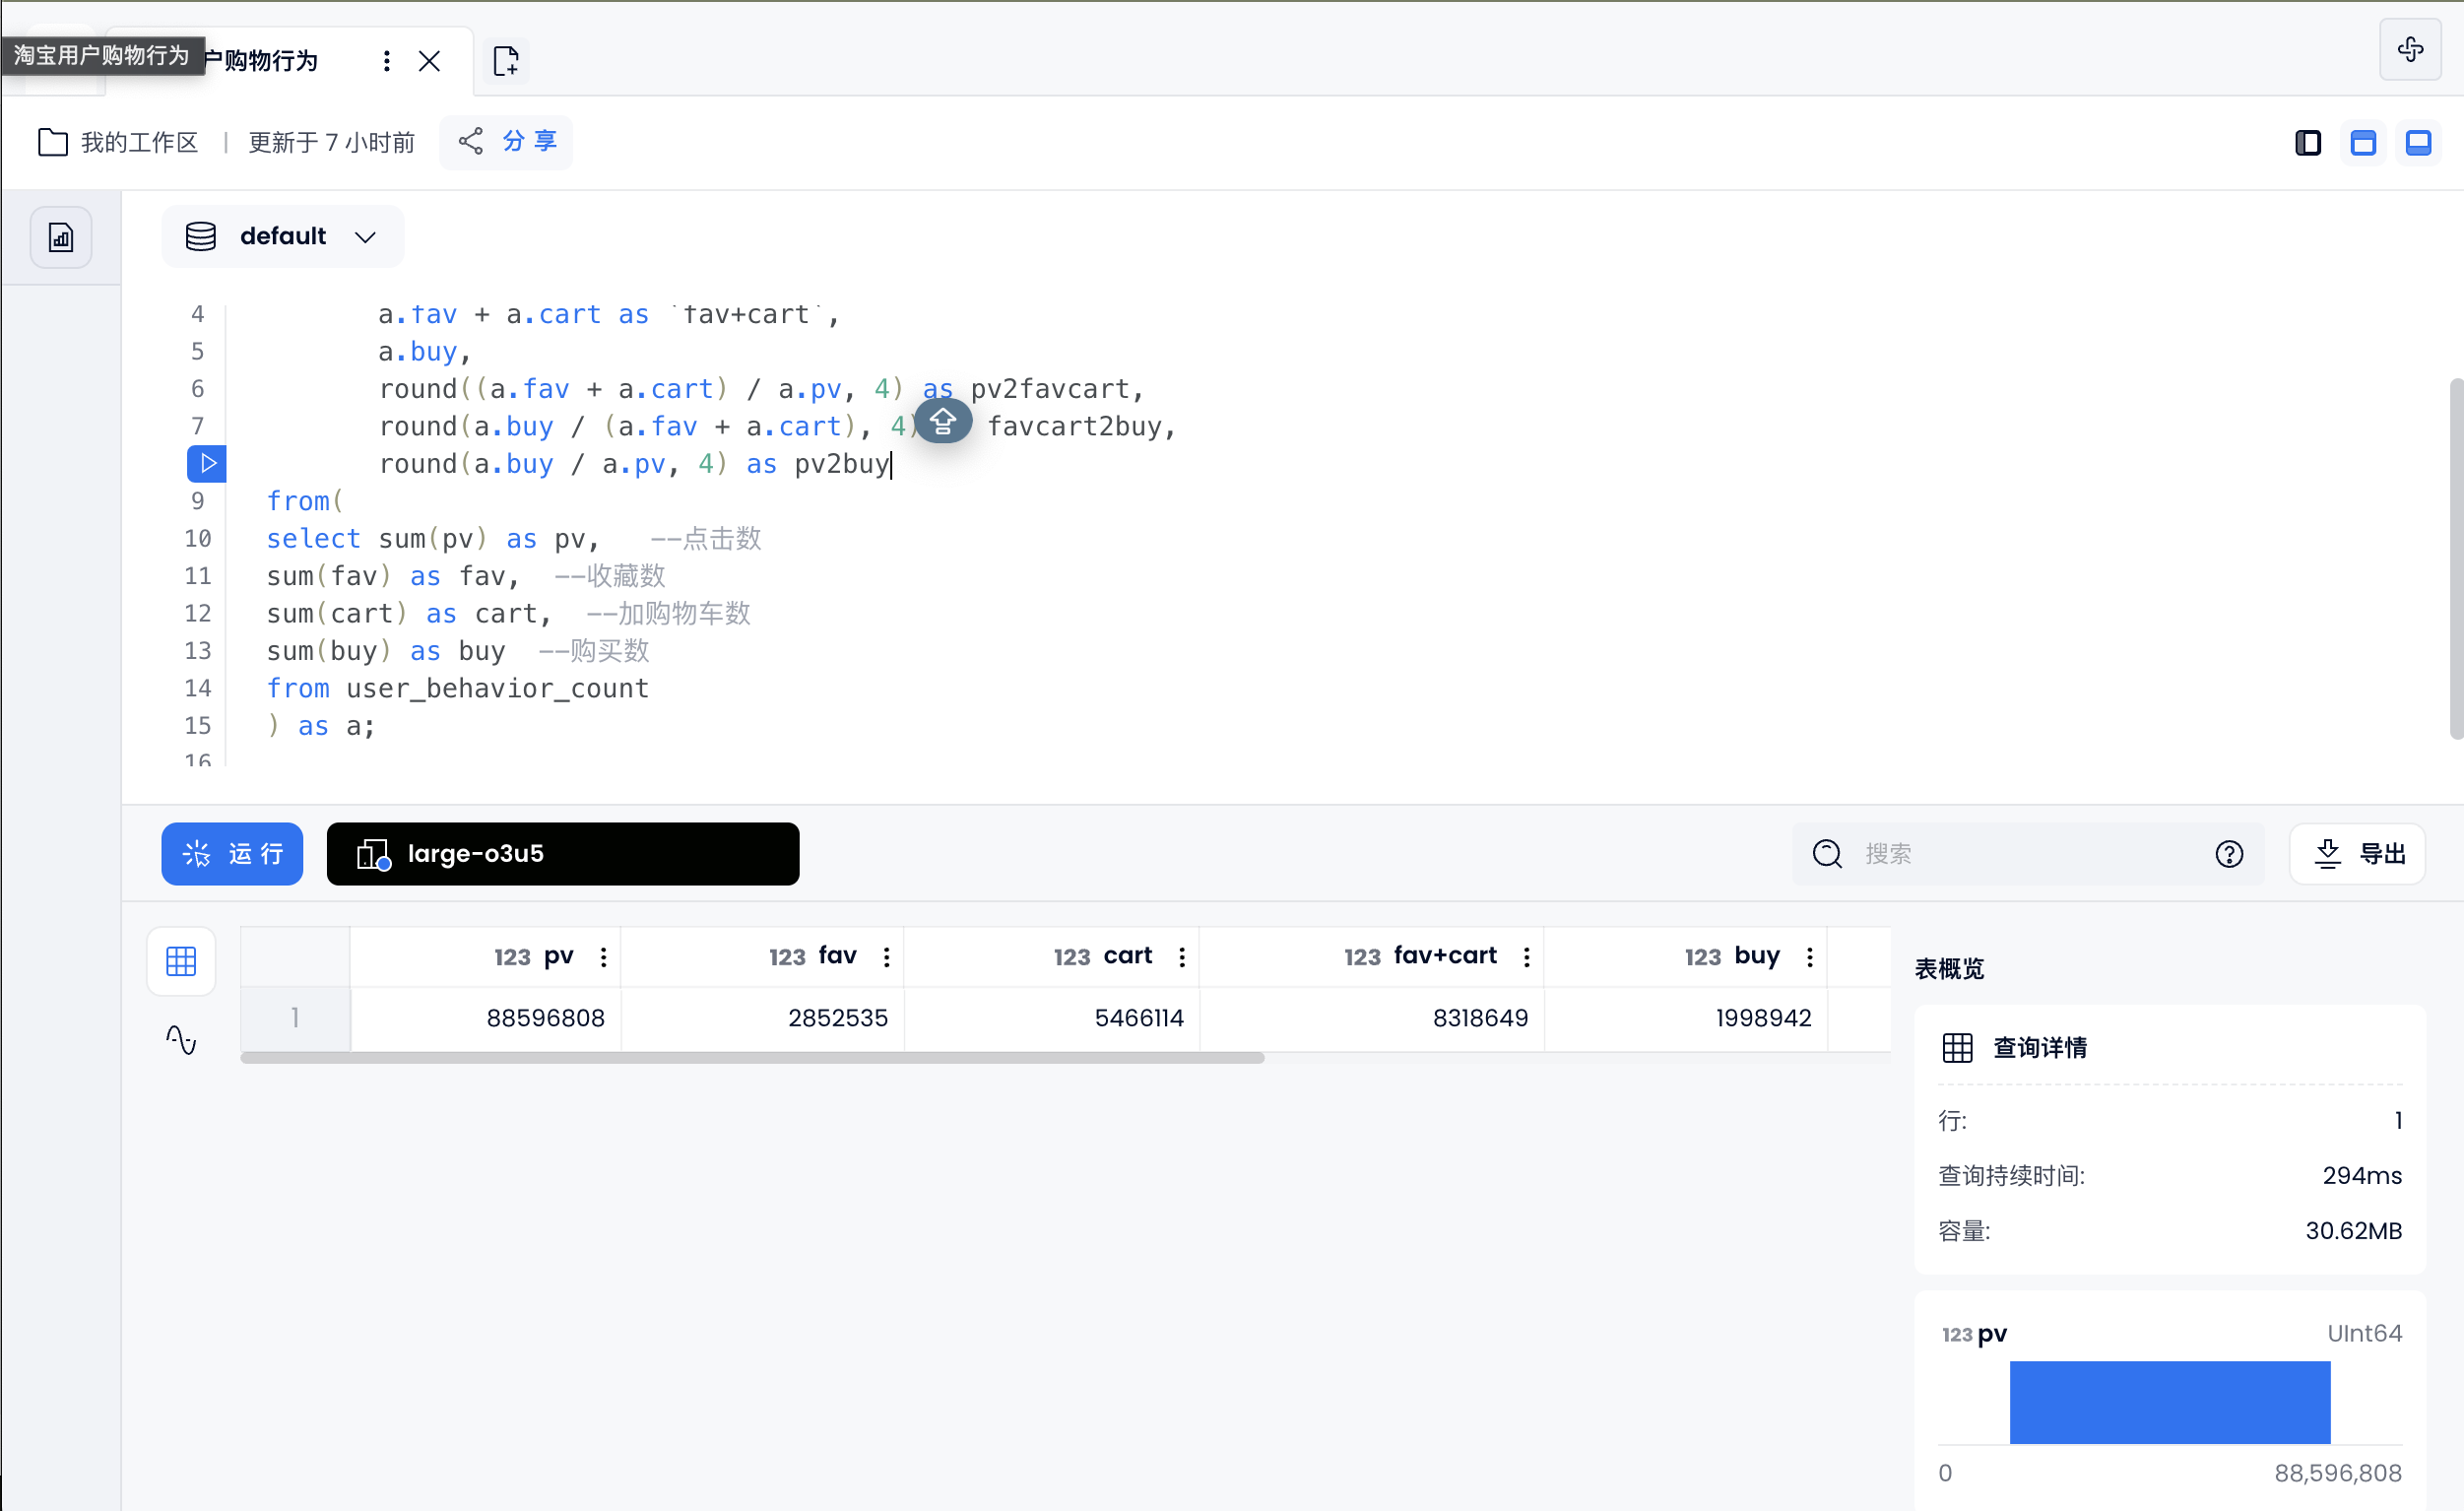
Click/(Add to Cart + Collection)/Purchase, conversion rate of each link
select a.pv,
       a.fav,
       a.cart,
       a.fav + a.cart as `fav+cart`,
       a.buy,
       round((a.fav + a.cart) / a.pv, 4) as pv2favcart,
       round(a.buy / (a.fav + a.cart), 4) as favcart2buy,
       round(a.buy / a.pv, 4) as pv2buy
from(
select sum(pv) as pv,   --点击数
sum(fav) as fav,  --收藏数
sum(cart) as cart,  --加购物车数
sum(buy) as buy  --购买数
from user_behavior_count
) as a;
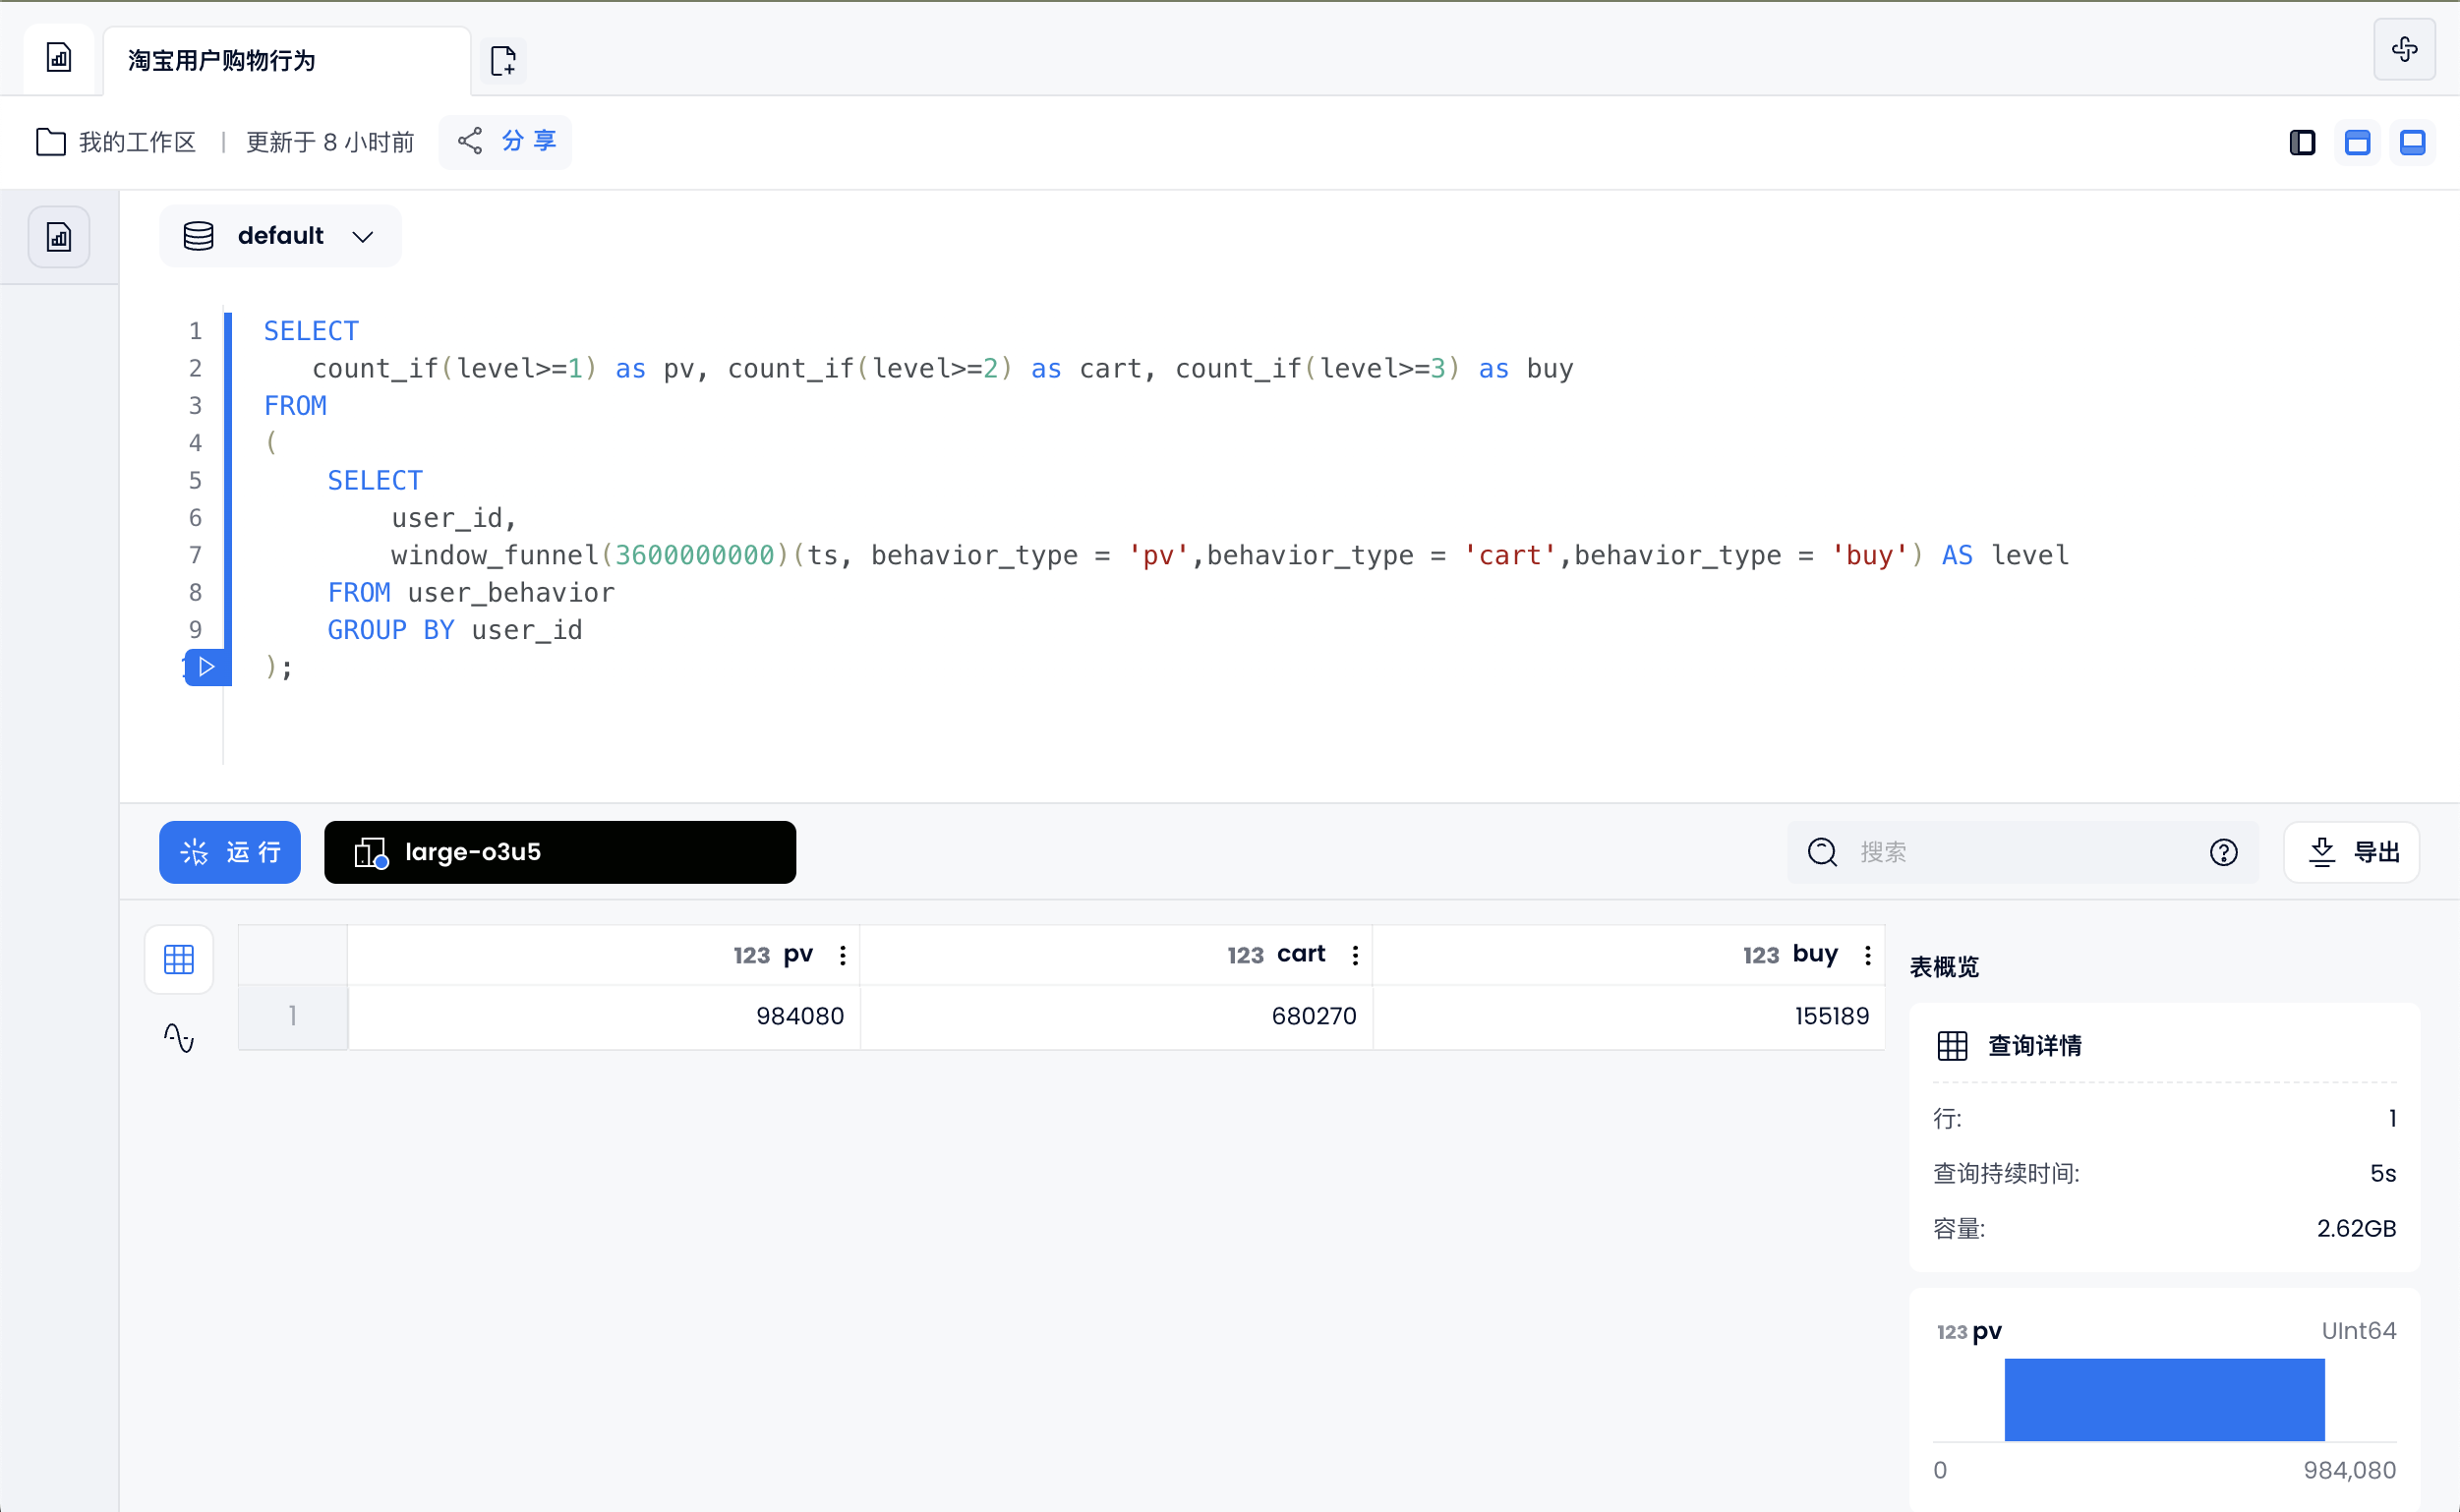
Count the users who completed browsing -> adding to shopping -> and paying in one hour
SELECT
   count_if(level>=1) as pv, count_if(level>=2) as cart, count_if(level>=3) as buy
FROM
(
    SELECT
        user_id,
        window_funnel(3600000000)(ts, behavior_type = 'pv',behavior_type = 'cart',behavior_type = 'buy') AS level
    FROM user_behavior
    GROUP BY user_id
);
User behavior habits
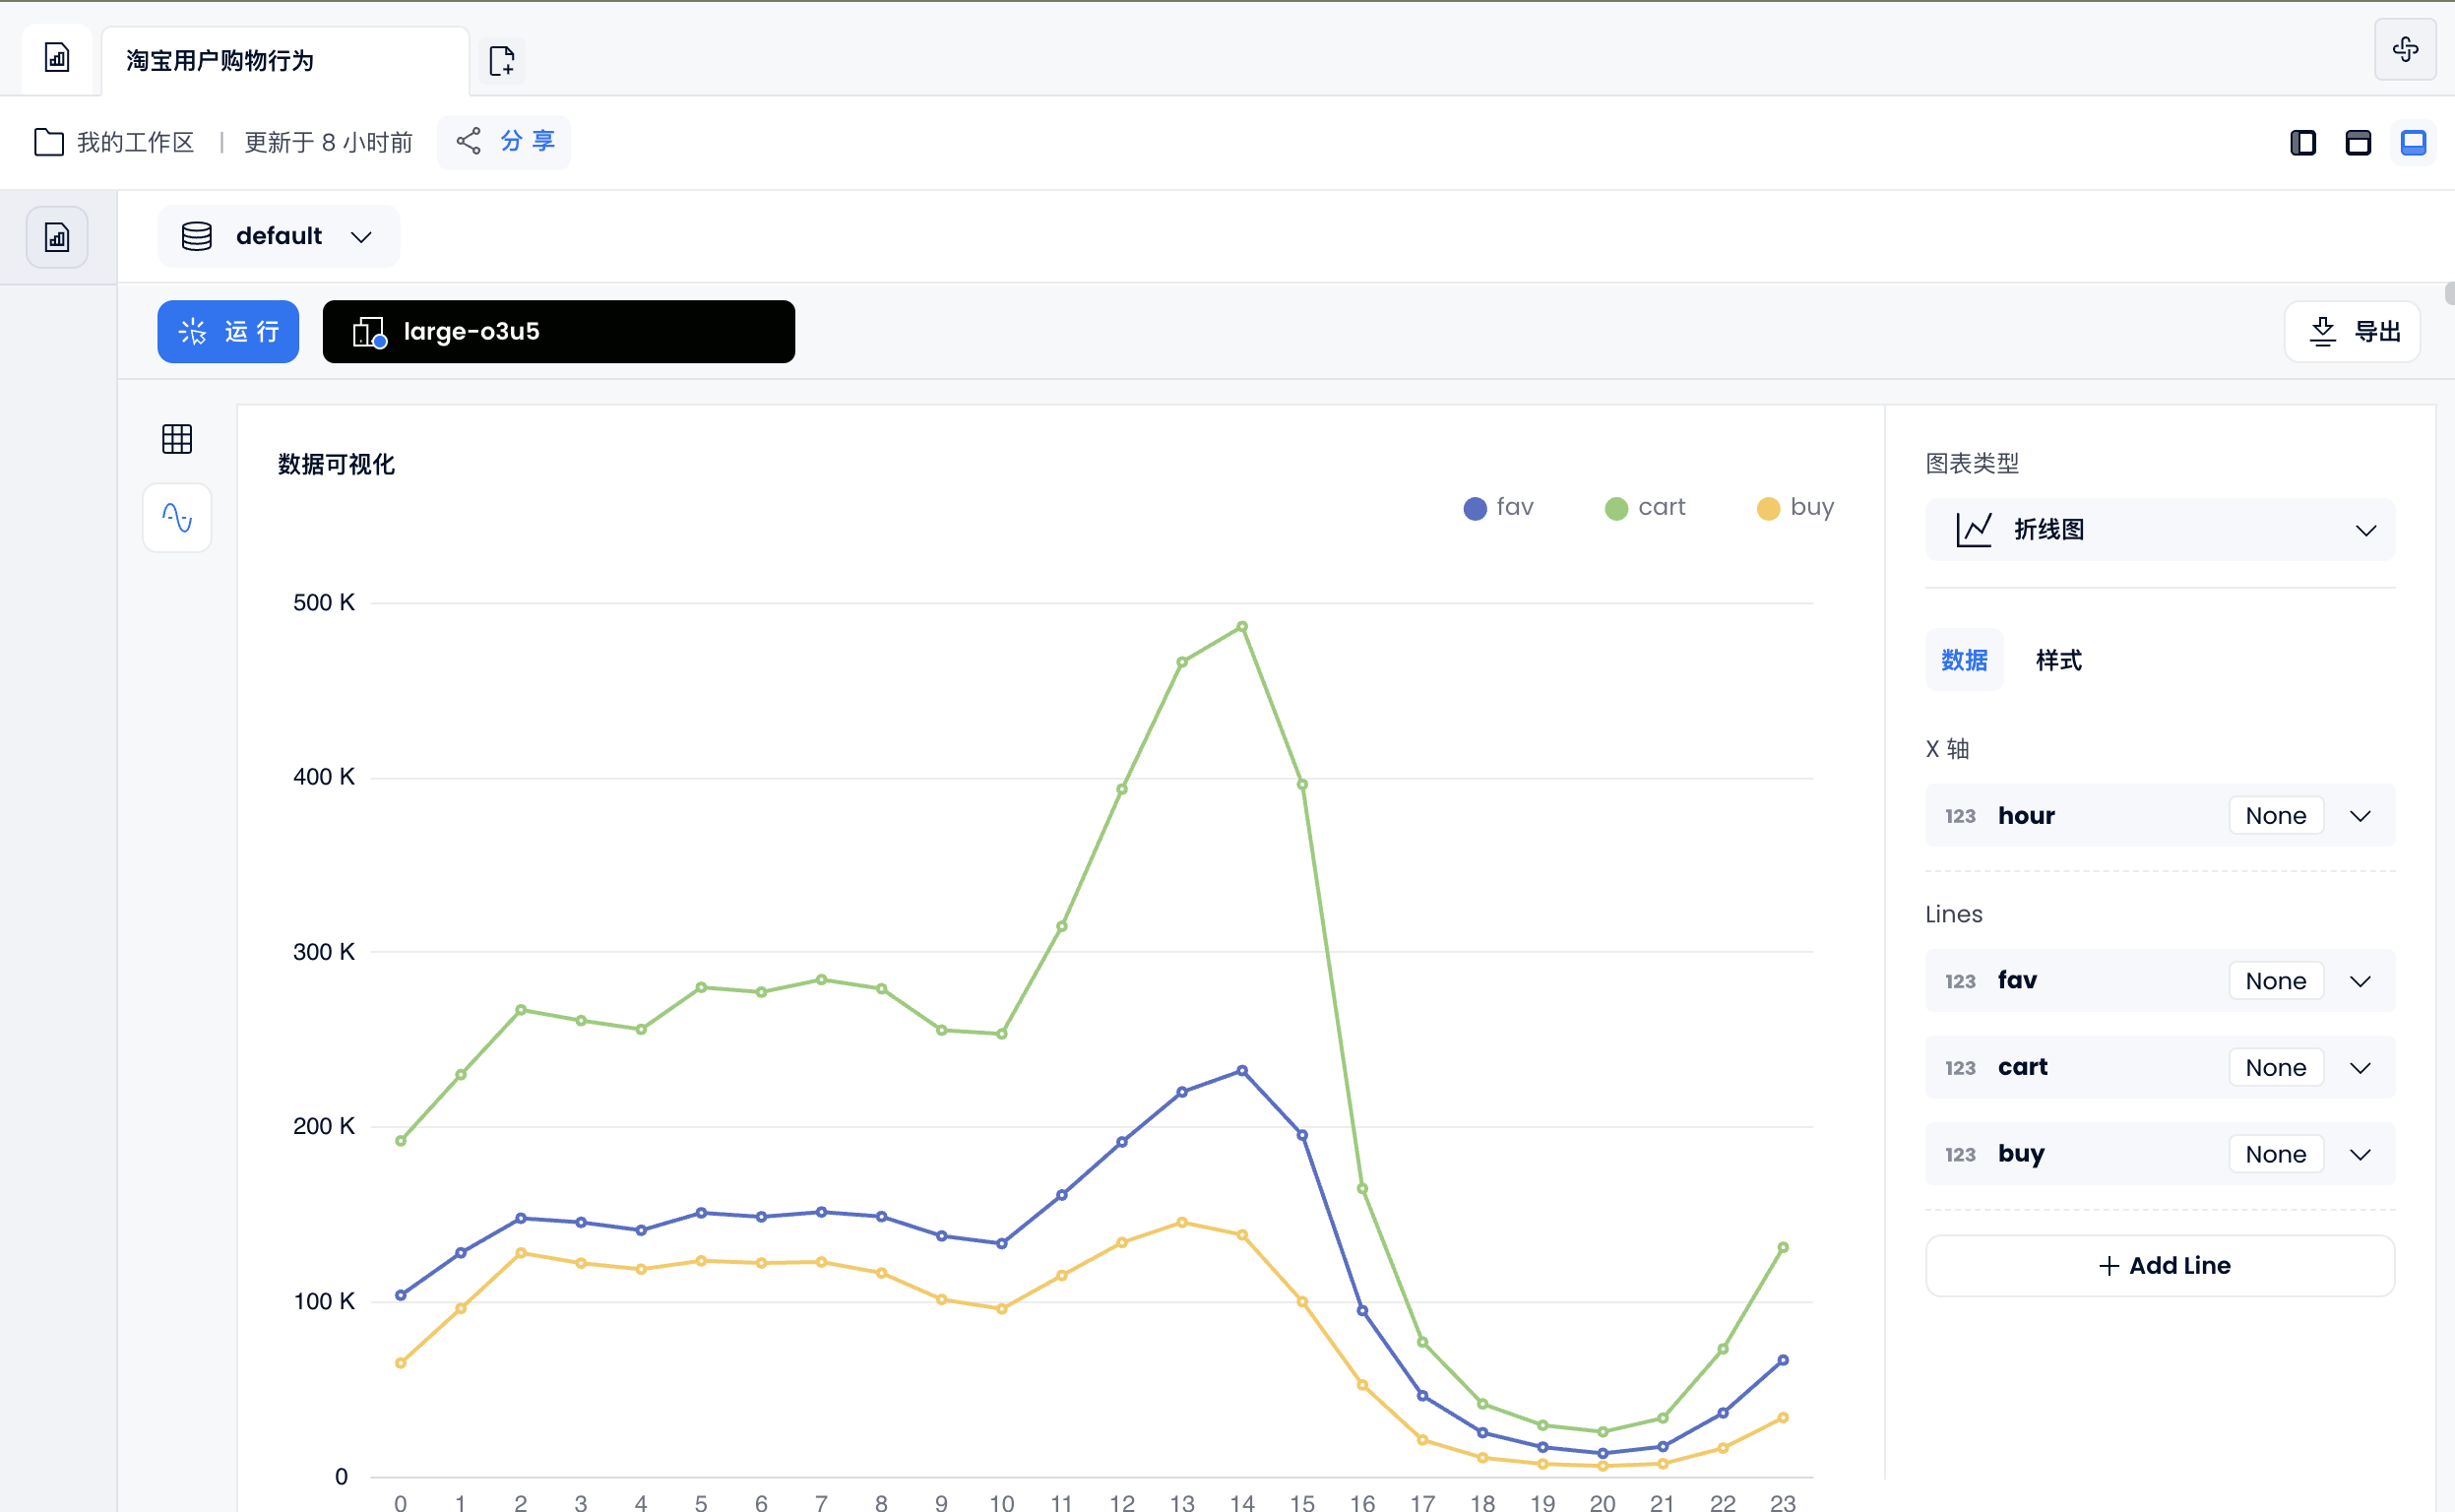
Daily user shopping behavior
select to_hour(ts) as hour,
       sum(case when behavior_type = 'pv' then 1 else 0 end) as pv,   --点击数
       sum(case when behavior_type = 'fav' then 1 else 0 end) as fav,  --收藏数
       sum(case when behavior_type = 'cart' then 1 else 0 end) as cart,  --加购物车数
       sum(case when behavior_type = 'buy' then 1 else 0 end) as buy  --购买数
from user_behavior
group by hour
order by hour;
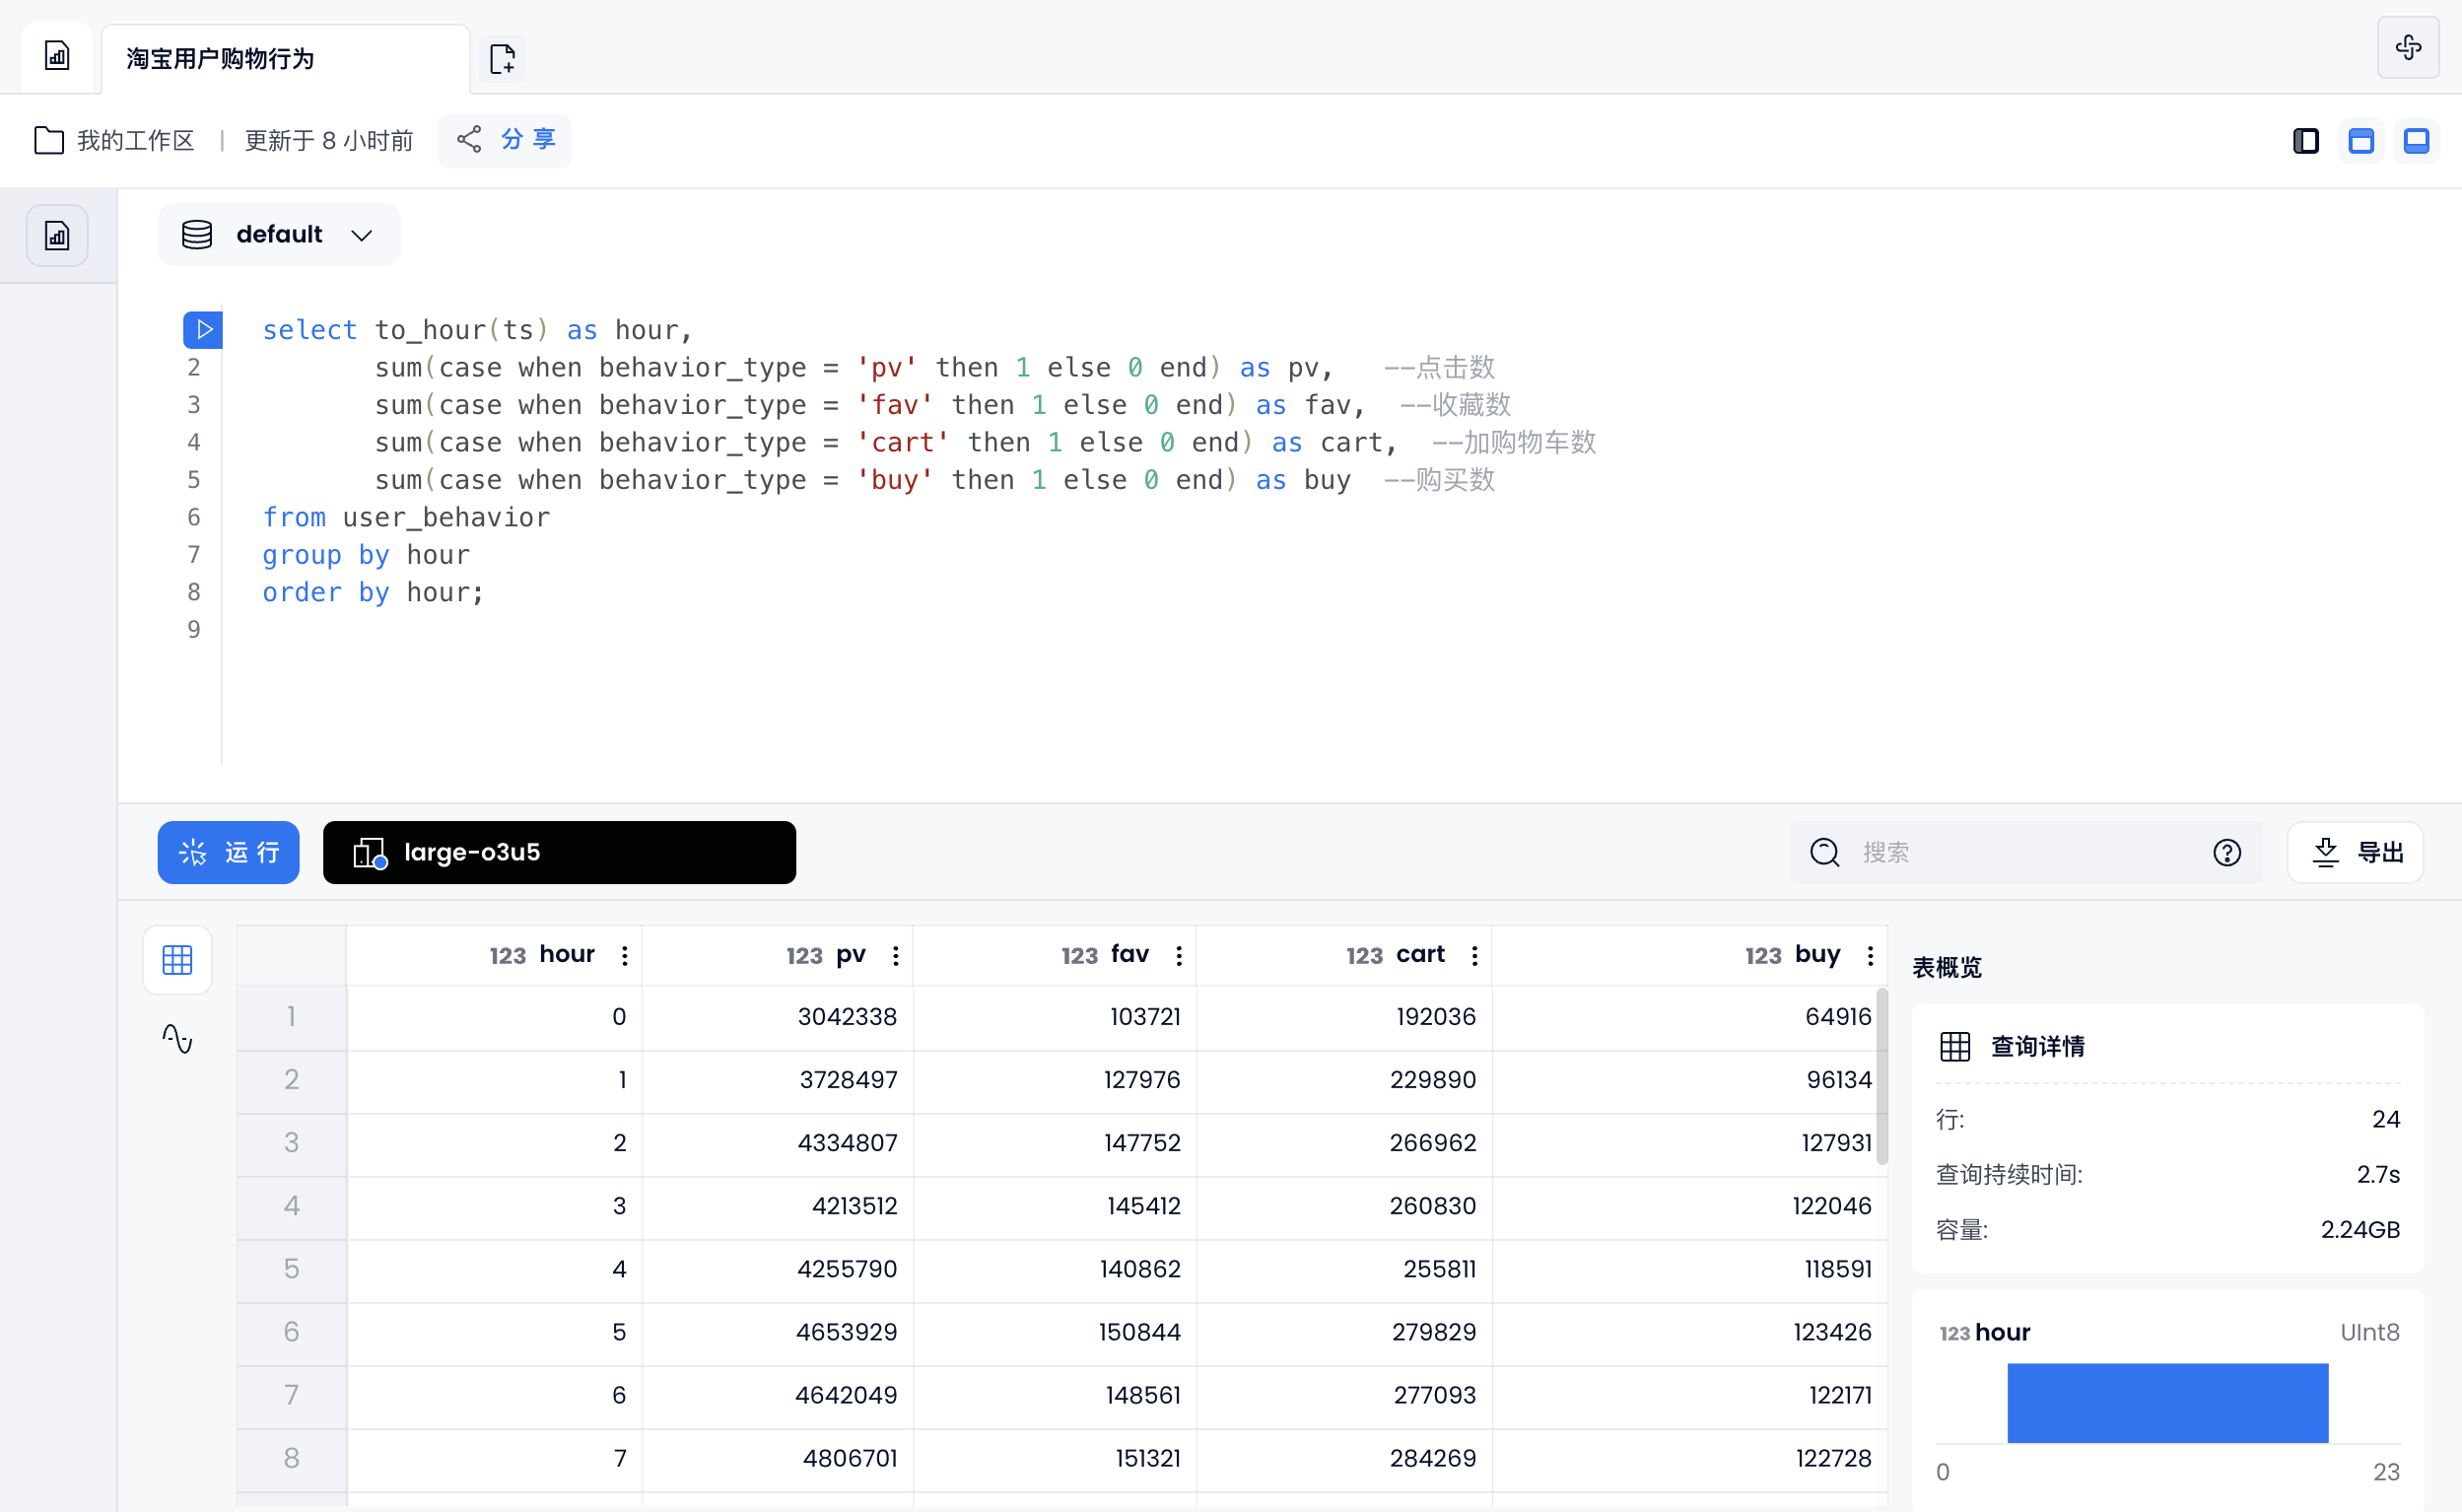
You can also generate a line chart by using the dashboard function:
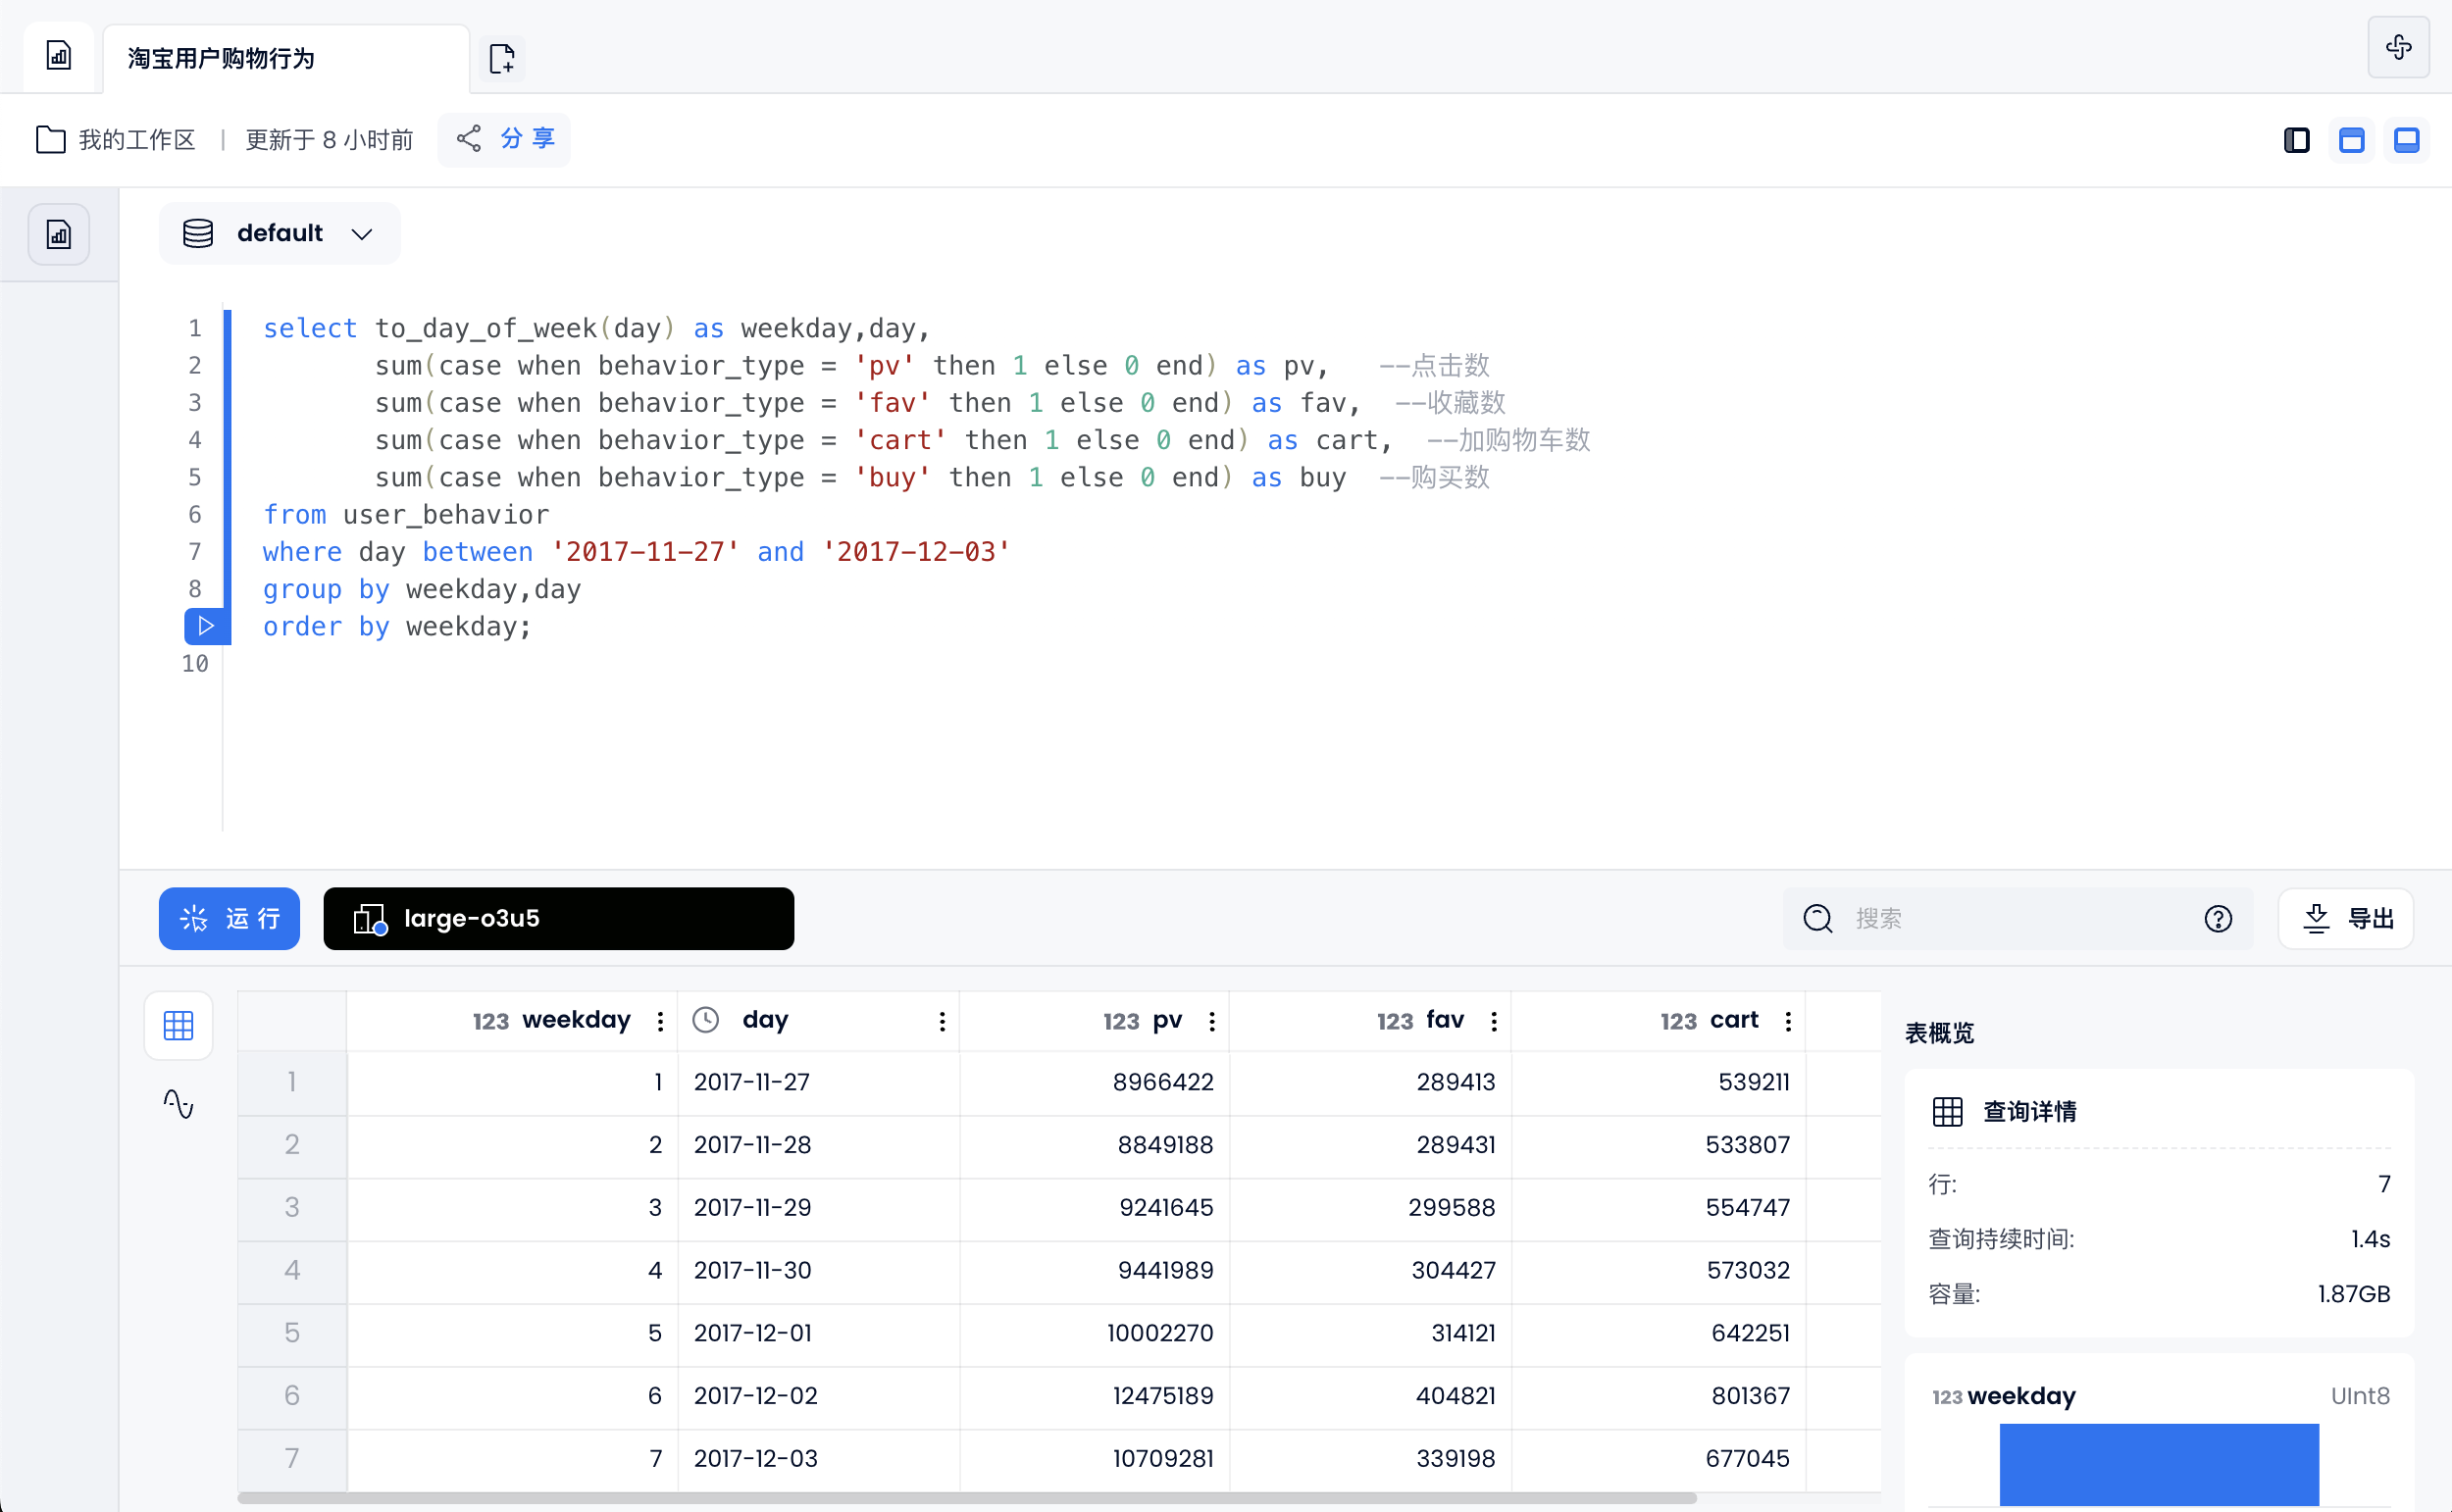
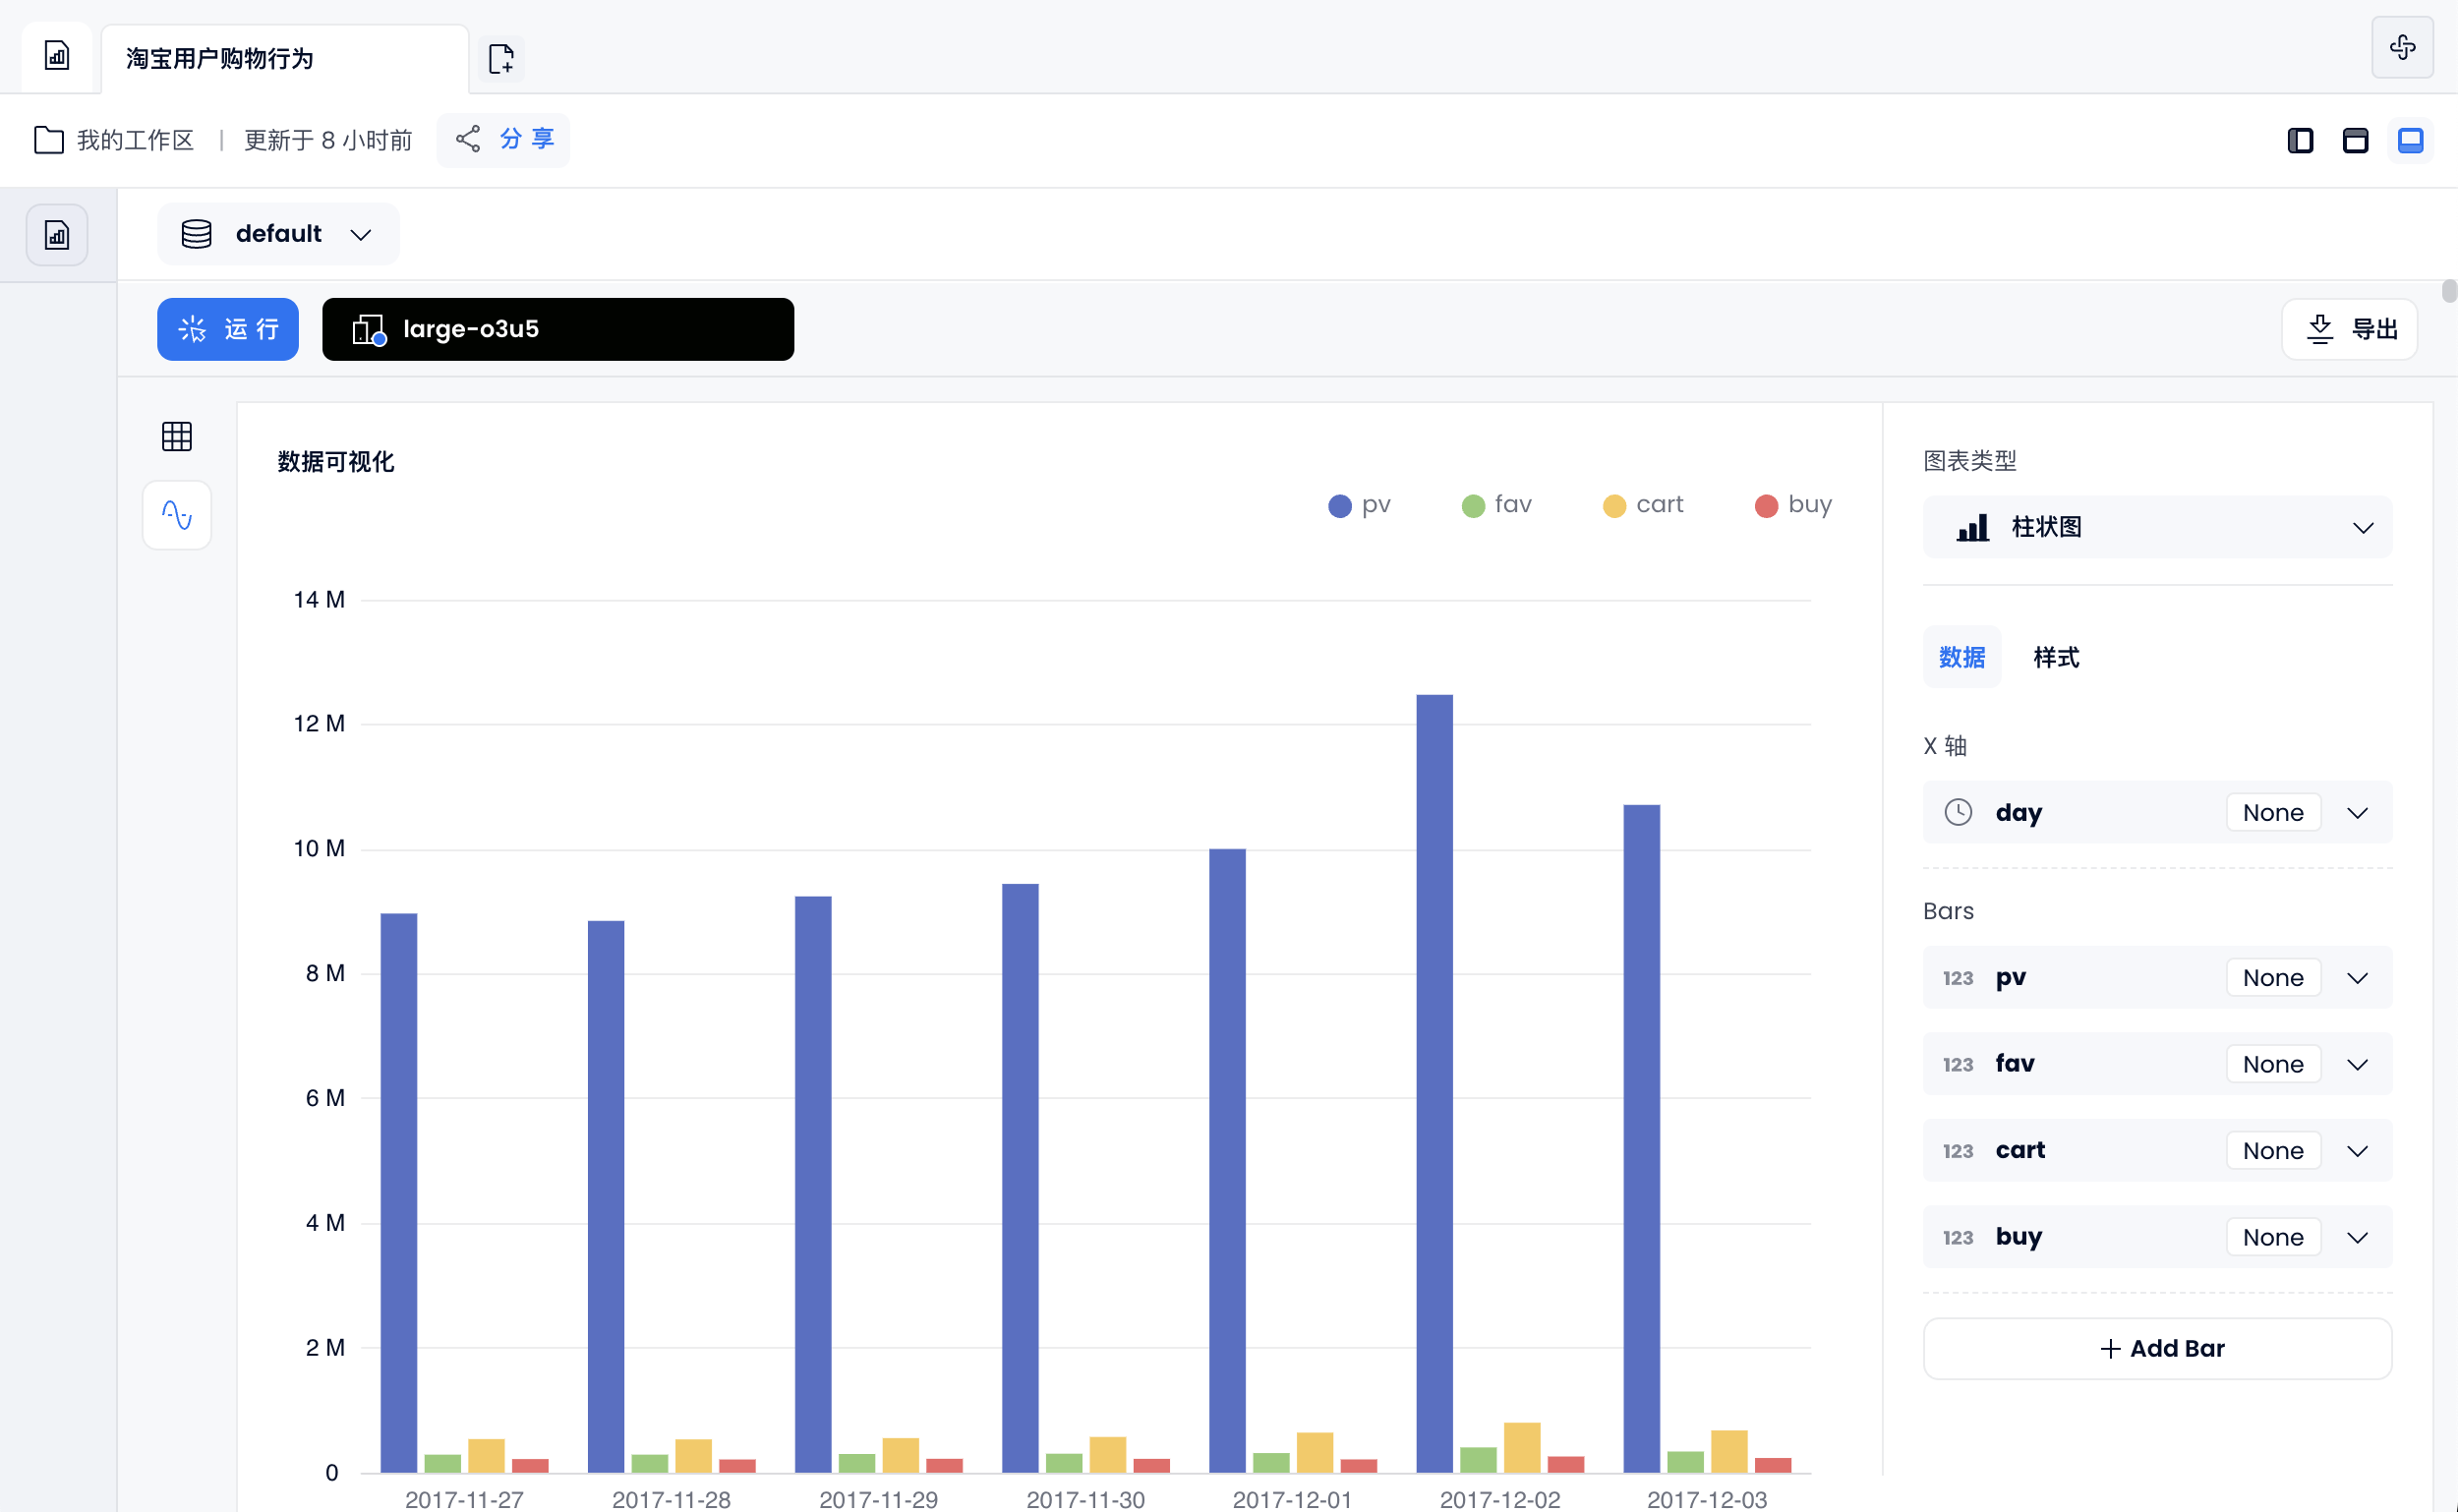
Weekly user shopping behavior
select to_day_of_week(day) as weekday,day,
       sum(case when behavior_type = 'pv' then 1 else 0 end) as pv,   --点击数
       sum(case when behavior_type = 'fav' then 1 else 0 end) as fav,  --收藏数
       sum(case when behavior_type = 'cart' then 1 else 0 end) as cart,  --加购物车数
       sum(case when behavior_type = 'buy' then 1 else 0 end) as buy  --购买数
from user_behavior
where day between '2017-11-27' and '2017-12-03'
group by weekday,day
order by weekday;
You can also generate a histogram by using the dashboard function:
Find valuable users based on RFM model
The RFM model is an important tool and means to measure customer value and customer profit-making ability. Three elements constitute the best indicators for data analysis:
- R-Recency (last purchase time)
- F-Frequency (consumption frequency)
- M-Money (consumption amount)
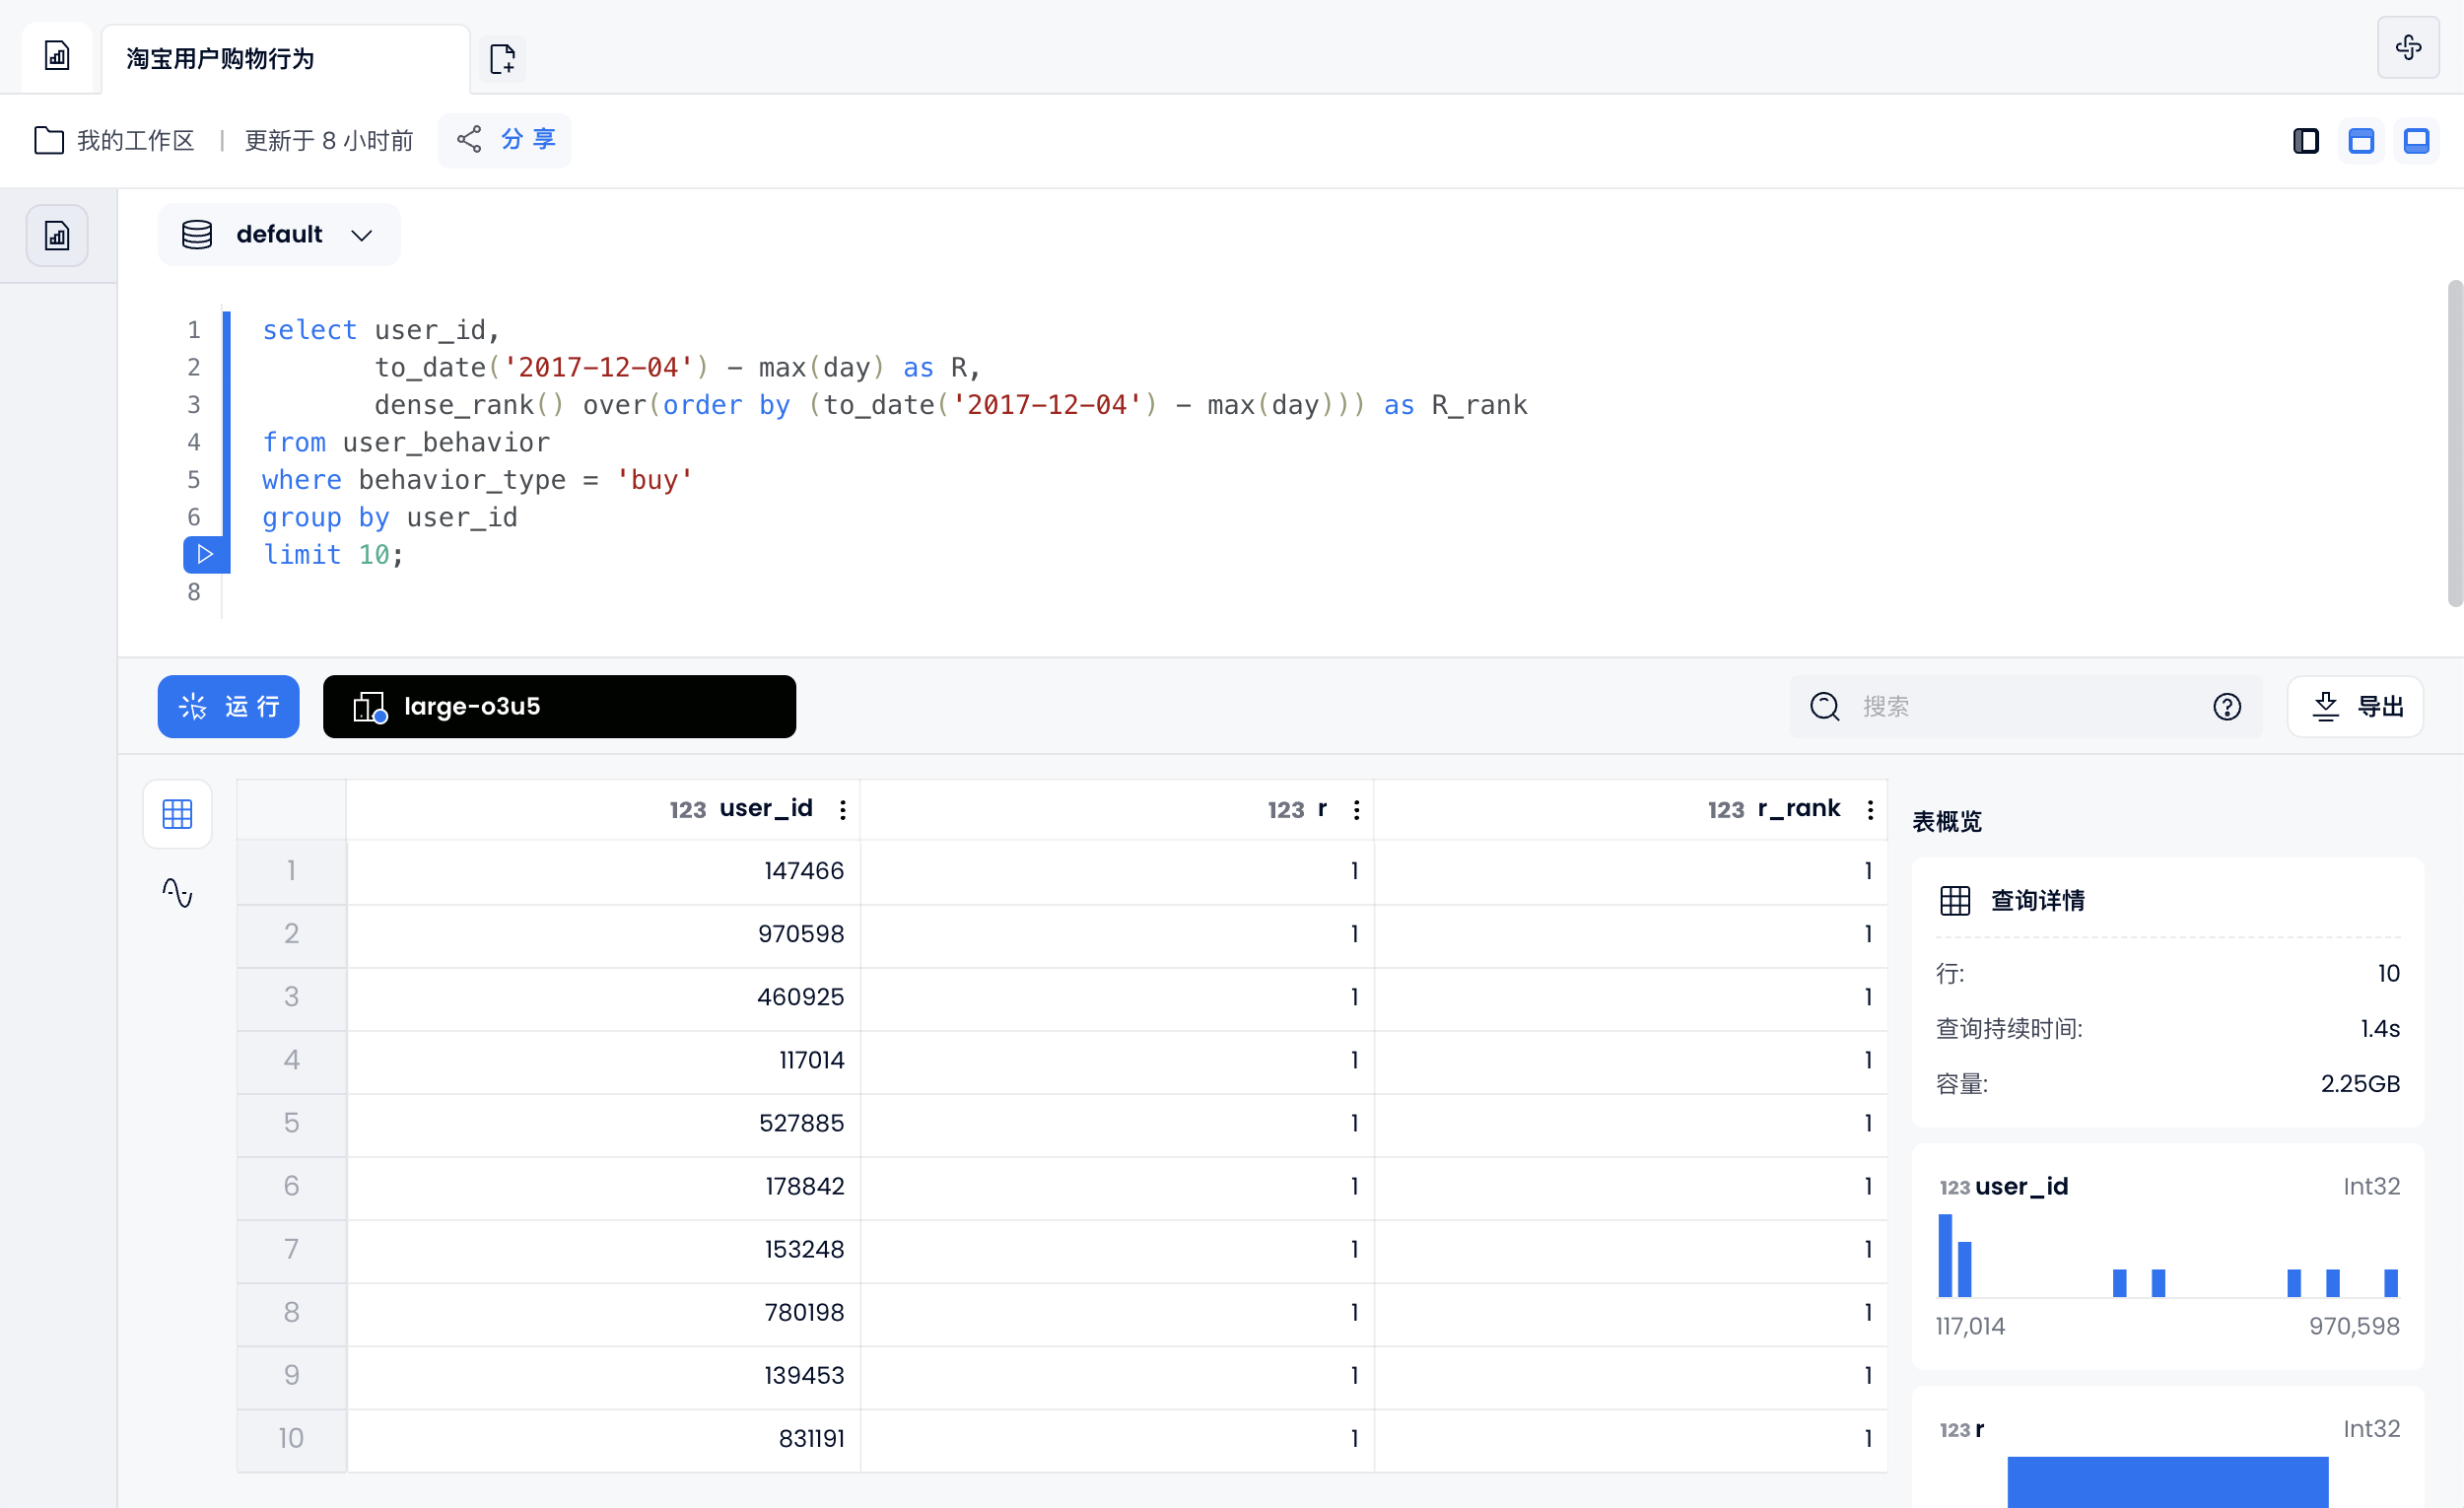
R-Recency (recent purchase time): The higher the R value, the more active the user is
select user_id,
       to_date('2017-12-04') - max(day) as R,
       dense_rank() over(order by (to_date('2017-12-04') - max(day))) as R_rank
from user_behavior
where behavior_type = 'buy'
group by user_id
limit 10;
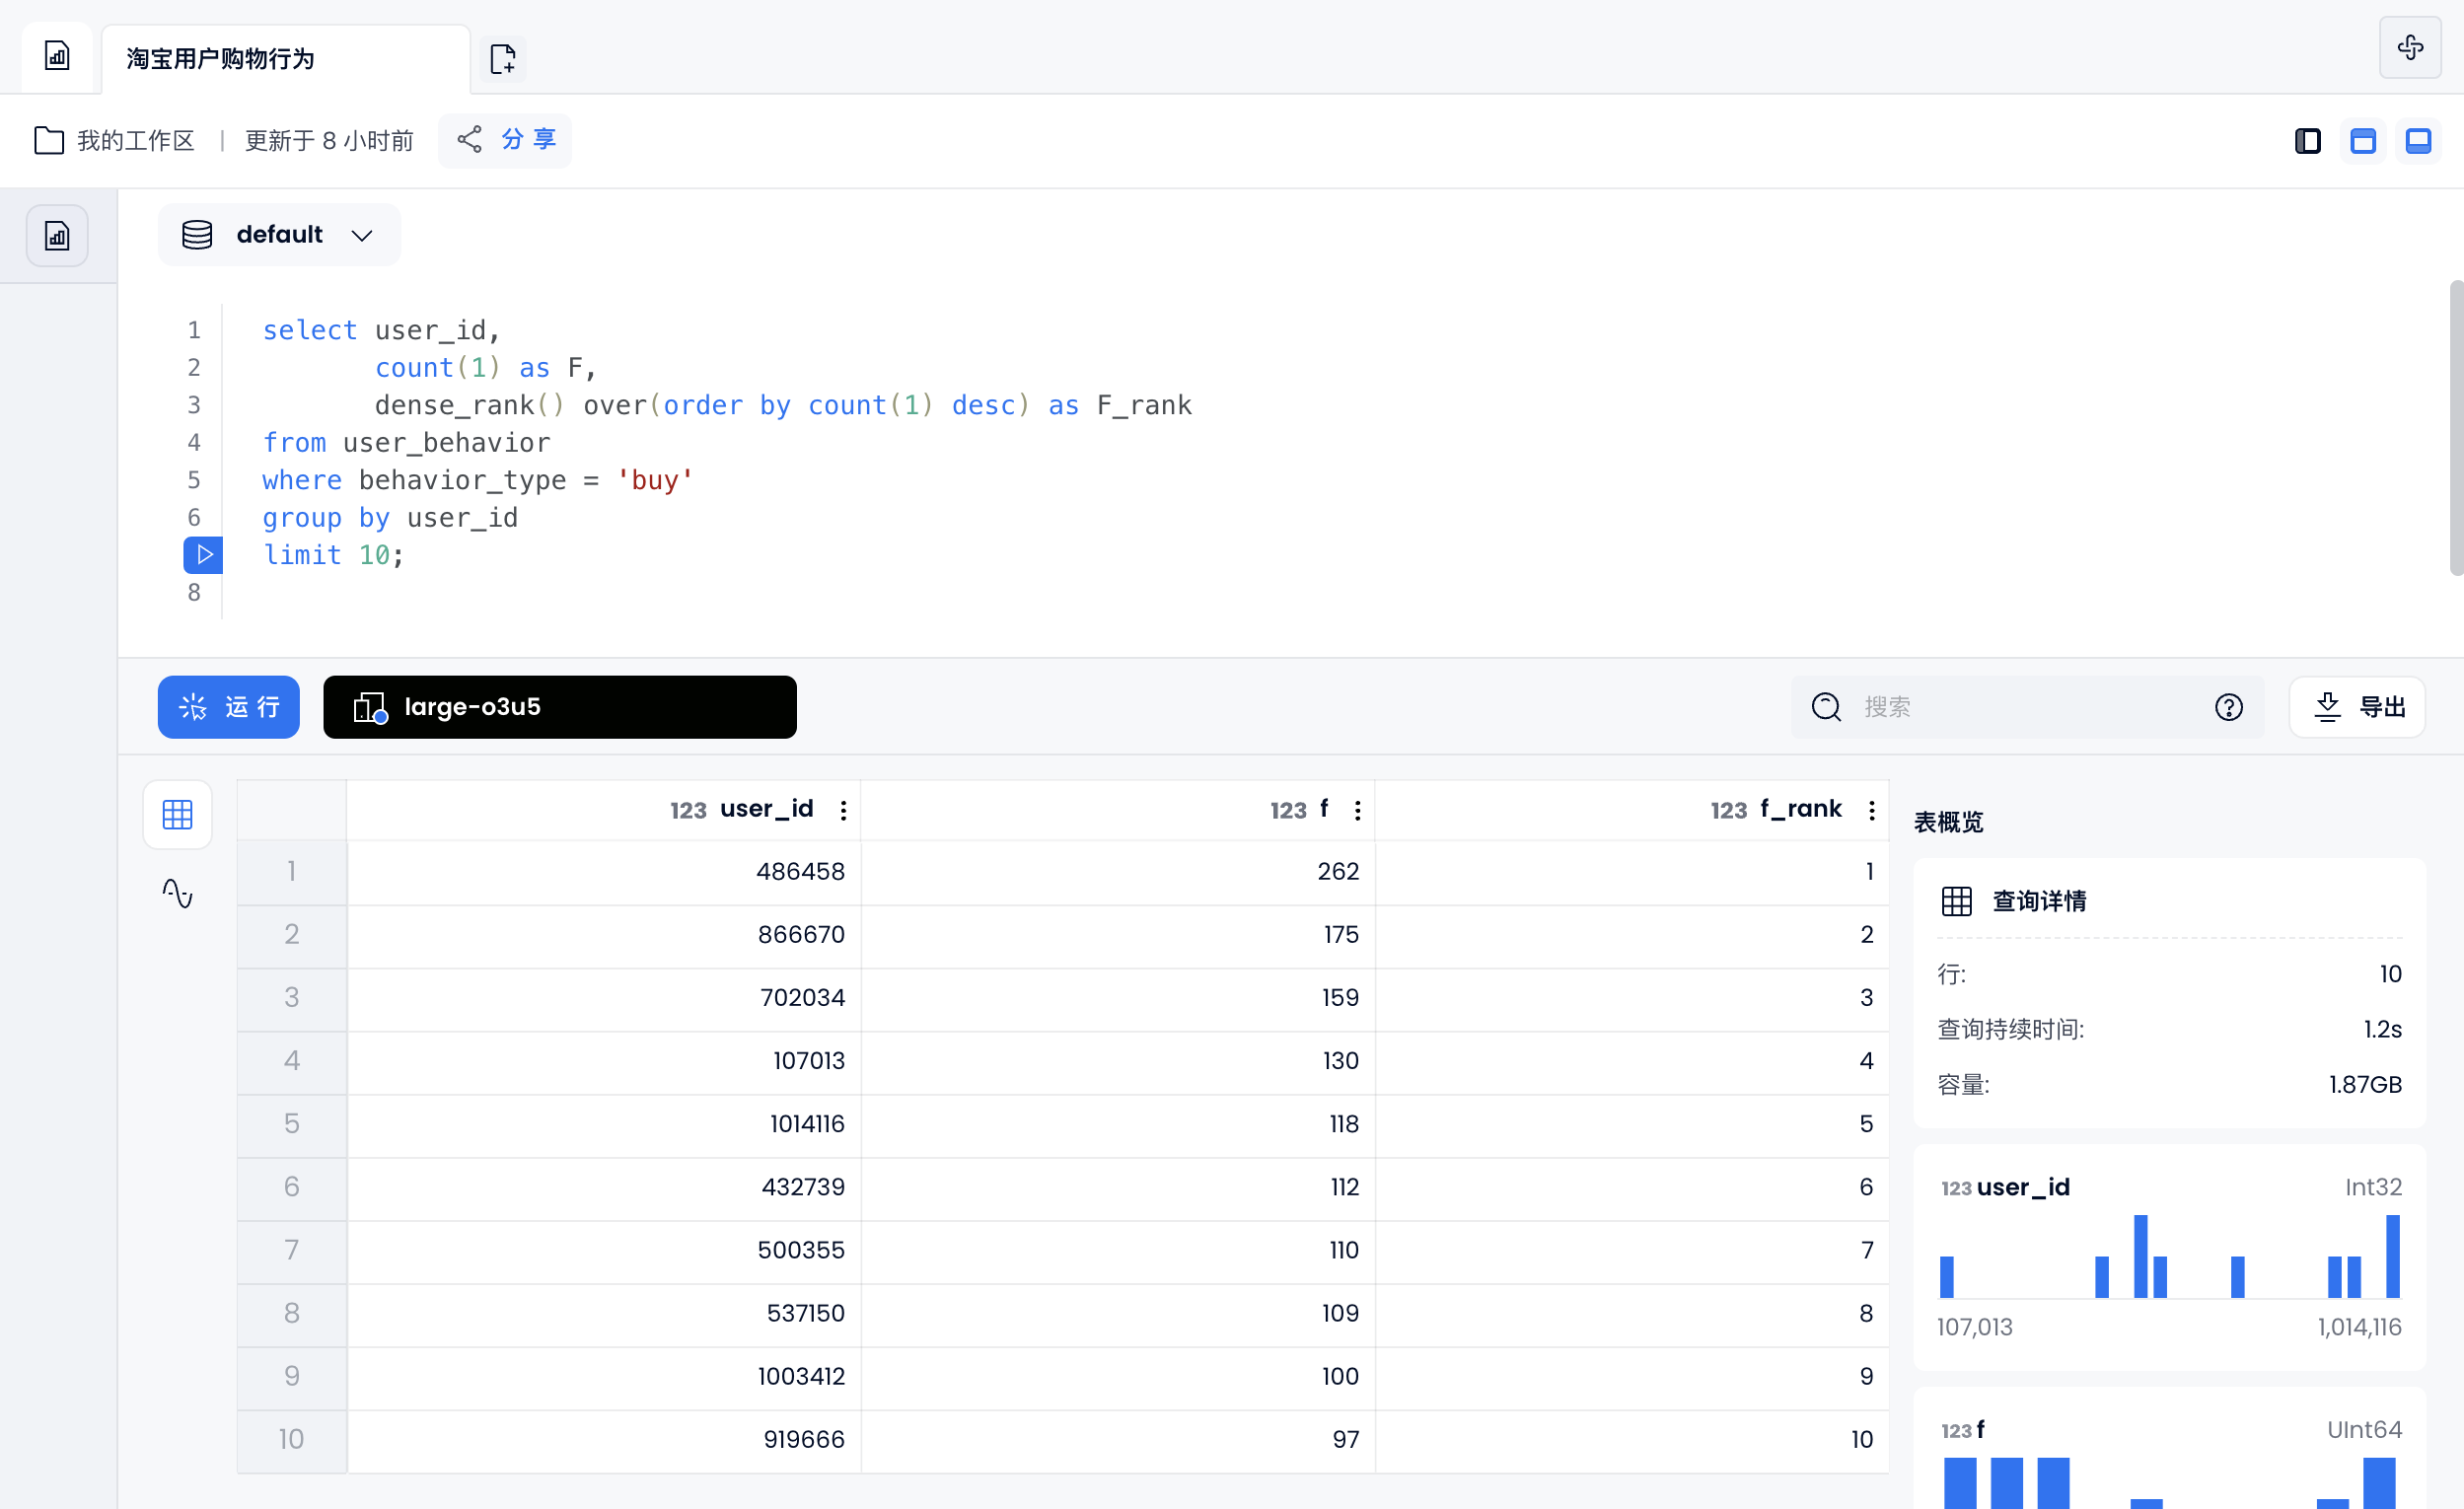
F-Frequency (Consumption Frequency): The higher the F value, the more loyal the user is
select user_id,
       count(1) as F,
       dense_rank() over(order by count(1) desc) as F_rank
from user_behavior
where behavior_type = 'buy'
group by user_id
limit 10;
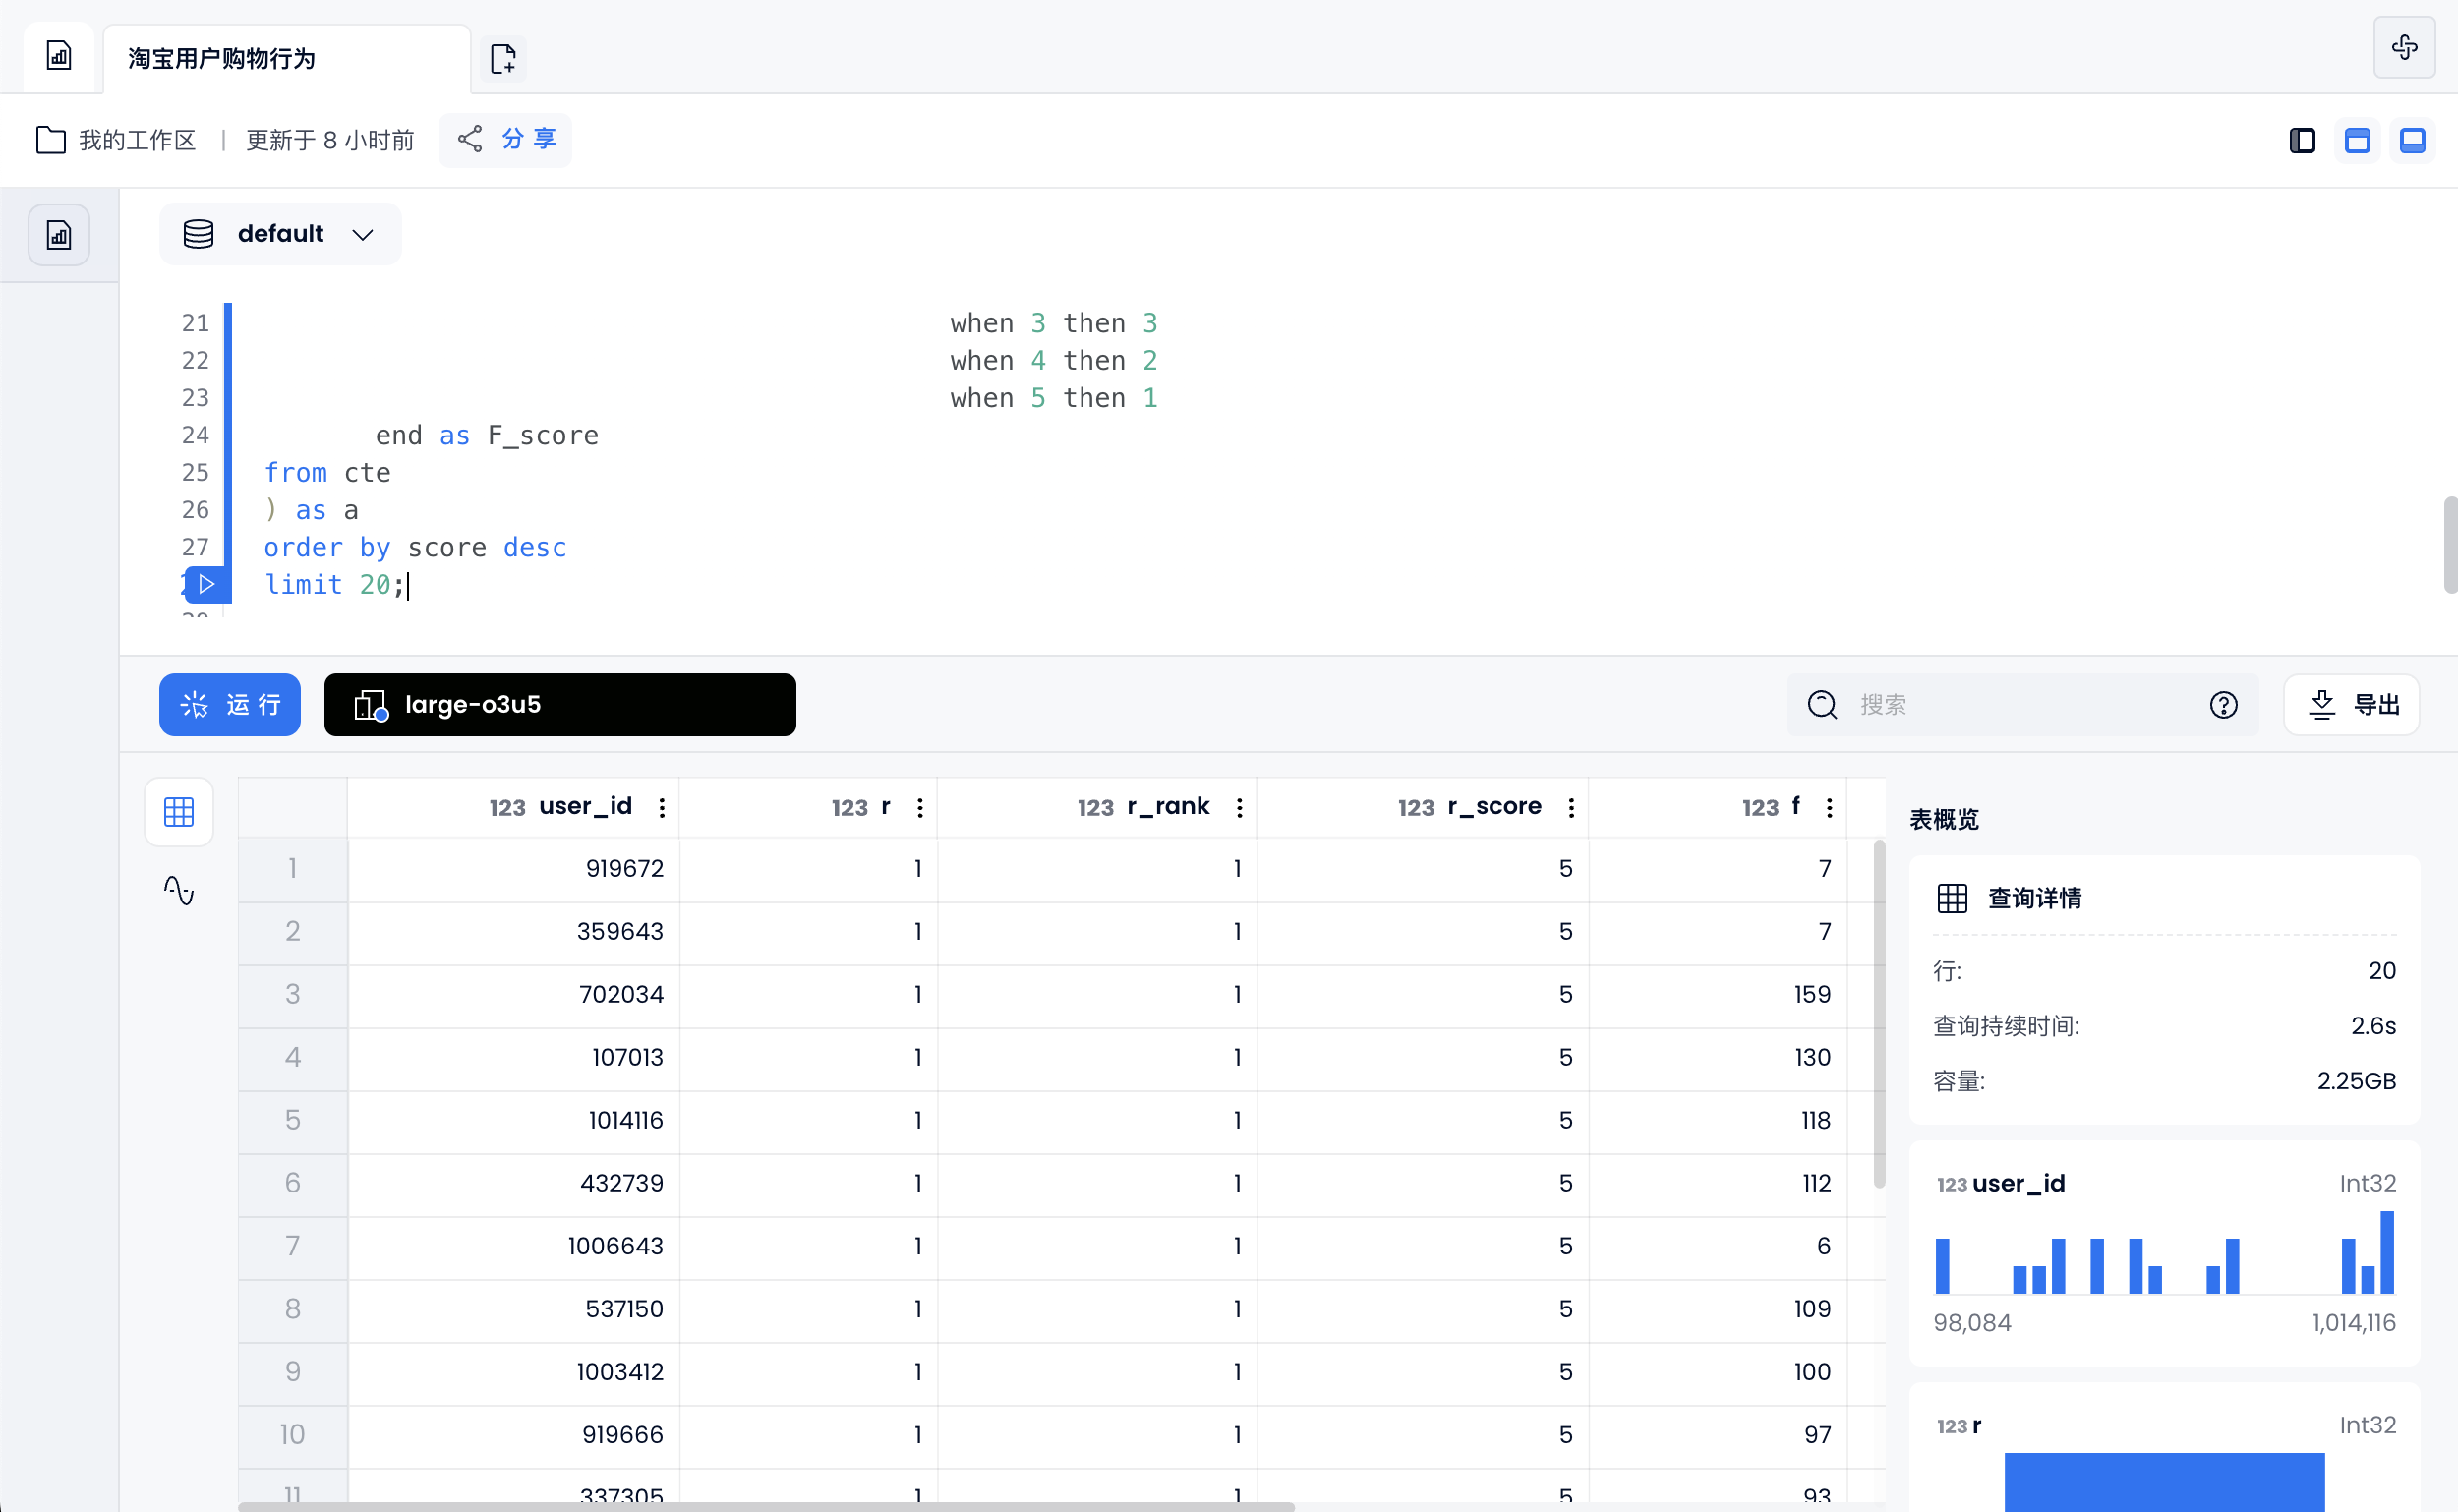
User grouping
Users with purchasing behavior are grouped according to their rankings and divided into 5 groups:
- Top 1/5 users give 5 points
- Top 1/5 - 2/5 users give 4 points
- Top 2/5 - 3/5 users give 3 points
- The first 3/5 - 4/5 users give 2 points
- The rest of the users give it a score of 1
According to this rule, the user's time interval ranking and purchase frequency ranking are scored respectively, and finally the two scores are combined together as the final score of the user.
with cte as(
select user_id,
       to_date('2017-12-04') - max(day) as R,
       dense_rank() over(order by (to_date('2017-12-04') - max(day))) as R_rank,
       count(1) as F,
       dense_rank() over(order by count(1) desc) as F_rank
from user_behavior
where behavior_type = 'buy'
group by user_id)
select user_id, R, R_rank, R_score, F, F_rank, F_score,  R_score + F_score AS score
from(
select *,
       case ntile(5) over(order by R_rank) when 1 then 5
                                           when 2 then 4
                                           when 3 then 3
                                           when 4 then 2
                                           when 5 then 1
       end as R_score,
       case ntile(5) over(order by F_rank) when 1 then 5
                                           when 2 then 4
                                           when 3 then 3
                                           when 4 then 2
                                           when 5 then 1
       end as F_score
from cte
) as a
order by score desc
limit 20;
Product dimension analysis
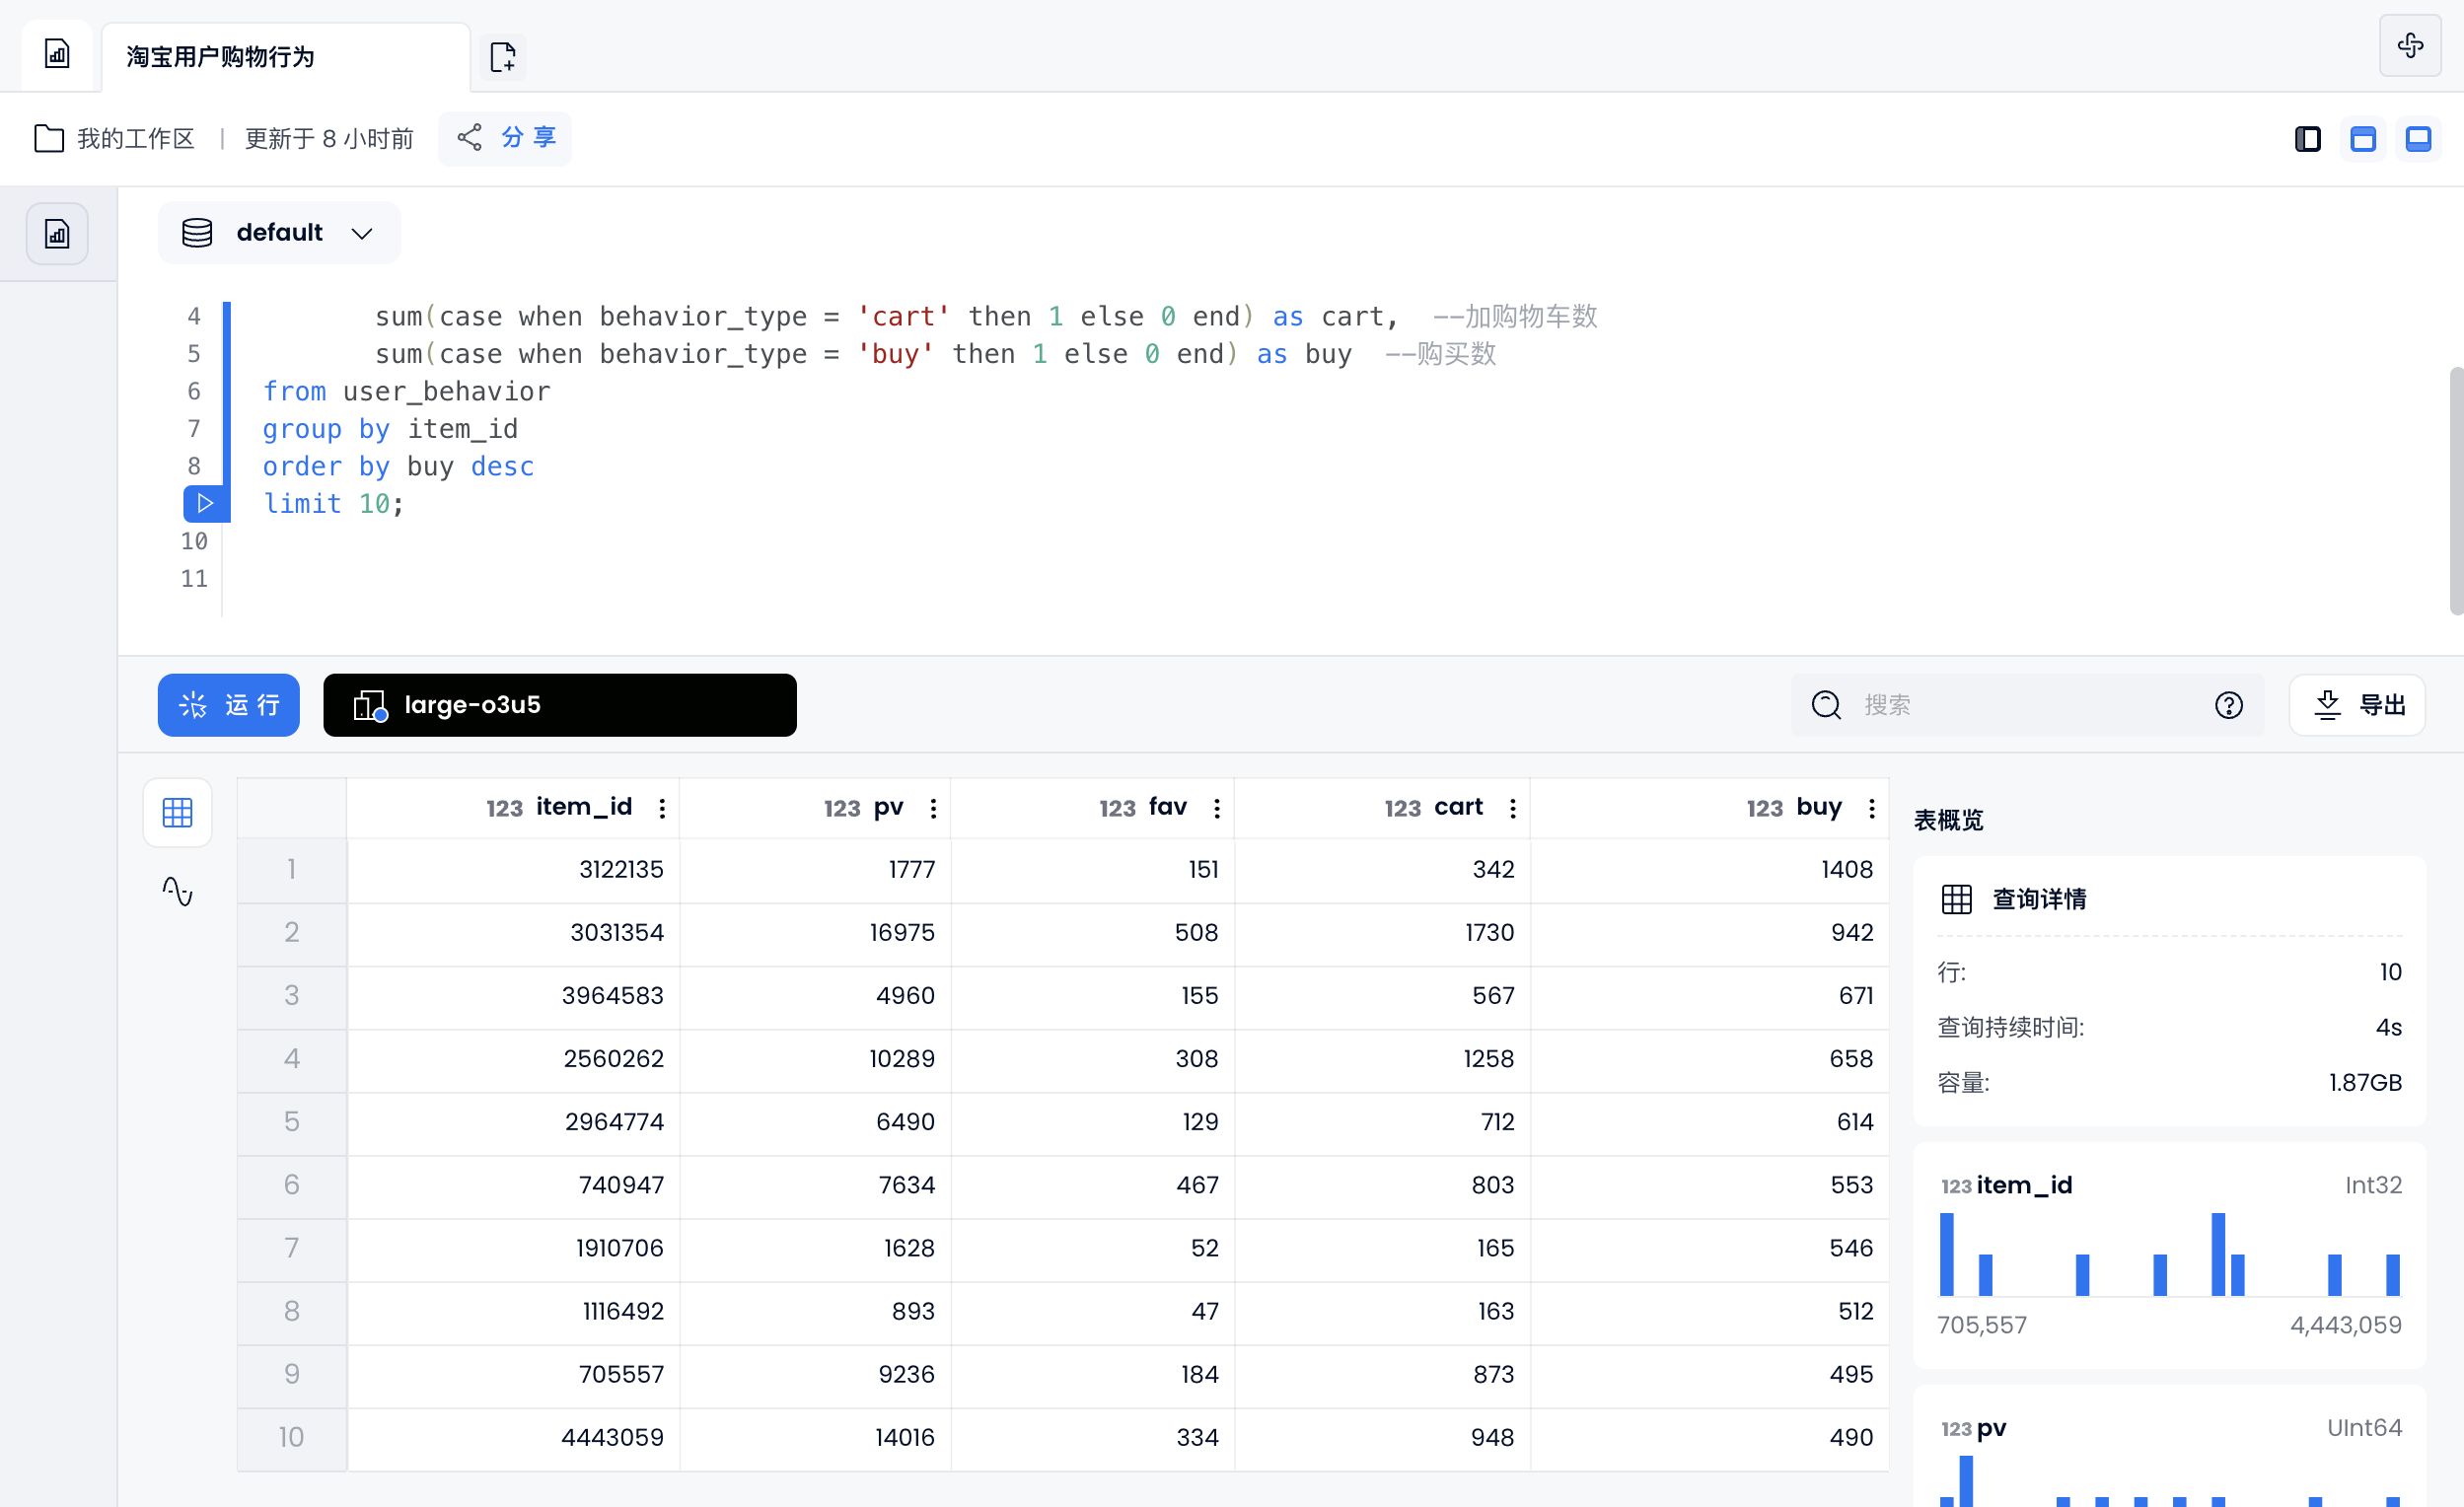
Top selling items
select item_id ,
       sum(case when behavior_type = 'pv' then 1 else 0 end) as pv,   --点击数
       sum(case when behavior_type = 'fav' then 1 else 0 end) as fav,  --收藏数
       sum(case when behavior_type = 'cart' then 1 else 0 end) as cart,  --加购物车数
       sum(case when behavior_type = 'buy' then 1 else 0 end) as buy  --购买数
from user_behavior
group by item_id
order by buy desc
limit 10;
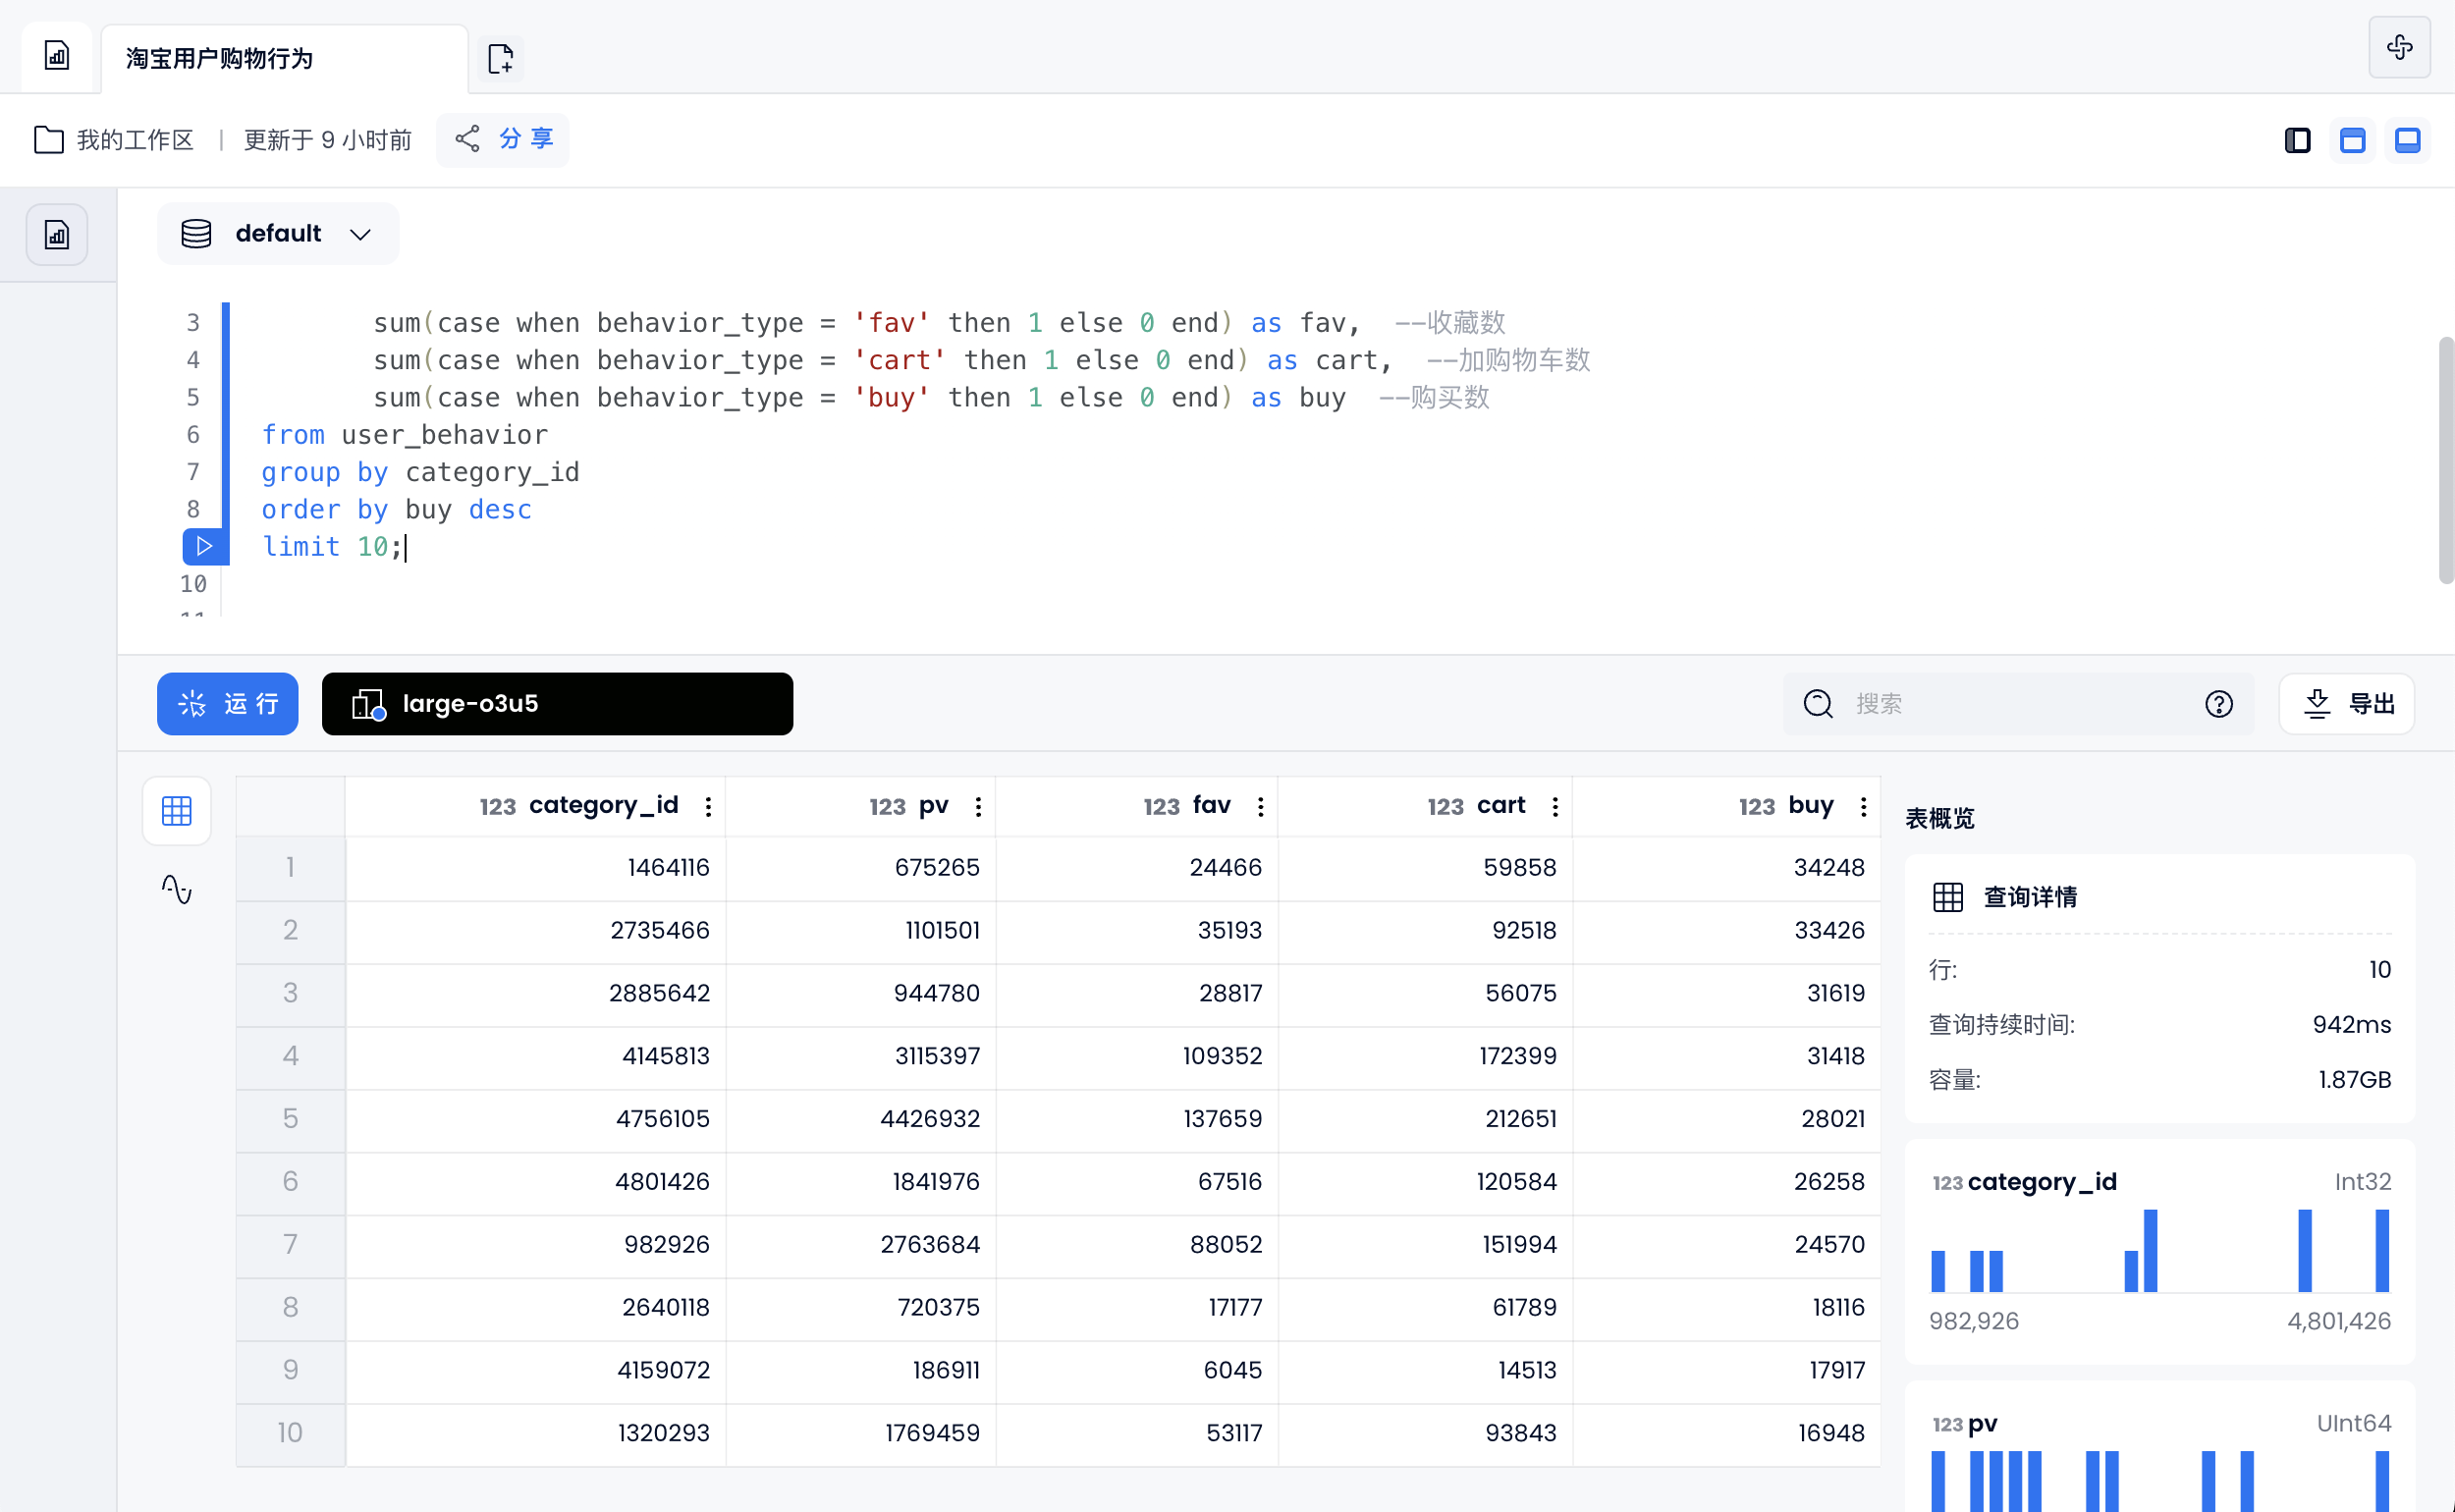
Top selling product categories
select category_id ,
       sum(case when behavior_type = 'pv' then 1 else 0 end) as pv,   --点击数
       sum(case when behavior_type = 'fav' then 1 else 0 end) as fav,  --收藏数
       sum(case when behavior_type = 'cart' then 1 else 0 end) as cart,  --加购物车数
       sum(case when behavior_type = 'buy' then 1 else 0 end) as buy  --购买数
from user_behavior
group by category_id
order by buy desc
limit 10;
User retention analysis
Before starting, create the table "day_users" and insert data:
create table day_users(
day date,
users bitmap);

insert into day_users select day, build_bitmap(list(user_id::UInt64)) from user_behavior group by day;
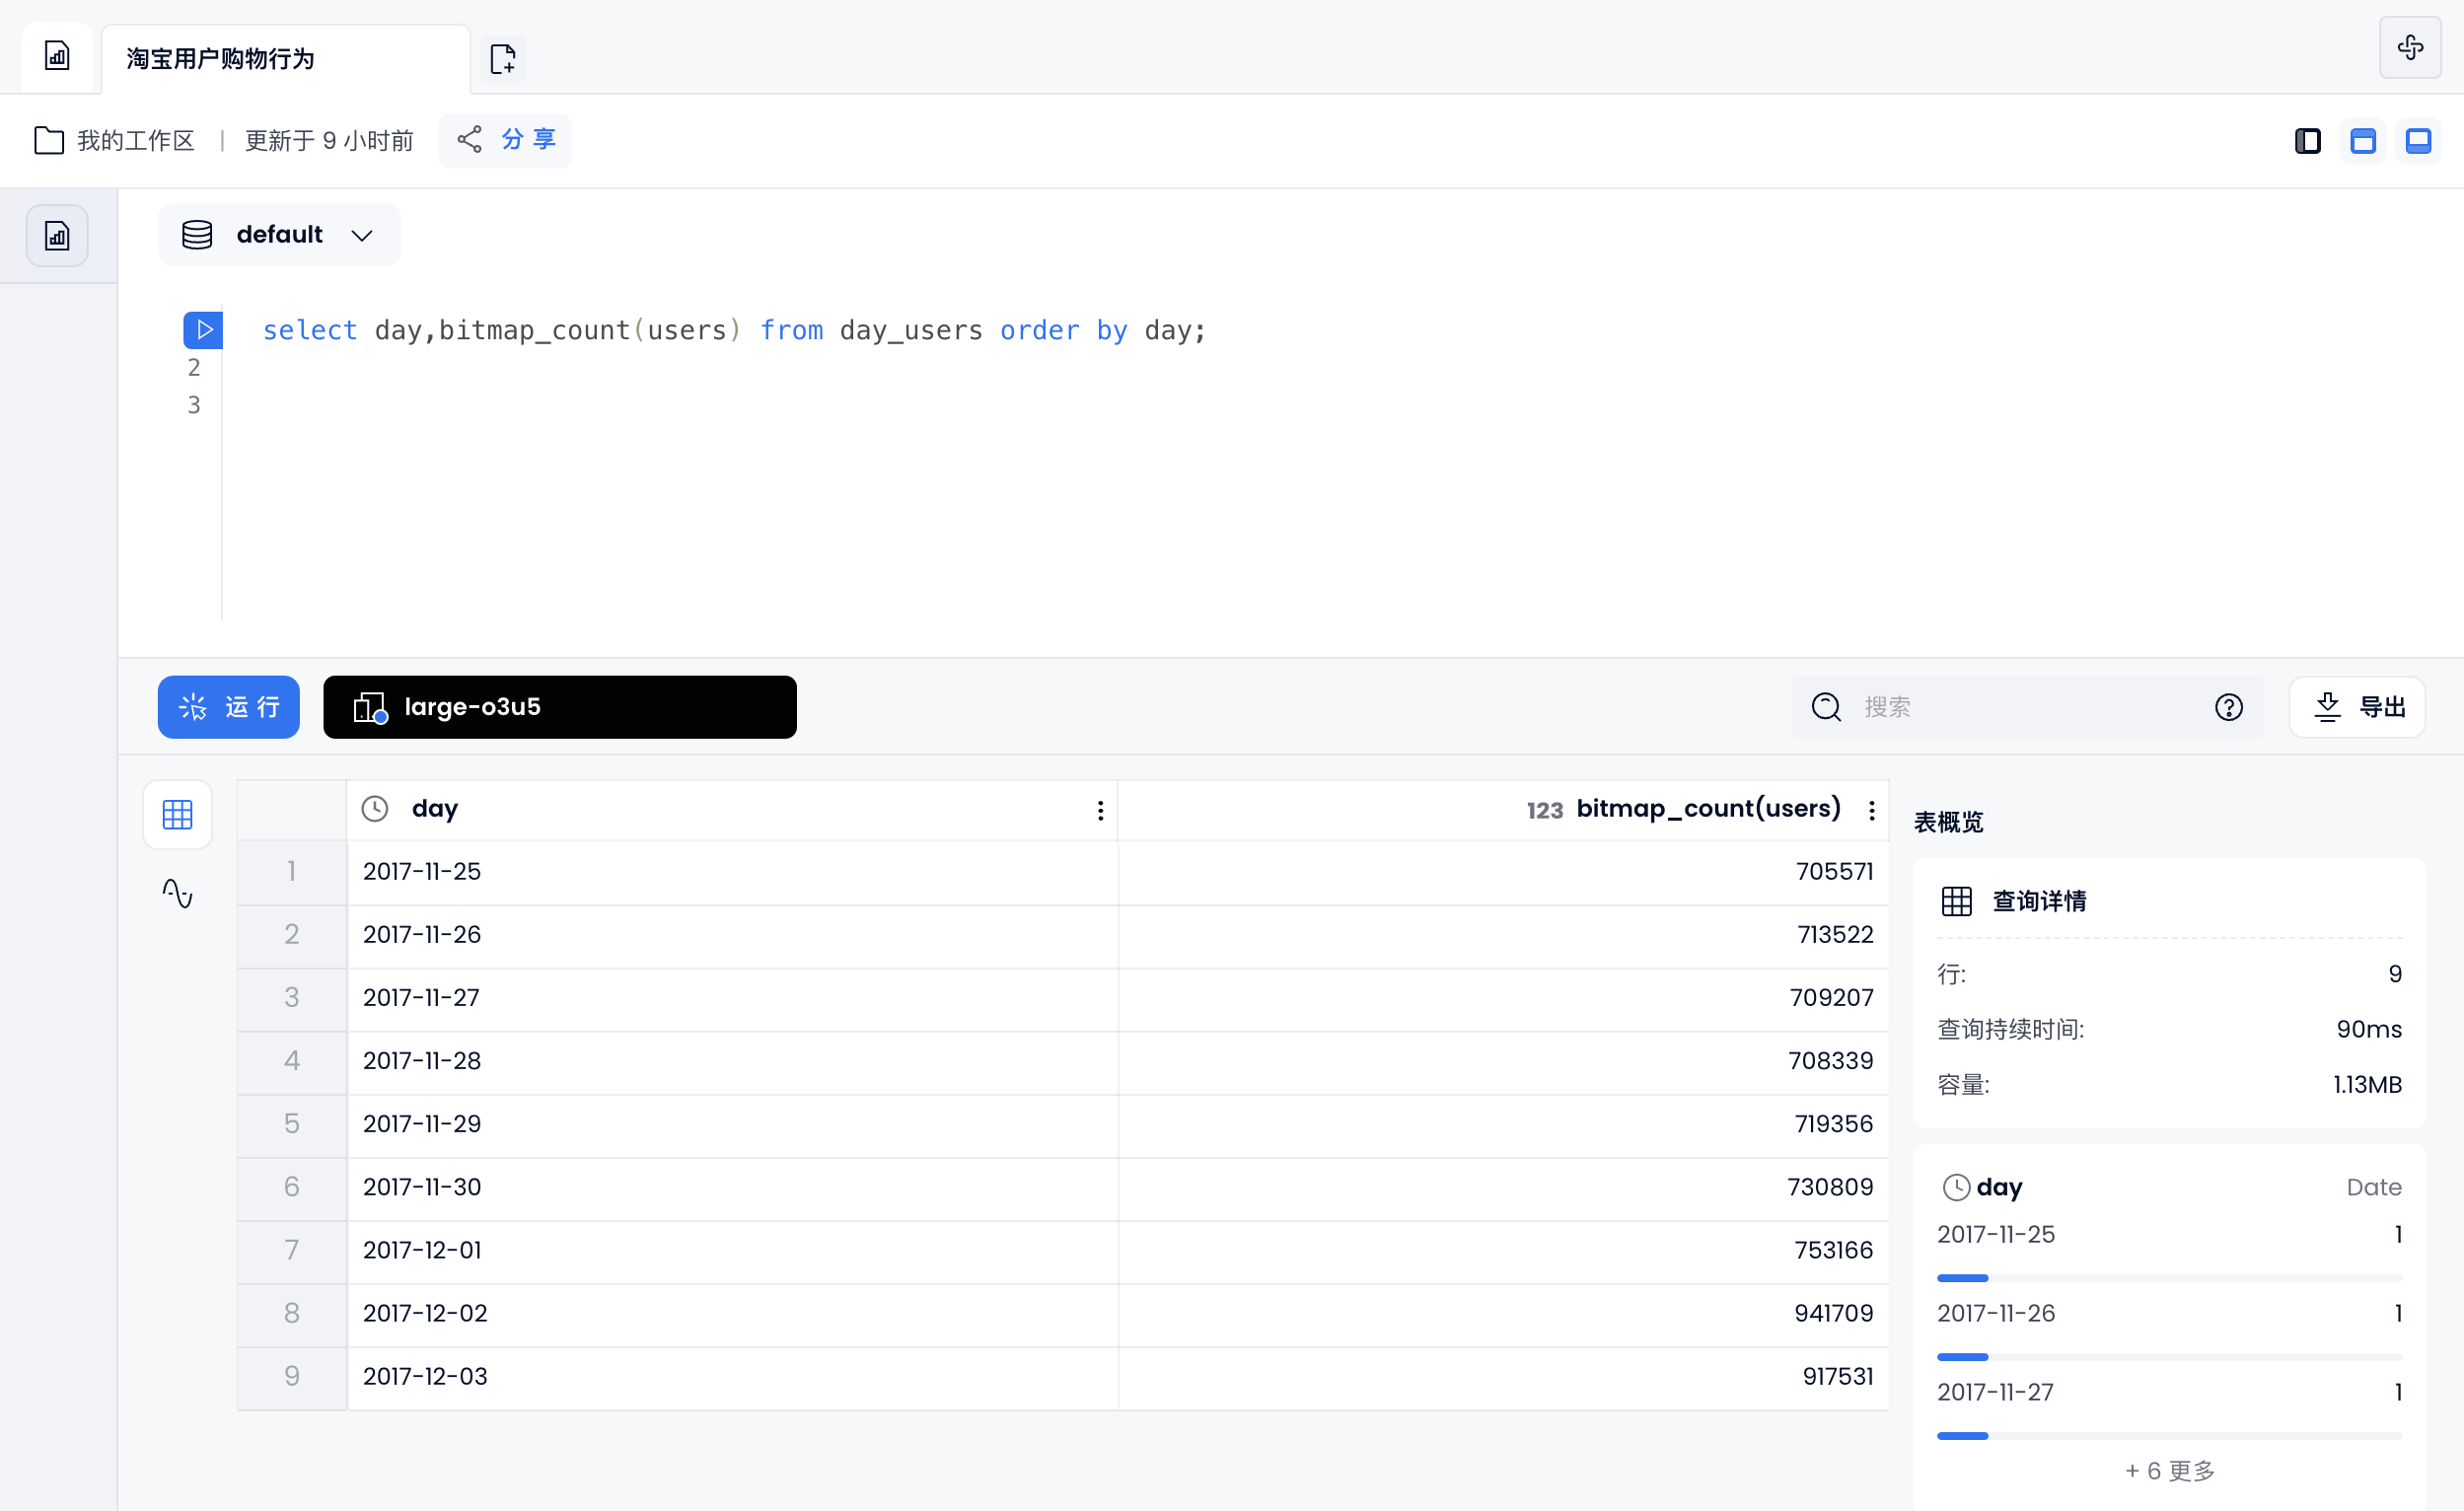
Statistics of daily UV
select day,bitmap_count(users) from day_users order by day;
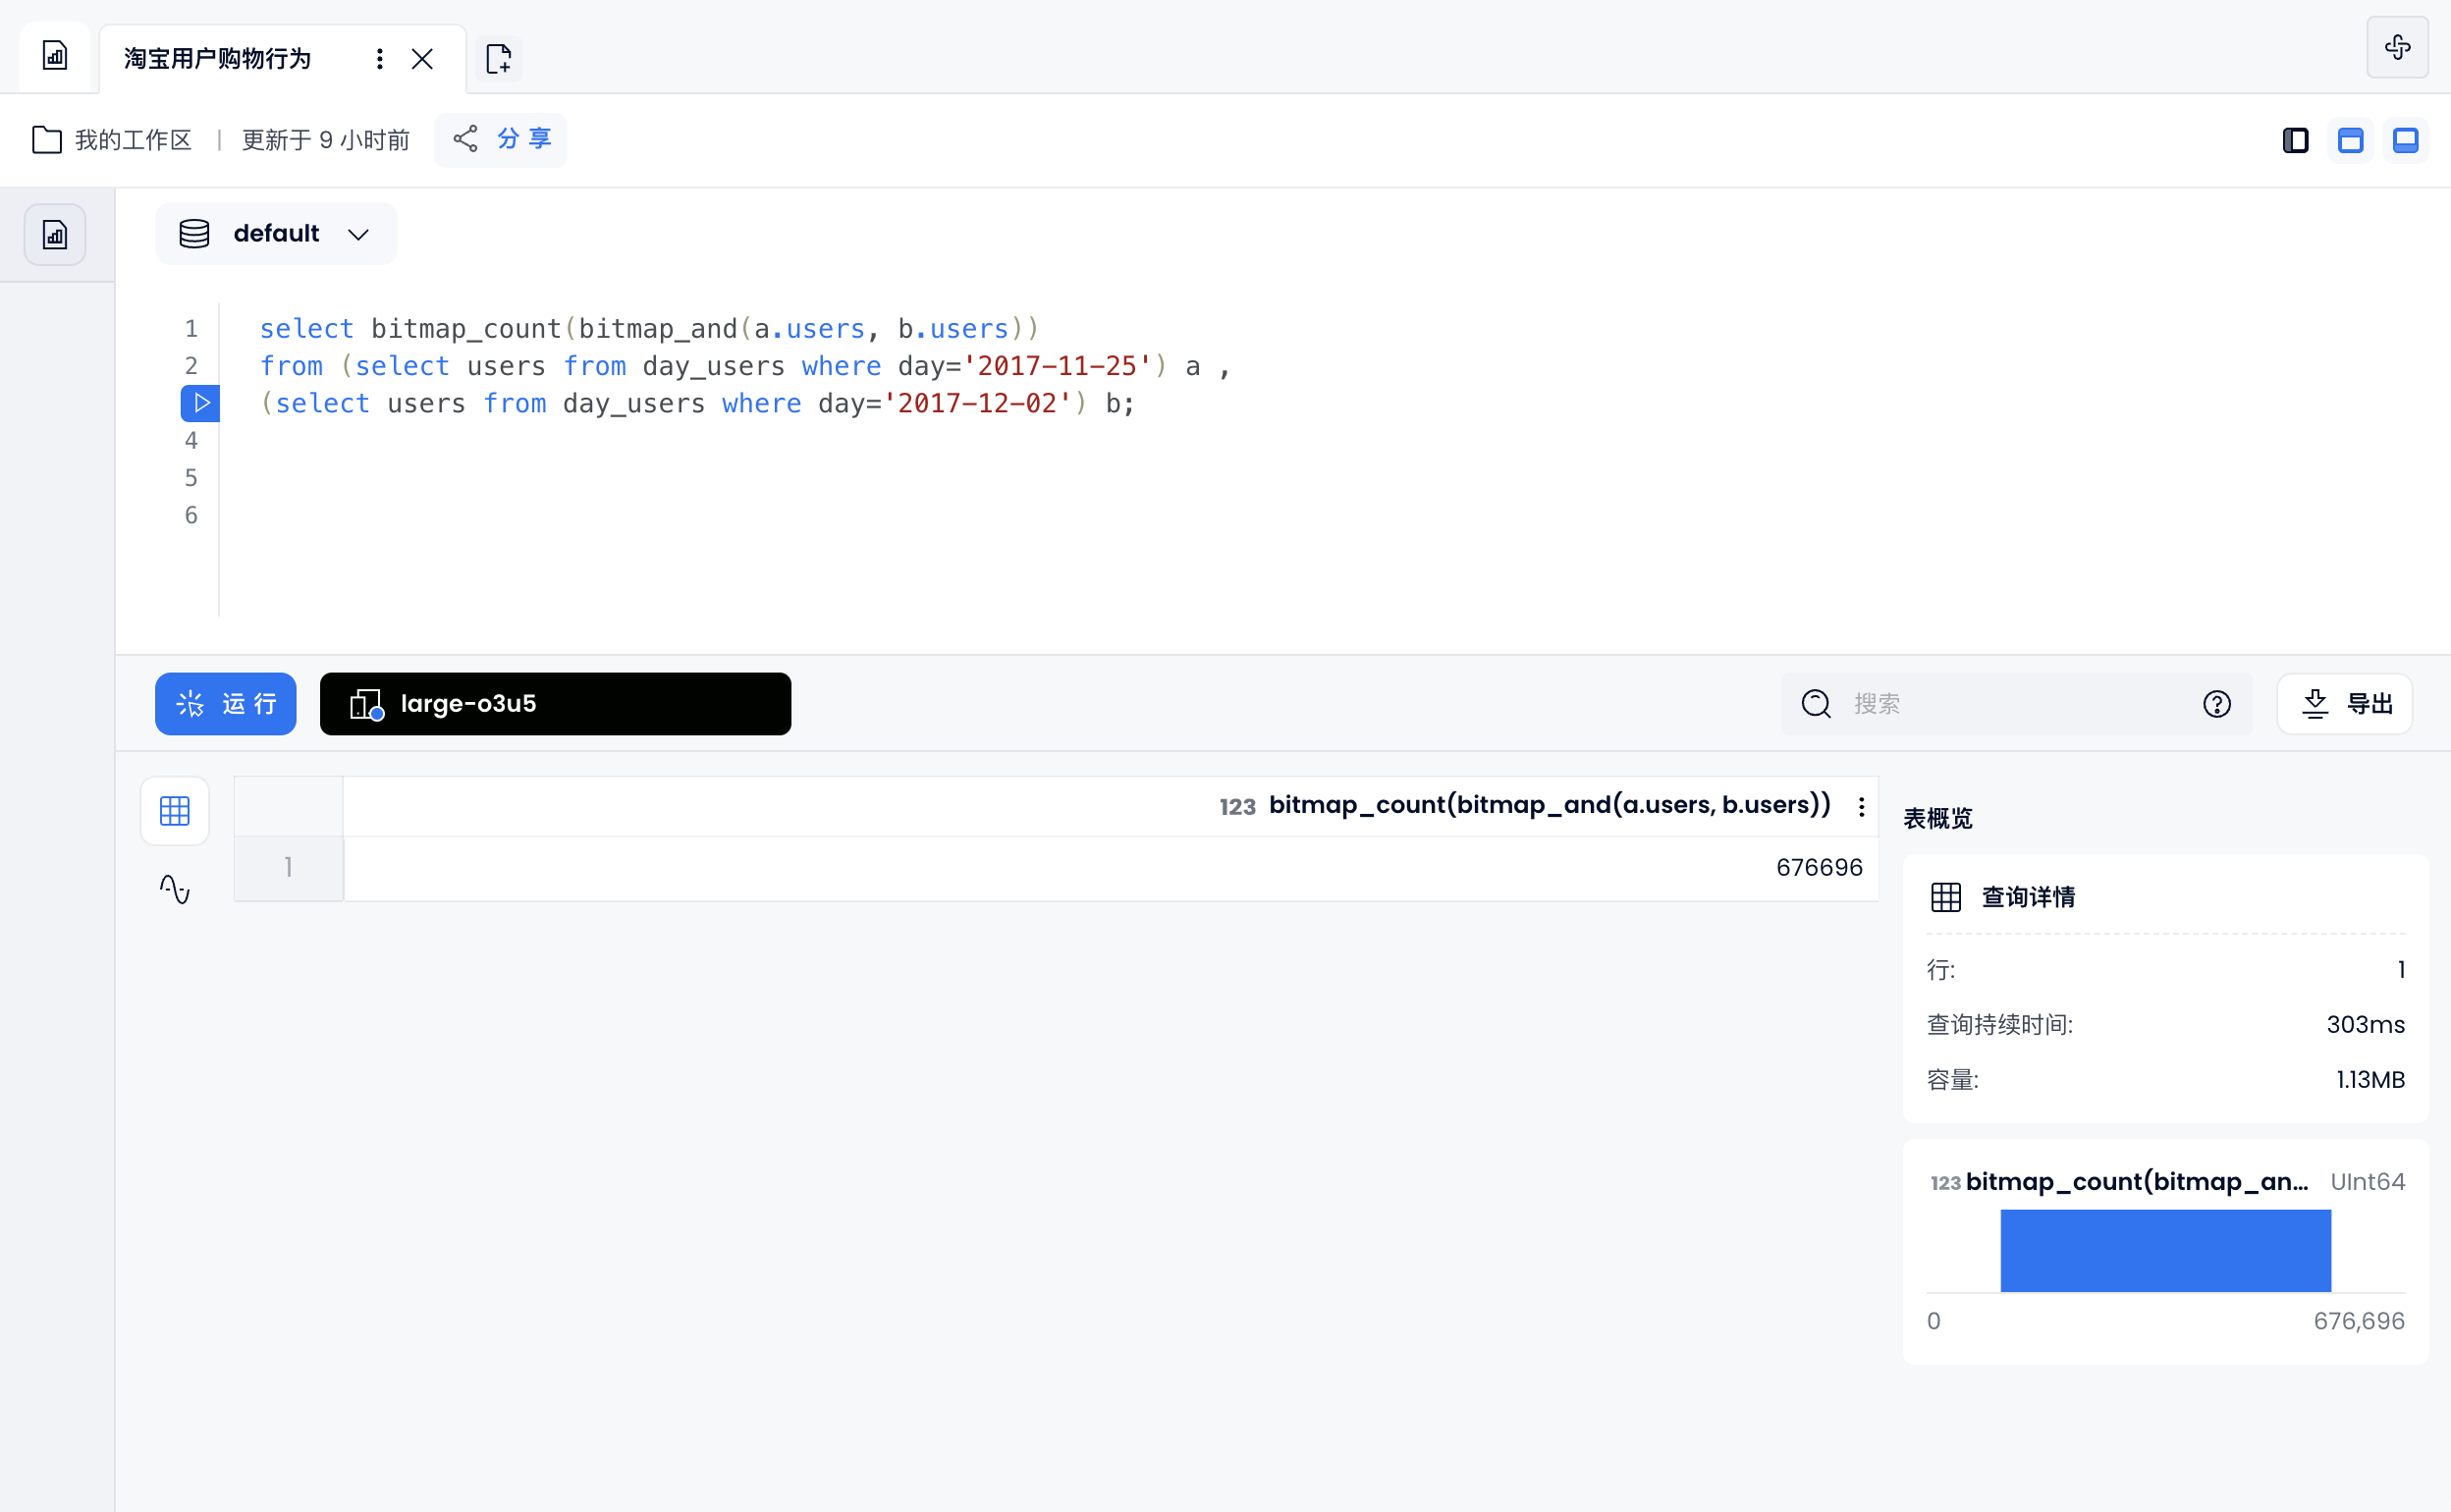
relative retention
Here we calculate users who are still using Taobao on December 2 compared to November 23:
select bitmap_count(bitmap_and(a.users, b.users))
from (select users from day_users where day='2017-11-25') a ,
(select users from day_users where day='2017-12-02') b;
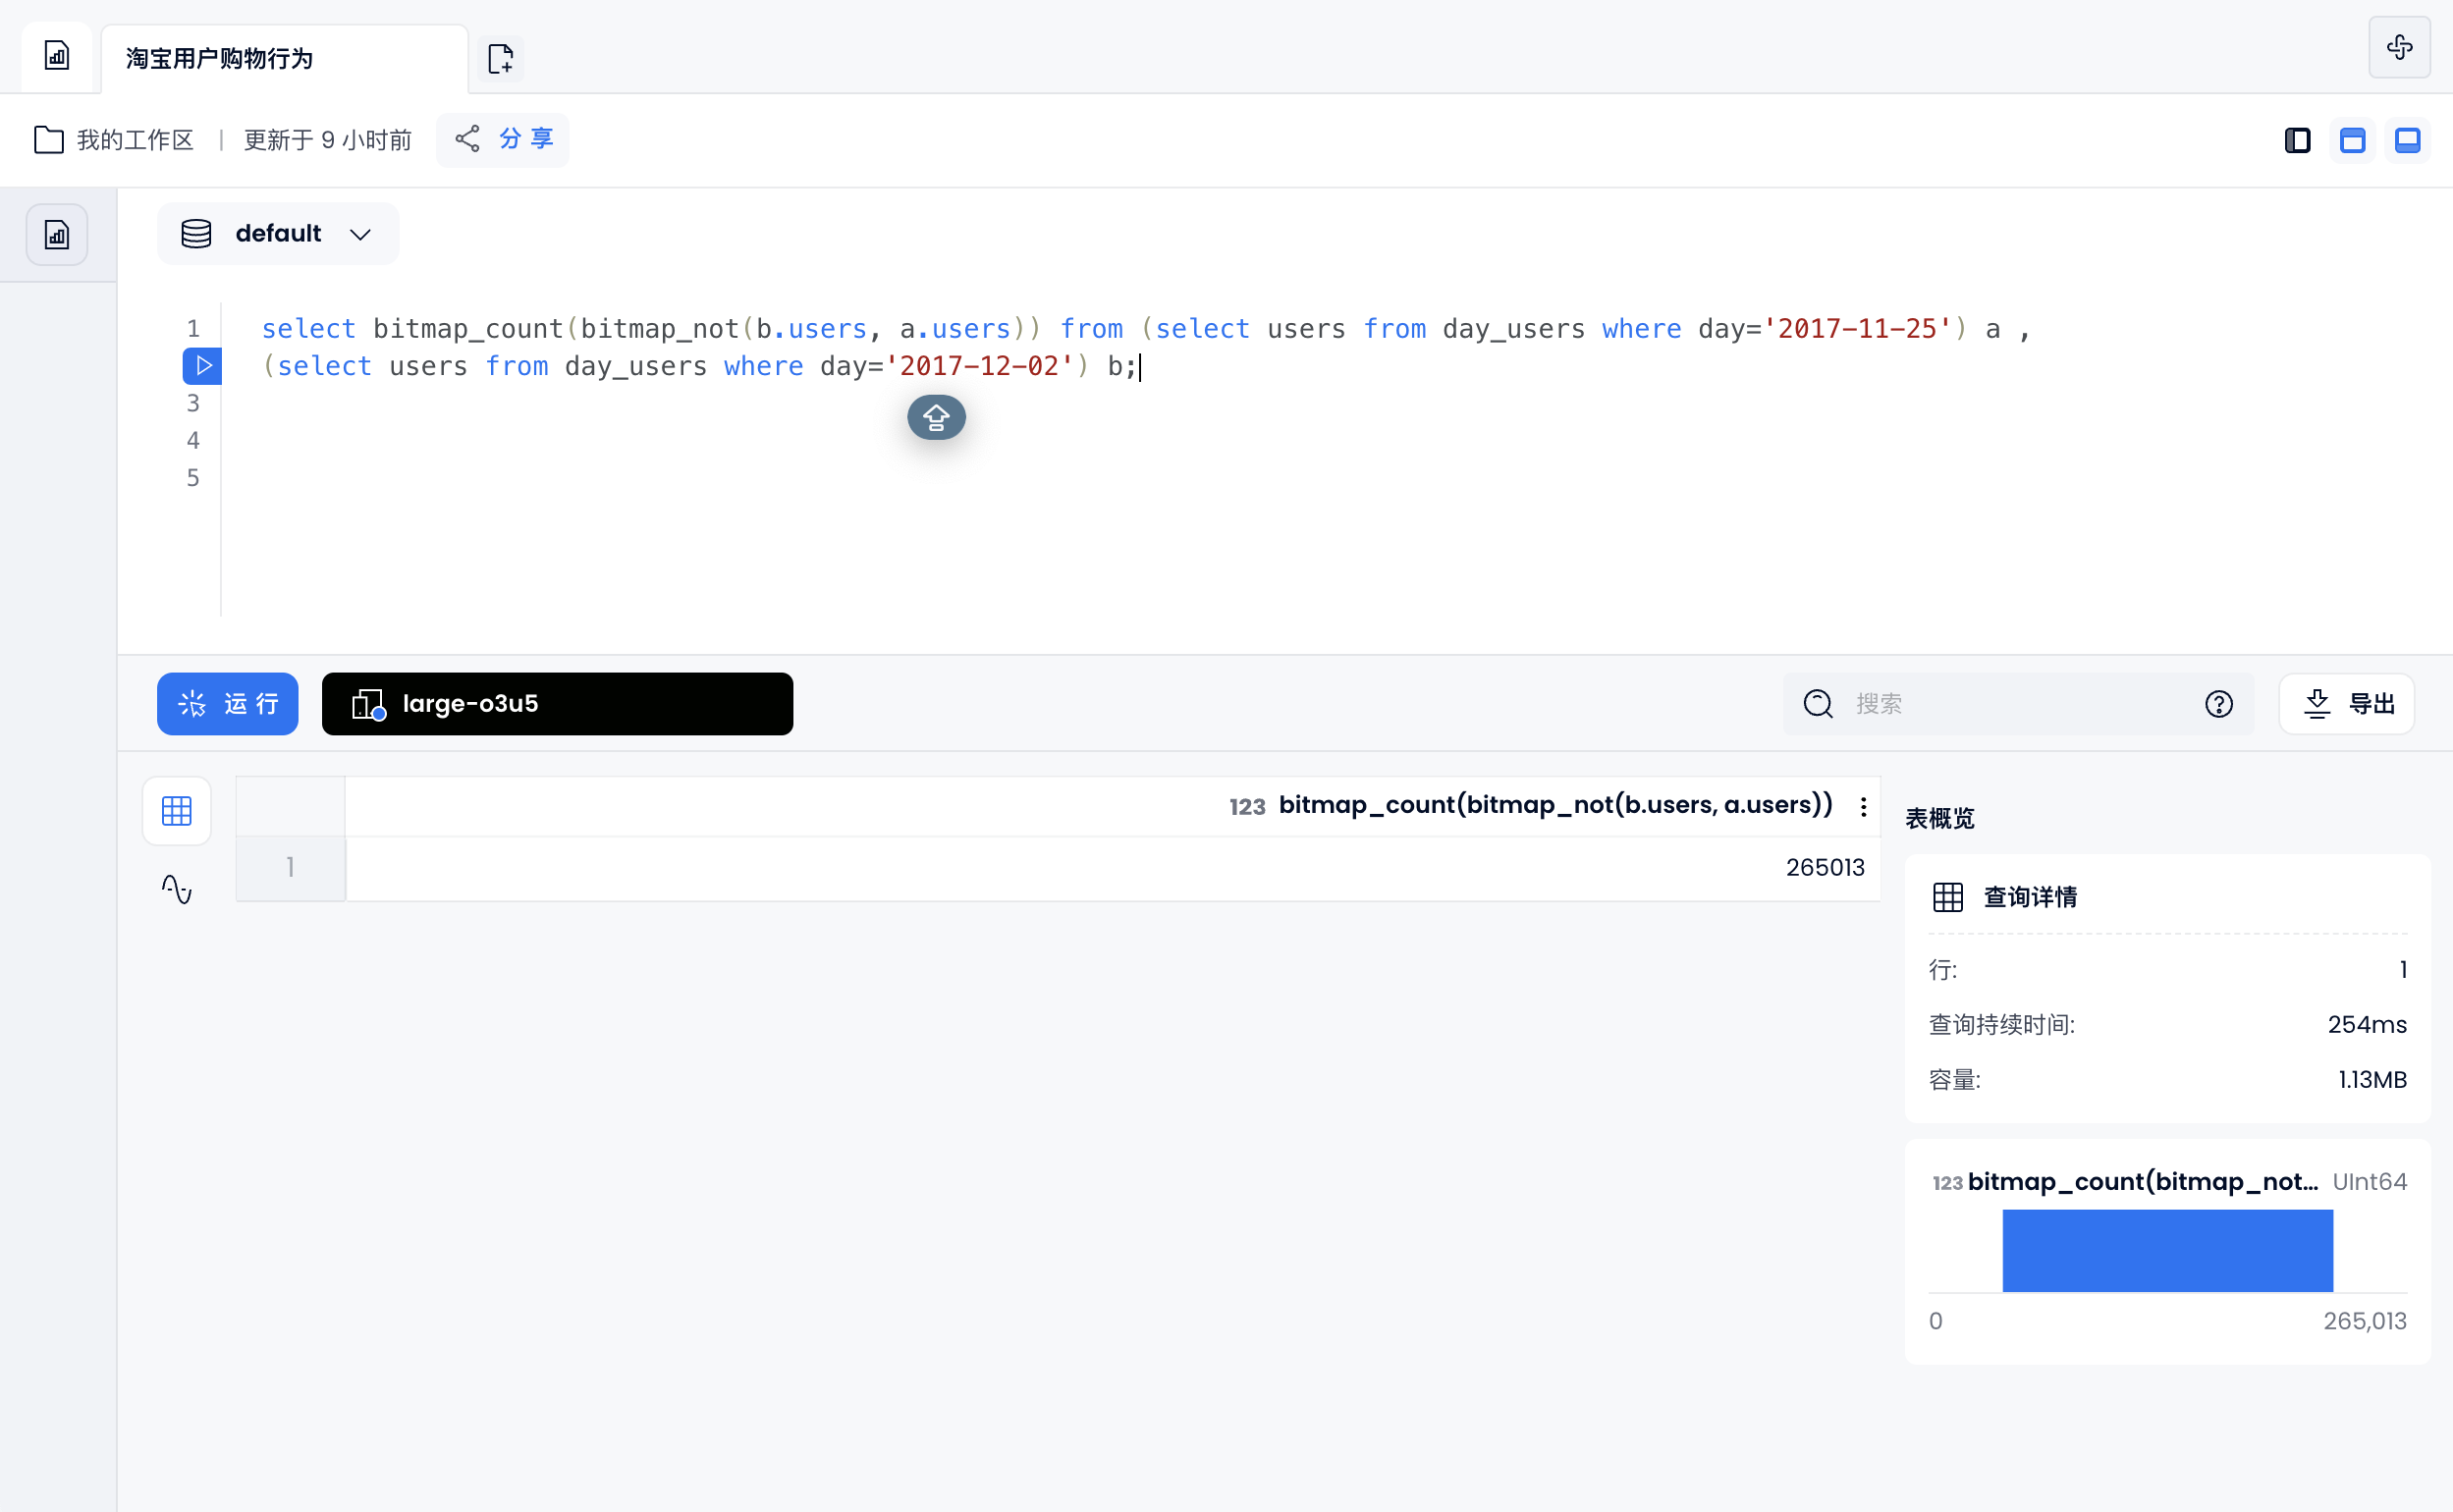
relatively new
select bitmap_count(bitmap_not(b.users, a.users)) from (select users from day_users where day='2017-11-25') a ,
(select users from day_users where day='2017-12-02') b;