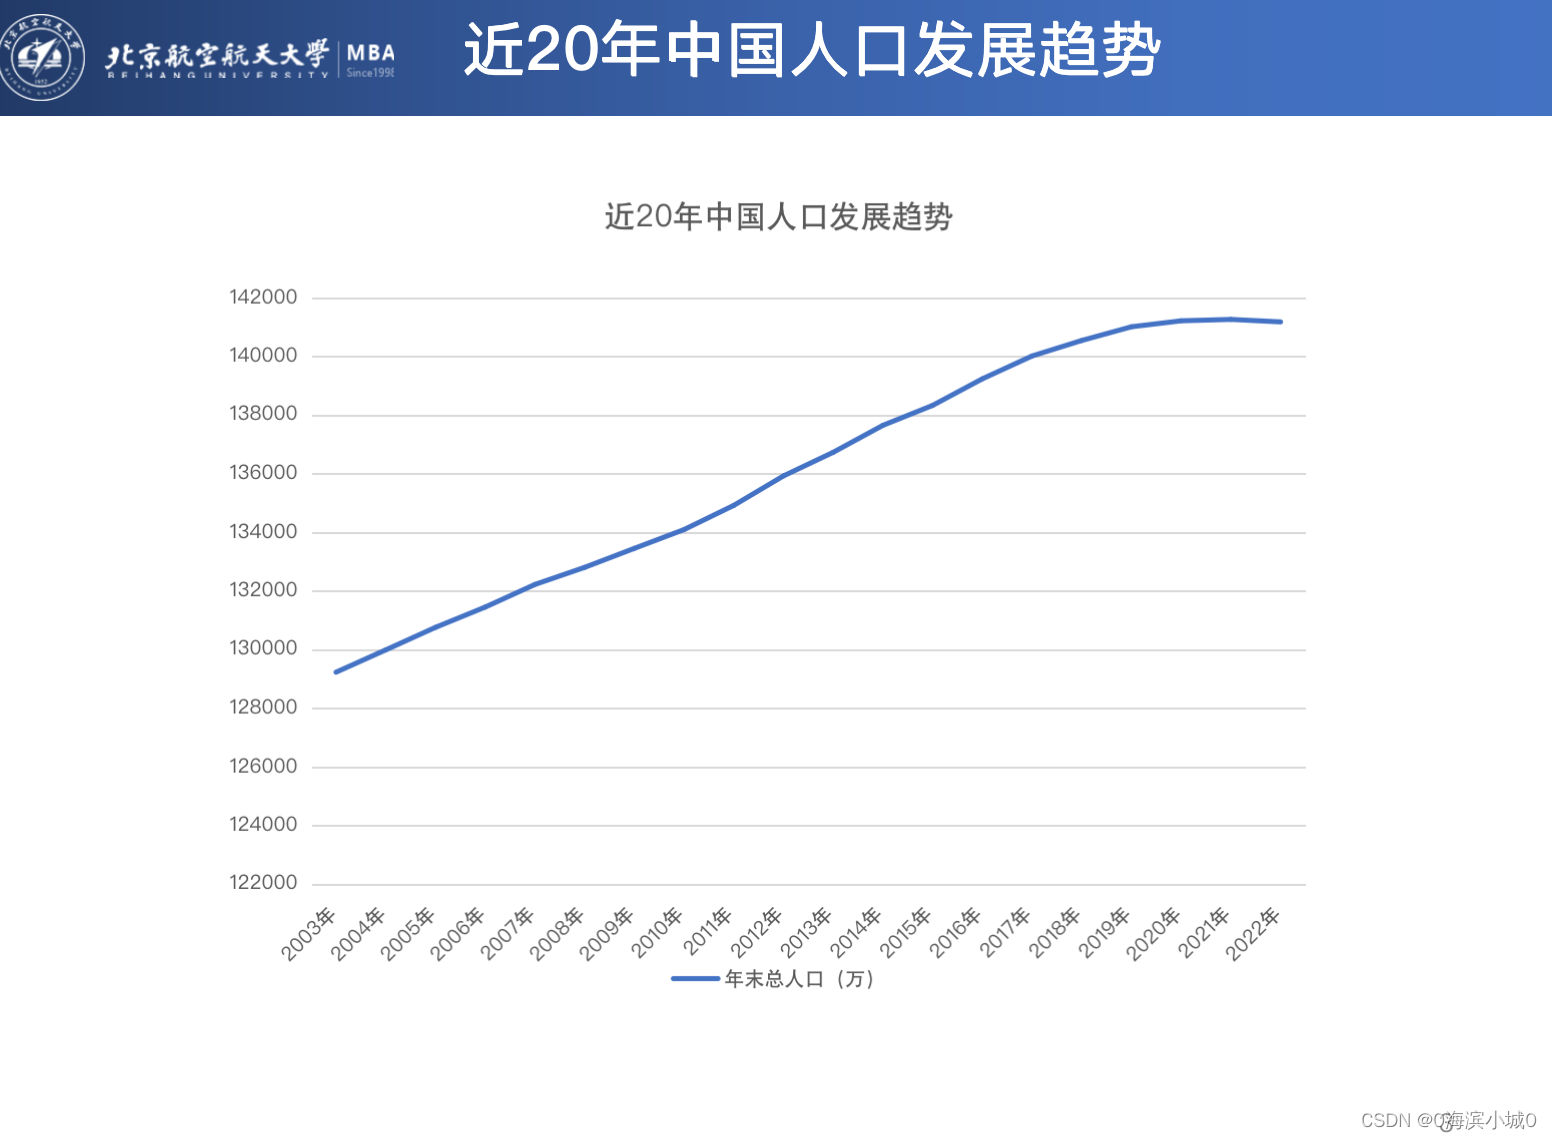
Figure 1 shows that China's population development trend is slowing down
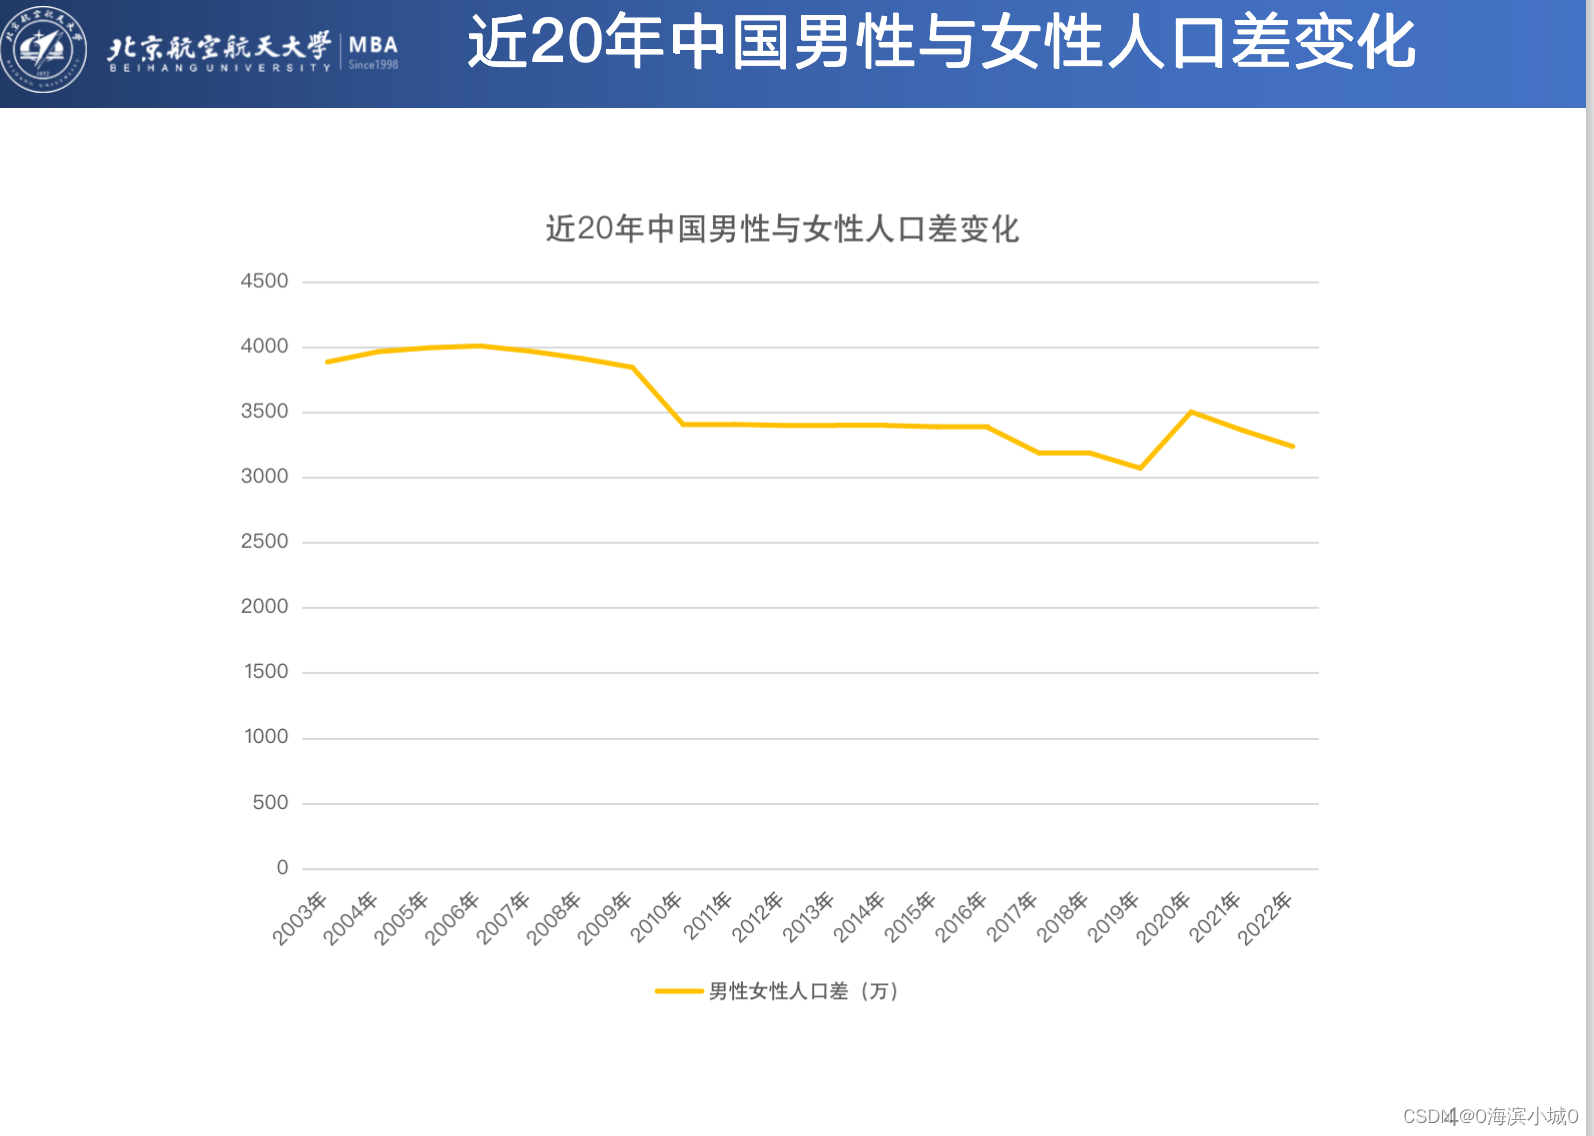
Figure 2 shows that the population gap between males and females in China continues to remain above 30 million, which is relatively stable
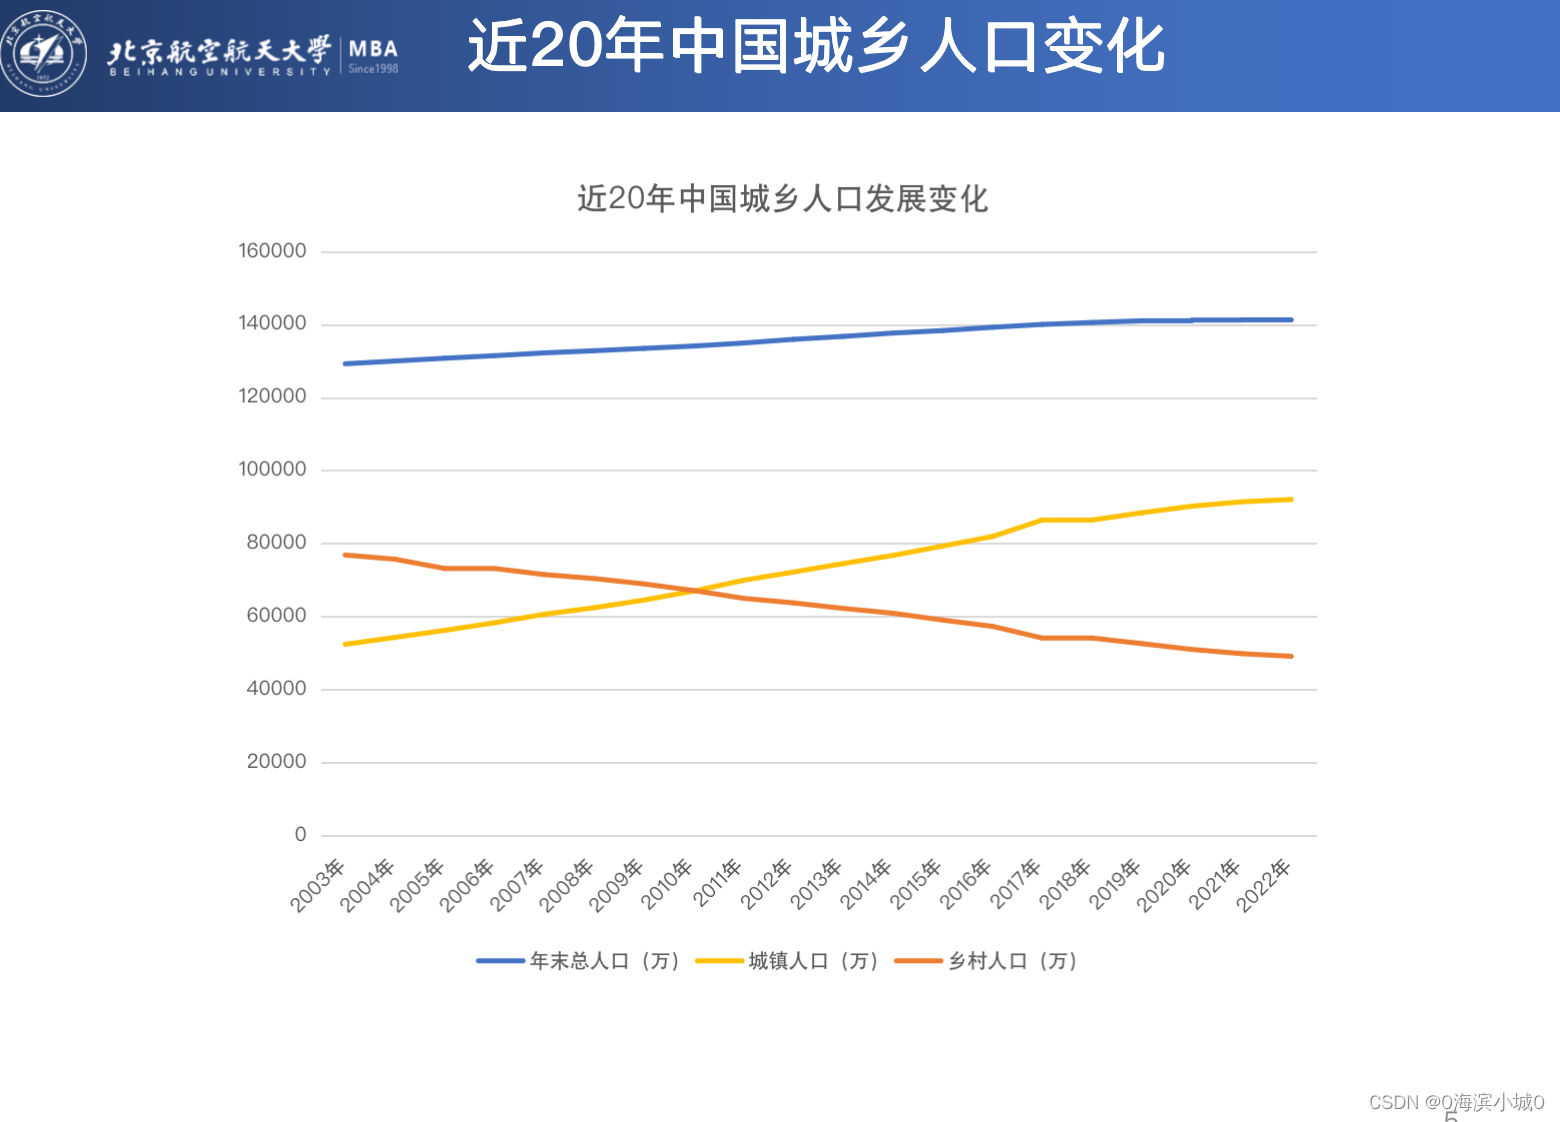
Figure 3 shows the development trend of China's urban and rural population. The urban population continues to grow, while the rural population continues to decrease, indicating that China's urbanization process continues

Figure 4 shows the natural population growth rate in China, the population growth has shown a negative growth, and the demographic dividend is fading;

Figure 5 The age structure of China's population shows that the number of elderly people over the age of 65 in China has continued to grow in the past 20 years
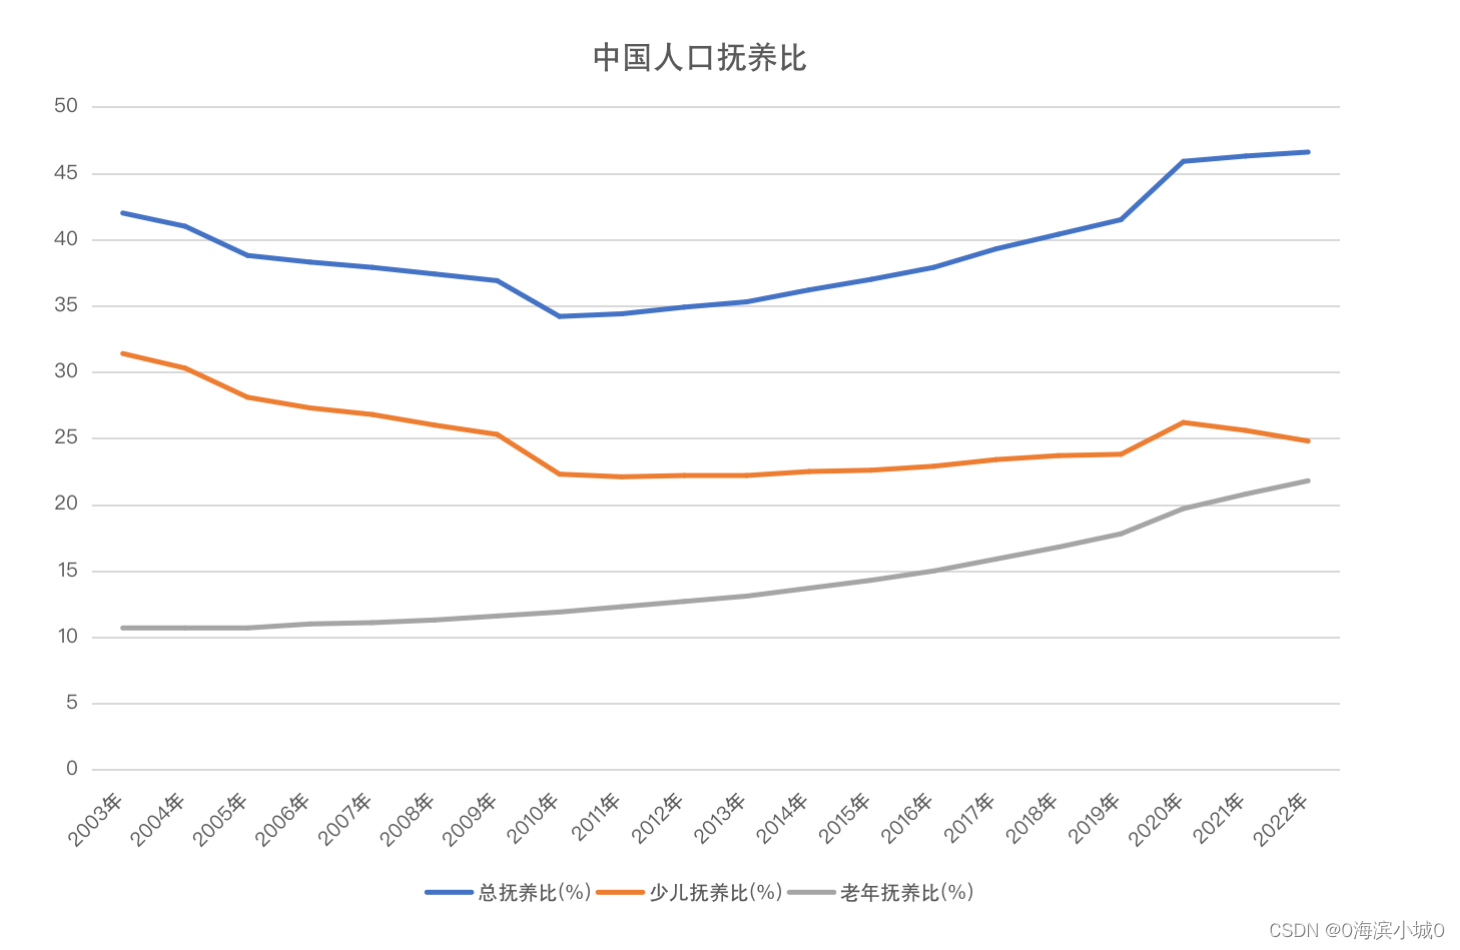
Figure 6 shows that the dependency ratio of China's population is increasing, and the trend of the dependency ratio of the elderly is also increasing, indicating that the pressure on China's elderly care is gradually increasing
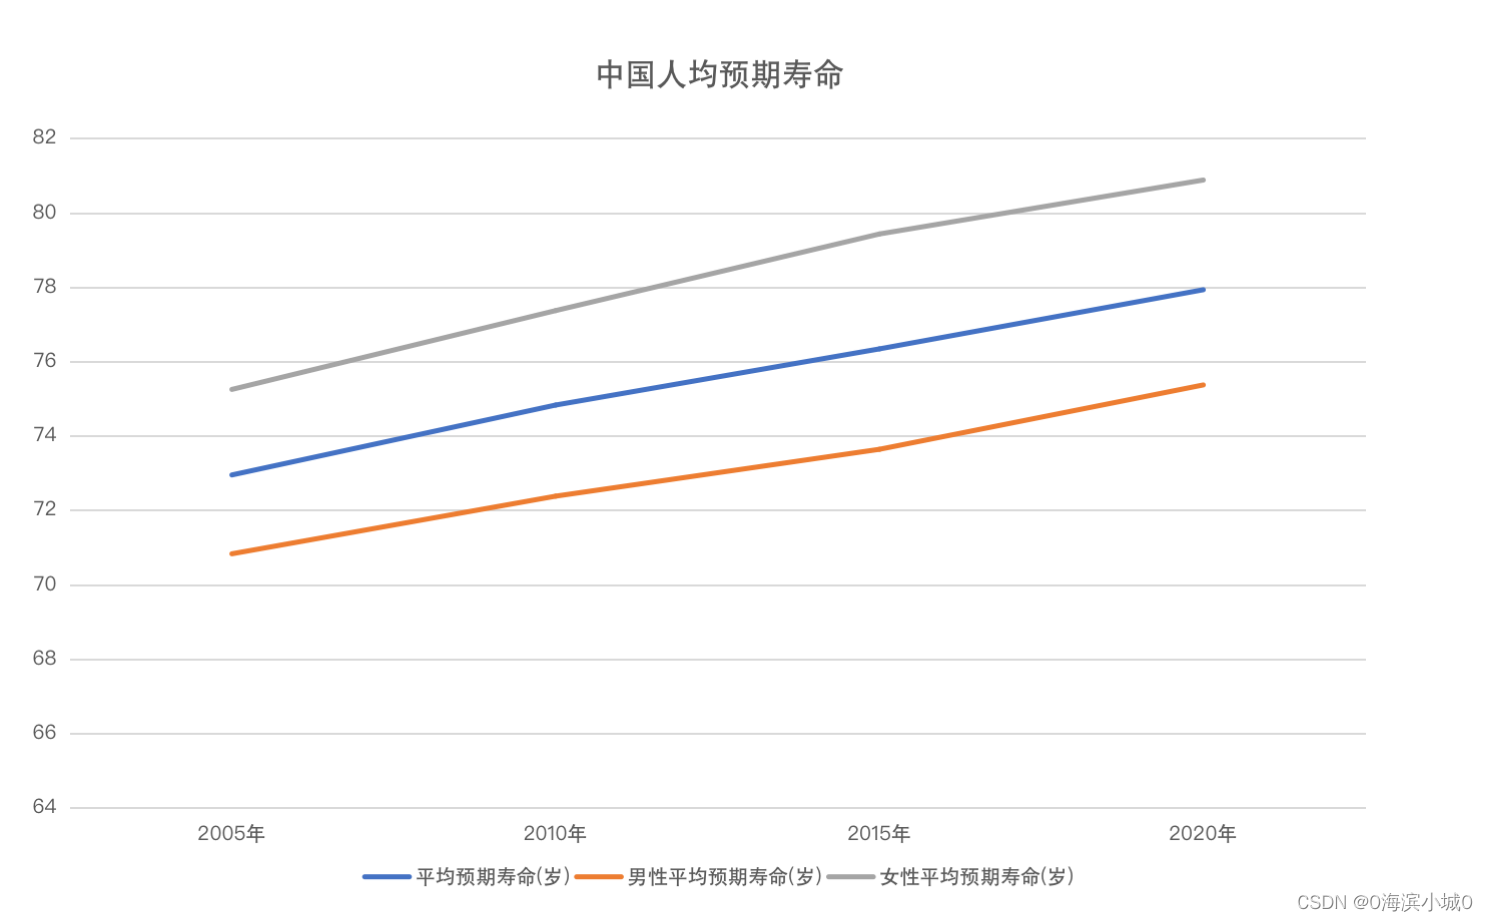
Figure 7 shows that the average life expectancy of both men and women in China is increasing, from 73 years old in 2005 to 78 years old in 2020, which also confirms that the number of elderly people is increasing, the dependency ratio of the elderly is increasing, and the pressure on pensions is increasing .